A European forest atlas · 1985—2024
The forest
remembers.
Was 2024 exceptional, or has disturbance become a lasting condition?
Michael Schymura /
Germany, Austria, Czechia, Poland, France and Spain
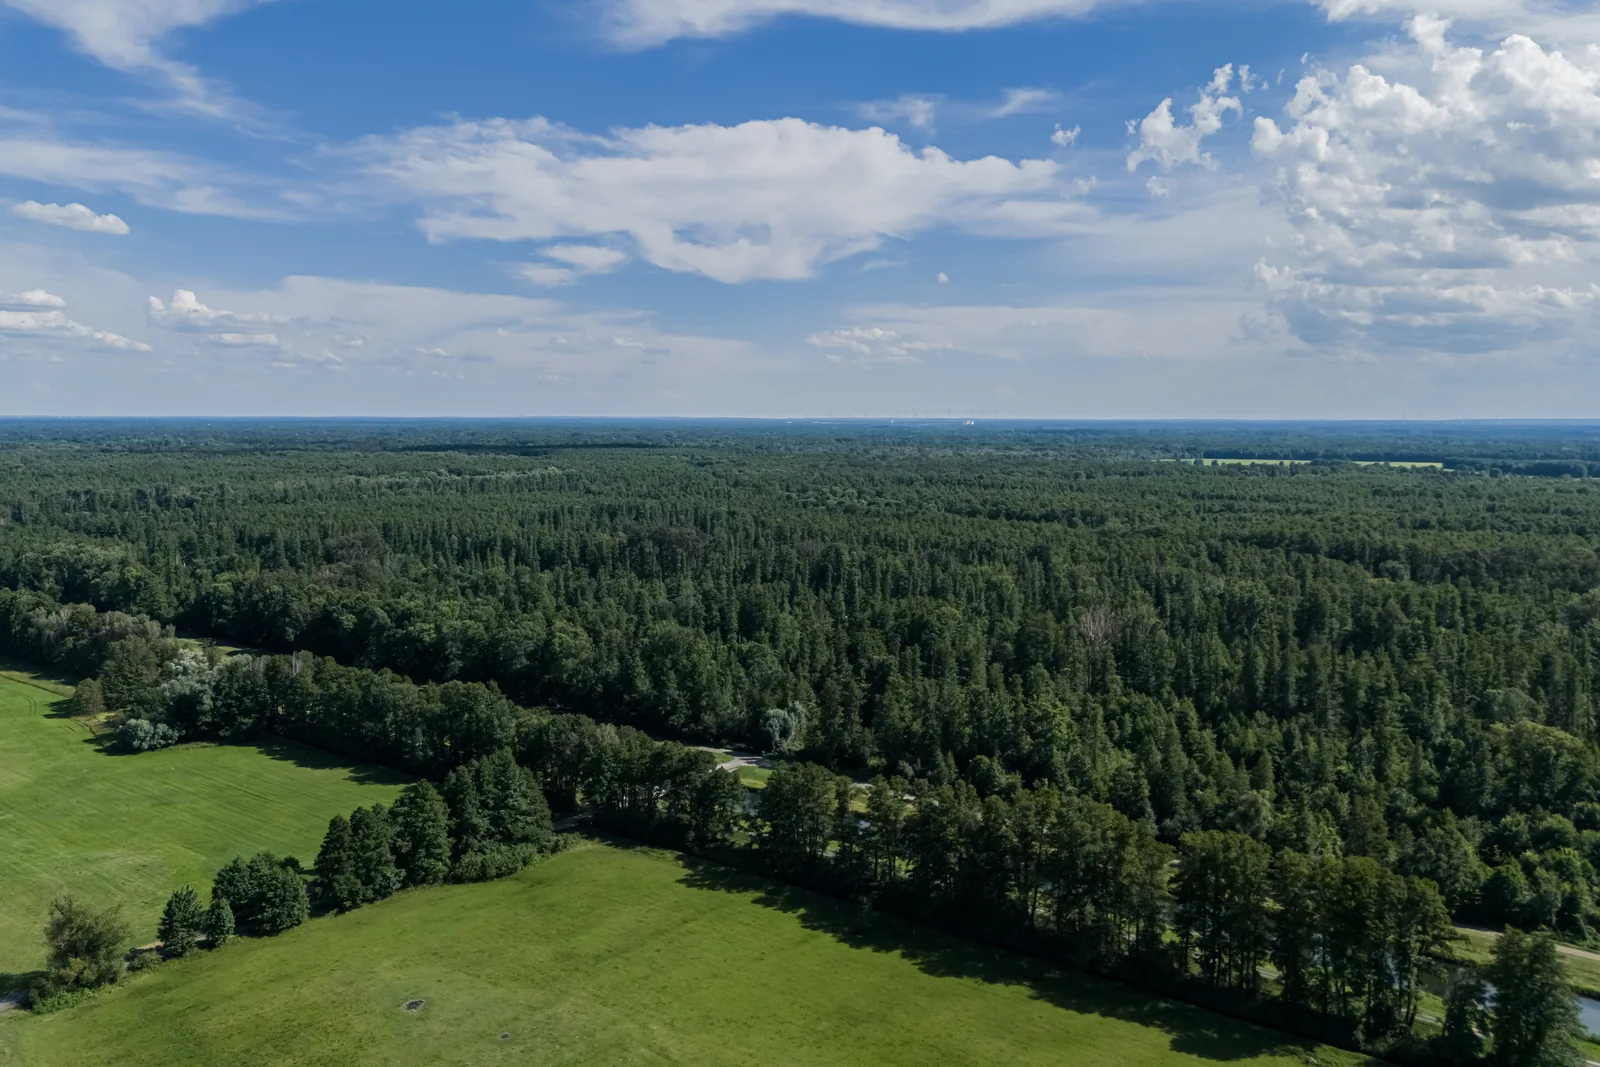
Spreewald, July 2024 · A.Savin, Wikipedia · Free Art License 1.3

Germany’s mean annual mapped disturbance in 2018–2024 was 2.25 times its 1985–2017 average. The latest year alone cannot tell that story. Forty satellite years and six countries reveal why a forest’s history matters.
Europe’s forest problem cannot be settled by the latest disaster photograph. The deeper question is whether disturbance remains an occasional interruption or has become a persistent landscape condition. Answering it requires a time series, a forest denominator and a careful account of what a satellite can see.
This investigation uses the newly released European Forest Disturbance Atlas v3 for Germany, Austria, Czechia, Poland, France and Spain. It calculates country-year measures from the raster products and compares selected patterns with a manually interpreted reference database. The result is a diagnosis of mapped disturbance, not a causal climate attribution or a forecast of forest collapse.
The country carried through the evidence
Germany / 20240.70% disturbed / 85,104 ha
EFDA v3 / 1985-2024. The spatial grid is fixed at 2024; pollen reconstruction has a separate clock.
The canopy / a much older landscape
Europe’s forests have never stood still.
A forest looks settled from a distance. Its history is less settled. After the last ice age, trees expanded from refuges as climates warmed; species arrived at different speeds and occupied changing combinations of soils, temperatures and disturbance. Later, farming, grazing, fuel demand and construction altered those landscapes again. The forest we recognize today is the outcome of those changes.
The human part of that history is much older than industrial forestry. Farming spread through southeastern and Mediterranean Europe from around 6000 BCE and then north of the Alps. Clearing opened land for crops and settlement, while the woodland that remained supplied construction material, tools and fuel. The arrival of metalworking added demand for charcoal. These were changes in the relationship between a productive landscape and the people drawing on it, not one simultaneous clearance of an entire continent.
By the High Middle Ages, population growth and economic activity intensified pressure on woodland in large parts of Europe. Glassmaking, mining and smelting added to household demand. Yet forest history does not follow a single downward line. Woodland could return when settlement and cultivation contracted; institutions and management practices changed what could be removed, where and by whom. Local histories of use matter because they help explain why the landscapes entering the satellite record are already different.
A forest landscape, reconstructed from pollen.
4251–3751 BCE / percent reconstructed woody cover
Mid-Holocene 5700-6200 cal BP
Pollen estimates, standard errors and site quality
| Cell / coordinates | Woody cover | Evergreen / SE | Summer-green / SE | Quality |
|---|---|---|---|---|
| 8 / -7.5, 40.5 | 37.73% | 5.93 / 1.44 | 31.80 / 8.36 | 1 |
| 9 / -6.5, 40.5 | 39.59% | 19.16 / 2.28 | 20.43 / 4.72 | 2 |
| 10 / -5.5, 40.5 | —% | — / — | — / — | Missing |
| 11 / -4.5, 40.5 | —% | — / — | — / — | Missing |
| 31 / 15.5, 40.5 | —% | — / — | — / — | Missing |
| 36 / 20.5, 40.5 | 66.86% | 65.30 / 106.70 | 1.56 / 1.07 | 1 |
| 37 / 21.5, 40.5 | 79.83% | 48.30 / 5.53 | 31.53 / 13.37 | 1 |
| 38 / 22.5, 40.5 | —% | — / — | — / — | Missing |
| 40 / 24.5, 40.5 | —% | — / — | — / — | Missing |
| 43 / 27.5, 40.5 | —% | — / — | — / — | Missing |
| 45 / 29.5, 40.5 | 89.94% | 40.45 / 10.25 | 49.49 / 13.90 | 1 |
| 46 / 30.5, 40.5 | —% | — / — | — / — | Missing |
| 47 / 31.5, 40.5 | 51.17% | 47.09 / 70.53 | 4.08 / 1.52 | 1 |
| 48 / 32.5, 40.5 | 79.12% | 78.03 / 140.43 | 1.10 / 0.73 | 2 |
| 62 / -3.5, 41.5 | 33.47% | 29.93 / 7.22 | 3.54 / 0.77 | 2 |
| 63 / -2.5, 41.5 | 67.93% | 29.79 / 7.65 | 38.14 / 5.77 | 2 |
| 65 / -0.5, 41.5 | 60.46% | 55.87 / 13.32 | 4.59 / 1.59 | 2 |
| 67 / 1.5, 41.5 | 39.35% | 32.91 / 14.34 | 6.44 / 2.58 | 2 |
| 78 / 12.5, 41.5 | 91.41% | 3.50 / 3.99 | 87.91 / 35.02 | 1 |
| 87 / 21.5, 41.5 | —% | — / — | — / — | Missing |
| 88 / 22.5, 41.5 | —% | — / — | — / — | Missing |
| 89 / 23.5, 41.5 | 59.93% | 51.13 / 41.17 | 8.81 / 4.19 | 1 |
| 90 / 24.5, 41.5 | 54.56% | 5.67 / 1.91 | 48.89 / 17.12 | 1 |
| 96 / 30.5, 41.5 | —% | — / — | — / — | Missing |
| 109 / -6.5, 42.5 | 44.91% | 13.58 / 5.85 | 31.33 / 9.35 | 1 |
| 112 / -3.5, 42.5 | 74.22% | 37.03 / 8.87 | 37.19 / 4.56 | 2 |
| 113 / -2.5, 42.5 | 75.67% | 20.97 / 5.00 | 54.70 / 4.61 | 2 |
| 115 / -0.5, 42.5 | 43.38% | 6.94 / 2.51 | 36.44 / 5.06 | 1 |
| 116 / 0.5, 42.5 | 58.08% | 40.62 / 22.10 | 17.46 / 1.78 | 1 |
| 117 / 1.5, 42.5 | 69.91% | 56.36 / 8.17 | 13.54 / 7.26 | 1 |
| 118 / 2.5, 42.5 | —% | — / — | — / — | Missing |
| 126 / 10.5, 42.5 | 72.75% | 50.70 / 10.66 | 22.05 / 4.82 | 1 |
| 127 / 11.5, 42.5 | 88.70% | 10.48 / 5.29 | 78.23 / 7.30 | 1 |
| 128 / 12.5, 42.5 | 25.66% | 12.63 / 10.90 | 13.03 / 3.01 | 2 |
| 138 / 22.5, 42.5 | 98.76% | 96.03 / 190.64 | 2.73 / 2.25 | 2 |
| 139 / 23.5, 42.5 | 68.34% | 60.91 / 13.18 | 7.42 / 0.91 | 1 |
| 140 / 24.5, 42.5 | —% | — / — | — / — | Missing |
| 142 / 26.5, 42.5 | 50.68% | 11.91 / 15.97 | 38.77 / 5.84 | 2 |
| 143 / 27.5, 42.5 | 70.39% | 3.68 / 0.55 | 66.71 / 21.83 | 1 |
| 161 / -4.5, 43.5 | —% | — / — | — / — | Missing |
| 162 / -3.5, 43.5 | —% | — / — | — / — | Missing |
| 163 / -2.5, 43.5 | 27.58% | 2.19 / 0.70 | 25.39 / 2.65 | 2 |
| 164 / -1.5, 43.5 | 35.27% | 2.05 / 0.40 | 33.22 / 5.81 | 1 |
| 165 / -0.5, 43.5 | 43.25% | 1.89 / 0.67 | 41.36 / 4.18 | 1 |
| 166 / 0.5, 43.5 | 64.33% | 1.60 / 0.93 | 62.73 / 5.15 | 2 |
| 167 / 1.5, 43.5 | —% | — / — | — / — | Missing |
| 168 / 2.5, 43.5 | 73.27% | 27.92 / 5.26 | 45.35 / 12.05 | 1 |
| 172 / 6.5, 43.5 | —% | — / — | — / — | Missing |
| 173 / 7.5, 43.5 | 78.86% | 56.68 / 77.15 | 22.18 / 9.36 | 2 |
| 176 / 10.5, 43.5 | 87.38% | 79.95 / 139.54 | 7.43 / 4.31 | 1 |
| 178 / 12.5, 43.5 | —% | — / — | — / — | Missing |
| 193 / 27.5, 43.5 | 83.99% | 9.38 / 12.85 | 74.61 / 10.30 | 1 |
| 194 / 28.5, 43.5 | 47.78% | 7.83 / 5.51 | 39.96 / 6.06 | 1 |
| 218 / 2.5, 44.5 | 89.83% | 21.20 / 29.61 | 68.63 / 10.44 | 2 |
| 219 / 3.5, 44.5 | 64.03% | 16.58 / 8.74 | 47.45 / 5.12 | 1 |
| 221 / 5.5, 44.5 | 95.16% | 93.28 / 1.15 | 1.89 / 0.49 | 1 |
| 222 / 6.5, 44.5 | 94.50% | 92.92 / 7.03 | 1.58 / 0.71 | 1 |
| 223 / 7.5, 44.5 | 93.17% | 90.27 / 2.73 | 2.90 / 0.47 | 1 |
| 226 / 10.5, 44.5 | 95.23% | 89.30 / 4.42 | 5.93 / 1.40 | 1 |
| 231 / 15.5, 44.5 | 42.98% | 28.96 / 38.44 | 14.01 / 2.61 | 1 |
| 242 / 26.5, 44.5 | 96.88% | 3.34 / 0.95 | 93.54 / 13.39 | 2 |
| 243 / 27.5, 44.5 | —% | — / — | — / — | Missing |
| 268 / 2.5, 45.5 | 78.08% | 38.21 / 16.54 | 39.87 / 6.11 | 1 |
| 271 / 5.5, 45.5 | 95.67% | 84.34 / 9.76 | 11.32 / 3.44 | 1 |
| 272 / 6.5, 45.5 | —% | — / — | — / — | Missing |
| 273 / 7.5, 45.5 | —% | — / — | — / — | Missing |
| 274 / 8.5, 45.5 | —% | — / — | — / — | Missing |
| 288 / 22.5, 45.5 | 85.07% | 33.22 / 12.11 | 51.85 / 7.94 | 1 |
| 291 / 25.5, 45.5 | 95.99% | 40.26 / 6.42 | 55.74 / 4.09 | 2 |
| 292 / 26.5, 45.5 | 93.07% | 14.12 / 3.01 | 78.94 / 7.64 | 2 |
| 320 / 4.5, 46.5 | —% | — / — | — / — | Missing |
| 321 / 5.5, 46.5 | —% | — / — | — / — | Missing |
| 322 / 6.5, 46.5 | 94.32% | 82.99 / 4.55 | 11.33 / 1.97 | 1 |
| 323 / 7.5, 46.5 | 76.83% | 70.69 / 8.79 | 6.15 / 1.58 | 1 |
| 324 / 8.5, 46.5 | 42.78% | 38.35 / 9.44 | 4.43 / 1.52 | 1 |
| 325 / 9.5, 46.5 | —% | — / — | — / — | Missing |
| 326 / 10.5, 46.5 | 31.84% | 29.10 / 3.05 | 2.74 / 0.42 | 1 |
| 339 / 23.5, 46.5 | 94.83% | 33.17 / 4.89 | 61.66 / 5.46 | 2 |
| 341 / 25.5, 46.5 | 95.82% | 13.98 / 2.24 | 81.83 / 4.96 | 2 |
| 348 / 32.5, 46.5 | 51.53% | 24.41 / 6.19 | 27.12 / 2.86 | 2 |
| 362 / -3.5, 47.5 | 7.90% | 0.70 / 0.40 | 7.20 / 1.41 | 2 |
| 363 / -2.5, 47.5 | 15.86% | 0.30 / 0.27 | 15.57 / 6.88 | 1 |
| 364 / -1.5, 47.5 | 69.53% | 4.46 / 2.48 | 65.07 / 6.51 | 1 |
| 365 / -0.5, 47.5 | 59.56% | 2.44 / 0.35 | 57.12 / 5.02 | 1 |
| 369 / 3.5, 47.5 | 88.76% | 1.12 / 0.42 | 87.64 / 6.64 | 2 |
| 370 / 4.5, 47.5 | 75.68% | 1.53 / 0.29 | 74.15 / 6.73 | 1 |
| 372 / 6.5, 47.5 | 86.10% | 35.11 / 52.76 | 50.99 / 13.13 | 2 |
| 373 / 7.5, 47.5 | 96.39% | 58.78 / 22.10 | 37.61 / 13.46 | 1 |
| 374 / 8.5, 47.5 | 70.01% | 21.08 / 11.92 | 48.93 / 8.19 | 1 |
| 375 / 9.5, 47.5 | 95.30% | 71.04 / 18.47 | 24.26 / 10.83 | 1 |
| 379 / 13.5, 47.5 | —% | — / — | — / — | Missing |
| 387 / 21.5, 47.5 | 80.20% | 11.77 / 6.36 | 68.43 / 4.86 | 1 |
| 388 / 22.5, 47.5 | 92.65% | 53.62 / 8.79 | 39.03 / 6.29 | 2 |
| 389 / 23.5, 47.5 | 85.96% | 33.28 / 3.33 | 52.68 / 3.52 | 1 |
| 390 / 24.5, 47.5 | 91.11% | 48.38 / 9.07 | 42.73 / 3.98 | 1 |
| 391 / 25.5, 47.5 | 61.10% | 19.56 / 4.48 | 41.54 / 6.52 | 2 |
| 411 / -4.5, 48.5 | 73.50% | 0.09 / 0.14 | 73.42 / 8.44 | 2 |
| 412 / -3.5, 48.5 | 52.49% | 0.08 / 0.00 | 52.42 / 6.57 | 1 |
| 414 / -1.5, 48.5 | —% | — / — | — / — | Missing |
| 415 / -0.5, 48.5 | 92.99% | 0.46 / 0.41 | 92.54 / 10.68 | 2 |
| 417 / 1.5, 48.5 | 46.91% | 3.05 / 0.93 | 43.85 / 3.62 | 2 |
| 418 / 2.5, 48.5 | 24.98% | 1.69 / 0.56 | 23.28 / 4.91 | 1 |
| 419 / 3.5, 48.5 | 12.27% | 1.99 / 0.65 | 10.28 / 1.50 | 2 |
| 422 / 6.5, 48.5 | 37.15% | 4.04 / 2.30 | 33.11 / 7.07 | 1 |
| 423 / 7.5, 48.5 | —% | — / — | — / — | Missing |
| 424 / 8.5, 48.5 | 86.43% | 39.76 / 5.92 | 46.67 / 5.49 | 1 |
| 425 / 9.5, 48.5 | —% | — / — | — / — | Missing |
| 429 / 13.5, 48.5 | 89.64% | 66.23 / 56.42 | 23.41 / 6.27 | 2 |
| 432 / 16.5, 48.5 | 25.07% | 20.24 / 4.76 | 4.84 / 1.23 | 2 |
| 433 / 17.5, 48.5 | 37.84% | 15.40 / 3.90 | 22.44 / 6.59 | 1 |
| 438 / 22.5, 48.5 | 95.38% | 2.94 / 0.74 | 92.44 / 6.12 | 2 |
| 444 / 28.5, 48.5 | —% | — / — | — / — | Missing |
| 459 / -6.5, 49.5 | —% | — / — | — / — | Missing |
| 468 / 2.5, 49.5 | 36.42% | 0.71 / 0.64 | 35.71 / 5.94 | 2 |
| 478 / 12.5, 49.5 | 63.52% | 30.64 / 5.66 | 32.89 / 4.27 | 1 |
| 479 / 13.5, 49.5 | 89.79% | 42.69 / 10.10 | 47.10 / 4.01 | 2 |
| 480 / 14.5, 49.5 | 57.19% | 43.49 / 23.86 | 13.70 / 3.51 | 1 |
| 481 / 15.5, 49.5 | —% | — / — | — / — | Missing |
| 484 / 18.5, 49.5 | 86.43% | 40.14 / 5.76 | 46.30 / 4.09 | 2 |
| 485 / 19.5, 49.5 | 77.57% | 53.71 / 18.43 | 23.86 / 4.09 | 1 |
| 486 / 20.5, 49.5 | 91.72% | 47.60 / 5.46 | 44.13 / 2.75 | 2 |
| 487 / 21.5, 49.5 | 53.96% | 9.66 / 3.79 | 44.30 / 5.83 | 1 |
| 488 / 22.5, 49.5 | 42.36% | 17.67 / 3.18 | 24.69 / 2.43 | 1 |
| 491 / 25.5, 49.5 | 78.57% | 70.44 / 20.12 | 8.14 / 3.64 | 2 |
| 497 / 31.5, 49.5 | —% | — / — | — / — | Missing |
| 512 / -3.5, 50.5 | 45.64% | 0.69 / 0.24 | 44.95 / 2.03 | 1 |
| 514 / -1.5, 50.5 | 71.63% | 0.64 / 0.24 | 70.99 / 8.22 | 1 |
| 515 / -0.5, 50.5 | 80.60% | 0.95 / 0.22 | 79.65 / 5.59 | 2 |
| 516 / 0.5, 50.5 | 68.41% | 0.44 / 0.25 | 67.98 / 7.88 | 1 |
| 522 / 6.5, 50.5 | 95.89% | 0.31 / 0.10 | 95.58 / 4.95 | 2 |
| 526 / 10.5, 50.5 | 74.78% | 6.19 / 3.70 | 68.59 / 6.08 | 2 |
| 527 / 11.5, 50.5 | 58.34% | 28.43 / 3.15 | 29.91 / 2.44 | 2 |
| 529 / 13.5, 50.5 | 73.61% | 49.78 / 18.24 | 23.83 / 6.36 | 1 |
| 530 / 14.5, 50.5 | 90.44% | 17.17 / 2.49 | 73.27 / 4.07 | 1 |
| 531 / 15.5, 50.5 | —% | — / — | — / — | Missing |
| 532 / 16.5, 50.5 | 94.65% | 31.91 / 9.10 | 62.74 / 7.56 | 1 |
| 533 / 17.5, 50.5 | —% | — / — | — / — | Missing |
| 536 / 20.5, 50.5 | 89.23% | 19.35 / 2.35 | 69.88 / 5.73 | 1 |
| 537 / 21.5, 50.5 | 76.08% | 8.62 / 2.16 | 67.46 / 3.89 | 1 |
| 540 / 24.5, 50.5 | 62.58% | 51.50 / 14.27 | 11.08 / 2.87 | 2 |
| 556 / -9.5, 51.5 | —% | — / — | — / — | Missing |
| 561 / -4.5, 51.5 | 17.39% | 0.95 / 0.32 | 16.43 / 0.73 | 1 |
| 562 / -3.5, 51.5 | 60.07% | 0.82 / 0.11 | 59.25 / 6.67 | 1 |
| 565 / -0.5, 51.5 | 8.93% | 1.66 / 1.26 | 7.28 / 2.36 | 2 |
| 566 / 0.5, 51.5 | 26.87% | 0.46 / 0.23 | 26.42 / 5.21 | 1 |
| 575 / 9.5, 51.5 | 91.18% | 3.37 / 1.39 | 87.81 / 11.92 | 2 |
| 576 / 10.5, 51.5 | 85.11% | 6.60 / 2.69 | 78.52 / 22.37 | 1 |
| 580 / 14.5, 51.5 | 79.17% | 24.43 / 5.99 | 54.75 / 5.28 | 2 |
| 586 / 20.5, 51.5 | 32.63% | 13.90 / 3.38 | 18.73 / 2.95 | 2 |
| 605 / -10.5, 52.5 | 69.10% | 8.11 / 2.17 | 60.99 / 5.75 | 2 |
| 606 / -9.5, 52.5 | 58.30% | 29.39 / 13.64 | 28.91 / 6.87 | 1 |
| 607 / -8.5, 52.5 | 84.83% | 10.92 / 3.02 | 73.91 / 6.66 | 2 |
| 608 / -7.5, 52.5 | 70.06% | 6.70 / 1.82 | 63.36 / 5.48 | 2 |
| 609 / -6.5, 52.5 | 80.27% | 16.37 / 7.80 | 63.90 / 5.07 | 1 |
| 612 / -3.5, 52.5 | —% | — / — | — / — | Missing |
| 613 / -2.5, 52.5 | —% | — / — | — / — | Missing |
| 615 / -0.5, 52.5 | —% | — / — | — / — | Missing |
| 616 / 0.5, 52.5 | 94.43% | 0.15 / 0.03 | 94.29 / 19.42 | 1 |
| 622 / 6.5, 52.5 | 100.00% | 4.81 / 1.21 | 95.19 / 5.59 | 2 |
| 624 / 8.5, 52.5 | 79.52% | 6.24 / 1.46 | 73.28 / 5.23 | 2 |
| 627 / 11.5, 52.5 | 85.15% | 21.22 / 4.82 | 63.93 / 3.95 | 1 |
| 628 / 12.5, 52.5 | 73.71% | 33.58 / 8.59 | 40.13 / 3.99 | 2 |
| 629 / 13.5, 52.5 | 83.52% | 36.40 / 3.96 | 47.12 / 5.40 | 1 |
| 630 / 14.5, 52.5 | 85.71% | 22.48 / 1.03 | 63.23 / 4.91 | 1 |
| 633 / 17.5, 52.5 | 93.32% | 7.67 / 1.50 | 85.65 / 3.48 | 1 |
| 634 / 18.5, 52.5 | 60.72% | 10.91 / 2.70 | 49.81 / 3.99 | 1 |
| 635 / 19.5, 52.5 | 86.01% | 12.03 / 2.74 | 73.98 / 4.32 | 1 |
| 636 / 20.5, 52.5 | 89.10% | 16.88 / 4.05 | 72.22 / 5.03 | 2 |
| 641 / 25.5, 52.5 | 79.42% | 22.64 / 5.18 | 56.78 / 4.02 | 1 |
| 656 / -9.5, 53.5 | 91.25% | 6.54 / 3.00 | 84.70 / 16.19 | 1 |
| 658 / -7.5, 53.5 | 60.98% | 2.48 / 1.39 | 58.50 / 12.39 | 1 |
| 659 / -6.5, 53.5 | 88.12% | 2.76 / 4.33 | 85.35 / 5.38 | 1 |
| 662 / -3.5, 53.5 | 36.20% | 0.43 / 0.13 | 35.78 / 1.97 | 2 |
| 663 / -2.5, 53.5 | 49.22% | 0.98 / 0.41 | 48.24 / 9.70 | 1 |
| 665 / -0.5, 53.5 | 83.62% | 0.27 / 0.12 | 83.35 / 8.21 | 1 |
| 666 / 0.5, 53.5 | —% | — / — | — / — | Missing |
| 674 / 8.5, 53.5 | 22.23% | 1.32 / 0.51 | 20.90 / 5.95 | 1 |
| 676 / 10.5, 53.5 | 92.28% | 1.96 / 0.46 | 90.32 / 5.44 | 1 |
| 677 / 11.5, 53.5 | 95.87% | 2.12 / 1.12 | 93.74 / 5.39 | 1 |
| 678 / 12.5, 53.5 | 85.04% | 12.04 / 4.74 | 73.01 / 12.54 | 1 |
| 679 / 13.5, 53.5 | 87.77% | 7.44 / 1.91 | 80.33 / 5.41 | 1 |
| 680 / 14.5, 53.5 | 58.56% | 8.55 / 2.57 | 50.01 / 12.95 | 1 |
| 681 / 15.5, 53.5 | 76.34% | 18.24 / 4.55 | 58.11 / 4.79 | 2 |
| 683 / 17.5, 53.5 | 82.15% | 15.17 / 3.79 | 66.97 / 5.81 | 1 |
| 684 / 18.5, 53.5 | 85.45% | 24.63 / 1.41 | 60.82 / 5.23 | 1 |
| 685 / 19.5, 53.5 | 87.85% | 27.71 / 6.89 | 60.13 / 5.37 | 1 |
| 686 / 20.5, 53.5 | 88.76% | 8.44 / 0.16 | 80.32 / 3.75 | 1 |
| 687 / 21.5, 53.5 | 86.08% | 19.29 / 4.50 | 66.79 / 4.43 | 1 |
| 690 / 24.5, 53.5 | 78.74% | 42.17 / 7.35 | 36.57 / 3.09 | 1 |
| 706 / -9.5, 54.5 | 55.81% | 6.86 / 2.05 | 48.95 / 11.74 | 1 |
| 707 / -8.5, 54.5 | —% | — / — | — / — | Missing |
| 709 / -6.5, 54.5 | 82.64% | 7.35 / 1.70 | 75.30 / 3.42 | 1 |
| 710 / -5.5, 54.5 | 78.63% | 7.10 / 5.61 | 71.54 / 10.31 | 1 |
| 713 / -2.5, 54.5 | 58.85% | 0.57 / 0.16 | 58.27 / 9.85 | 1 |
| 714 / -1.5, 54.5 | 44.62% | 0.38 / 0.08 | 44.24 / 6.93 | 1 |
| 715 / -0.5, 54.5 | —% | — / — | — / — | Missing |
| 724 / 8.5, 54.5 | 71.22% | 1.64 / 0.41 | 69.58 / 4.07 | 2 |
| 725 / 9.5, 54.5 | 33.89% | 3.74 / 4.27 | 30.16 / 11.17 | 1 |
| 726 / 10.5, 54.5 | 82.21% | 1.05 / 0.47 | 81.16 / 10.29 | 1 |
| 727 / 11.5, 54.5 | —% | — / — | — / — | Missing |
| 728 / 12.5, 54.5 | 77.79% | 4.76 / 2.12 | 73.03 / 9.79 | 1 |
| 729 / 13.5, 54.5 | 76.41% | 1.81 / 0.45 | 74.60 / 4.57 | 2 |
| 732 / 16.5, 54.5 | 47.21% | 10.20 / 2.48 | 37.01 / 4.94 | 2 |
| 733 / 17.5, 54.5 | 29.34% | 15.55 / 4.37 | 13.79 / 0.98 | 2 |
| 734 / 18.5, 54.5 | 42.87% | 12.48 / 0.85 | 30.39 / 4.00 | 1 |
| 735 / 19.5, 54.5 | 57.51% | 7.95 / 1.75 | 49.55 / 3.08 | 1 |
| 738 / 22.5, 54.5 | 90.53% | 18.09 / 4.86 | 72.45 / 8.88 | 2 |
| 739 / 23.5, 54.5 | 90.49% | 0.31 / 0.16 | 90.19 / 8.91 | 2 |
| 740 / 24.5, 54.5 | 76.46% | 20.78 / 16.87 | 55.68 / 14.06 | 1 |
| 741 / 25.5, 54.5 | 73.96% | 0.15 / 0.15 | 73.81 / 8.54 | 2 |
| 745 / 29.5, 54.5 | 91.20% | 25.11 / 5.22 | 66.09 / 5.90 | 2 |
| 759 / -6.5, 55.5 | 63.82% | 3.00 / 0.79 | 60.82 / 3.94 | 1 |
| 761 / -4.5, 55.5 | 36.80% | 4.17 / 3.04 | 32.63 / 9.61 | 1 |
| 762 / -3.5, 55.5 | 57.50% | 0.38 / 0.14 | 57.12 / 3.90 | 2 |
| 774 / 8.5, 55.5 | —% | — / — | — / — | Missing |
| 775 / 9.5, 55.5 | —% | — / — | — / — | Missing |
| 776 / 10.5, 55.5 | 94.37% | 0.75 / 0.11 | 93.62 / 4.56 | 1 |
| 777 / 11.5, 55.5 | 95.02% | 1.62 / 1.08 | 93.40 / 5.63 | 2 |
| 778 / 12.5, 55.5 | 86.43% | 1.21 / 0.22 | 85.22 / 6.65 | 1 |
| 779 / 13.5, 55.5 | 54.07% | 3.00 / 1.61 | 51.08 / 15.78 | 1 |
| 786 / 20.5, 55.5 | 68.60% | 19.97 / 3.66 | 48.63 / 4.89 | 1 |
| 787 / 21.5, 55.5 | 54.77% | 22.59 / 9.52 | 32.18 / 7.92 | 1 |
| 788 / 22.5, 55.5 | 92.60% | 17.06 / 2.25 | 75.54 / 4.60 | 2 |
| 791 / 25.5, 55.5 | 97.30% | 41.36 / 12.81 | 55.94 / 8.01 | 1 |
| 792 / 26.5, 55.5 | —% | — / — | — / — | Missing |
| 794 / 28.5, 55.5 | 98.35% | 22.66 / 3.47 | 75.70 / 5.17 | 1 |
| 797 / 31.5, 55.5 | 88.68% | 46.94 / 6.73 | 41.73 / 6.75 | 2 |
| 808 / -7.5, 56.5 | 4.13% | 0.48 / 0.32 | 3.65 / 1.03 | 2 |
| 809 / -6.5, 56.5 | 74.56% | 0.34 / 0.11 | 74.22 / 8.77 | 2 |
| 810 / -5.5, 56.5 | 64.48% | 1.13 / 0.23 | 63.35 / 9.71 | 1 |
| 811 / -4.5, 56.5 | 89.74% | 1.29 / 0.56 | 88.44 / 8.65 | 1 |
| 812 / -3.5, 56.5 | 68.03% | 5.91 / 5.35 | 62.12 / 7.96 | 1 |
| 813 / -2.5, 56.5 | 84.89% | 0.29 / 0.30 | 84.60 / 14.14 | 1 |
| 824 / 8.5, 56.5 | 54.38% | 1.61 / 0.13 | 52.77 / 5.16 | 1 |
| 825 / 9.5, 56.5 | 76.58% | 1.15 / 0.10 | 75.43 / 4.75 | 1 |
| 826 / 10.5, 56.5 | —% | — / — | — / — | Missing |
| 828 / 12.5, 56.5 | 74.14% | 2.66 / 0.32 | 71.48 / 17.02 | 1 |
| 829 / 13.5, 56.5 | 83.72% | 7.47 / 3.30 | 76.25 / 12.77 | 1 |
| 830 / 14.5, 56.5 | 95.55% | 5.67 / 3.15 | 89.88 / 11.75 | 1 |
| 831 / 15.5, 56.5 | 83.12% | 19.11 / 1.85 | 64.01 / 7.82 | 1 |
| 832 / 16.5, 56.5 | 44.81% | 14.57 / 2.88 | 30.24 / 5.72 | 1 |
| 837 / 21.5, 56.5 | 80.09% | 37.99 / 21.75 | 42.10 / 19.46 | 1 |
| 838 / 22.5, 56.5 | 93.79% | 39.05 / 5.88 | 54.73 / 6.16 | 2 |
| 842 / 26.5, 56.5 | 75.05% | 52.25 / 5.49 | 22.80 / 1.98 | 2 |
| 843 / 27.5, 56.5 | 89.09% | 19.61 / 2.66 | 69.48 / 5.29 | 1 |
| 844 / 28.5, 56.5 | 95.03% | 14.96 / 2.40 | 80.07 / 6.88 | 2 |
| 858 / -7.5, 57.5 | 17.49% | 1.33 / 0.26 | 16.16 / 4.28 | 1 |
| 859 / -6.5, 57.5 | 67.32% | 1.54 / 0.53 | 65.78 / 7.36 | 2 |
| 860 / -5.5, 57.5 | 48.33% | 4.99 / 1.27 | 43.35 / 8.52 | 1 |
| 861 / -4.5, 57.5 | 32.31% | 9.65 / 0.50 | 22.66 / 13.96 | 1 |
| 862 / -3.5, 57.5 | —% | — / — | — / — | Missing |
| 863 / -2.5, 57.5 | 77.83% | 8.37 / 2.41 | 69.46 / 16.57 | 1 |
| 864 / -1.5, 57.5 | 82.67% | 1.13 / 0.89 | 81.54 / 18.95 | 2 |
| 874 / 8.5, 57.5 | —% | — / — | — / — | Missing |
| 876 / 10.5, 57.5 | —% | — / — | — / — | Missing |
| 878 / 12.5, 57.5 | 21.58% | 1.69 / 2.07 | 19.88 / 14.21 | 1 |
| 880 / 14.5, 57.5 | 67.31% | 12.05 / 2.61 | 55.25 / 10.96 | 1 |
| 882 / 16.5, 57.5 | 64.99% | 34.50 / 2.77 | 30.49 / 3.10 | 1 |
| 887 / 21.5, 57.5 | 100.00% | 30.32 / 7.78 | 69.68 / 7.15 | 2 |
| 890 / 24.5, 57.5 | 92.99% | 41.16 / 15.90 | 51.82 / 8.51 | 1 |
| 891 / 25.5, 57.5 | 75.63% | 37.41 / 8.93 | 38.22 / 12.22 | 1 |
| 892 / 26.5, 57.5 | 87.71% | 14.32 / 1.58 | 73.40 / 4.75 | 2 |
| 893 / 27.5, 57.5 | 97.10% | 31.50 / 3.28 | 65.60 / 3.42 | 1 |
| 896 / 30.5, 57.5 | 83.11% | 16.73 / 4.80 | 66.39 / 7.42 | 1 |
| 897 / 31.5, 57.5 | 67.50% | 31.10 / 4.54 | 36.40 / 5.00 | 2 |
| 909 / -6.5, 58.5 | 24.42% | 1.60 / 0.23 | 22.82 / 5.58 | 1 |
| 910 / -5.5, 58.5 | 78.63% | 9.87 / 12.76 | 68.76 / 17.33 | 1 |
| 911 / -4.5, 58.5 | 34.70% | 3.40 / 0.60 | 31.30 / 12.14 | 1 |
| 912 / -3.5, 58.5 | 11.39% | 2.55 / 0.89 | 8.84 / 1.72 | 1 |
| 913 / -2.5, 58.5 | 11.83% | 1.79 / 0.56 | 10.03 / 1.21 | 2 |
| 923 / 7.5, 58.5 | 79.78% | 12.49 / 1.16 | 67.29 / 2.21 | 1 |
| 927 / 11.5, 58.5 | 93.41% | 13.41 / 3.68 | 80.00 / 9.85 | 2 |
| 929 / 13.5, 58.5 | 85.63% | 15.75 / 3.90 | 69.88 / 6.82 | 2 |
| 932 / 16.5, 58.5 | 95.74% | 36.52 / 9.24 | 59.22 / 6.48 | 2 |
| 938 / 22.5, 58.5 | 69.02% | 24.39 / 4.08 | 44.63 / 6.99 | 1 |
| 939 / 23.5, 58.5 | 94.00% | 31.60 / 4.84 | 62.40 / 6.81 | 1 |
| 941 / 25.5, 58.5 | 73.83% | 35.20 / 4.72 | 38.63 / 5.49 | 1 |
| 942 / 26.5, 58.5 | 95.54% | 7.94 / 0.53 | 87.60 / 6.70 | 1 |
| 943 / 27.5, 58.5 | 89.49% | 20.62 / 3.15 | 68.86 / 5.27 | 1 |
| 946 / 30.5, 58.5 | 98.38% | 55.73 / 6.84 | 42.64 / 3.84 | 2 |
| 947 / 31.5, 58.5 | —% | — / — | — / — | Missing |
| 971 / 5.5, 59.5 | 72.30% | 14.72 / 2.91 | 57.58 / 6.73 | 1 |
| 972 / 6.5, 59.5 | 22.91% | 5.86 / 3.94 | 17.05 / 4.83 | 1 |
| 973 / 7.5, 59.5 | 58.70% | 31.16 / 8.02 | 27.54 / 2.99 | 1 |
| 977 / 11.5, 59.5 | 75.91% | 21.12 / 5.49 | 54.79 / 6.84 | 2 |
| 980 / 14.5, 59.5 | 94.89% | 21.41 / 2.71 | 73.48 / 2.44 | 1 |
| 988 / 22.5, 59.5 | 97.68% | 69.57 / 11.28 | 28.12 / 5.27 | 2 |
| 990 / 24.5, 59.5 | 42.60% | 10.29 / 9.81 | 32.31 / 19.52 | 1 |
| 991 / 25.5, 59.5 | 87.37% | 11.94 / 1.88 | 75.43 / 5.19 | 1 |
| 992 / 26.5, 59.5 | 93.16% | 16.75 / 5.18 | 76.41 / 6.04 | 1 |
| 993 / 27.5, 59.5 | 90.94% | 20.64 / 4.43 | 70.30 / 5.50 | 1 |
| 1013 / -2.5, 60.5 | —% | — / — | — / — | Missing |
| 1014 / -1.5, 60.5 | 30.24% | 2.15 / 0.83 | 28.09 / 5.66 | 1 |
| 1021 / 5.5, 60.5 | 76.67% | 18.15 / 4.19 | 58.52 / 6.72 | 2 |
| 1022 / 6.5, 60.5 | 50.19% | 12.60 / 2.81 | 37.59 / 7.57 | 2 |
| 1026 / 10.5, 60.5 | 94.45% | 13.98 / 3.33 | 80.47 / 11.33 | 2 |
| 1030 / 14.5, 60.5 | 67.01% | 34.95 / 2.15 | 32.06 / 9.20 | 1 |
| 1031 / 15.5, 60.5 | 91.74% | 30.03 / 7.88 | 61.72 / 10.42 | 2 |
| 1036 / 20.5, 60.5 | —% | — / — | — / — | Missing |
| 1037 / 21.5, 60.5 | —% | — / — | — / — | Missing |
| 1038 / 22.5, 60.5 | —% | — / — | — / — | Missing |
| 1039 / 23.5, 60.5 | 91.74% | 40.04 / 9.46 | 51.69 / 8.27 | 1 |
| 1040 / 24.5, 60.5 | 85.02% | 24.71 / 7.62 | 60.31 / 12.80 | 2 |
| 1045 / 29.5, 60.5 | 89.86% | 54.54 / 9.83 | 35.32 / 9.45 | 2 |
| 1074 / 8.5, 61.5 | 56.90% | 31.10 / 6.42 | 25.80 / 6.18 | 2 |
| 1075 / 9.5, 61.5 | 79.50% | 38.05 / 8.44 | 41.45 / 9.82 | 2 |
| 1076 / 10.5, 61.5 | 87.02% | 23.09 / 6.96 | 63.93 / 5.09 | 1 |
| 1079 / 13.5, 61.5 | 56.37% | 29.06 / 8.10 | 27.32 / 7.53 | 2 |
| 1082 / 16.5, 61.5 | 95.17% | 21.61 / 5.95 | 73.56 / 13.97 | 2 |
| 1087 / 21.5, 61.5 | —% | — / — | — / — | Missing |
| 1088 / 22.5, 61.5 | —% | — / — | — / — | Missing |
| 1090 / 24.5, 61.5 | 94.25% | 29.06 / 7.48 | 65.19 / 14.23 | 2 |
| 1091 / 25.5, 61.5 | 92.94% | 28.03 / 2.85 | 64.92 / 3.33 | 1 |
| 1092 / 26.5, 61.5 | 92.87% | 33.39 / 5.28 | 59.48 / 11.80 | 2 |
| 1093 / 27.5, 61.5 | 94.30% | 24.88 / 4.73 | 69.42 / 15.18 | 2 |
| 1094 / 28.5, 61.5 | 84.15% | 30.07 / 7.98 | 54.07 / 12.29 | 2 |
| 1095 / 29.5, 61.5 | 81.60% | 44.53 / 7.63 | 37.07 / 7.81 | 1 |
| 1120 / 4.5, 62.5 | 48.63% | 9.55 / 1.41 | 39.09 / 5.32 | 2 |
| 1125 / 9.5, 62.5 | 65.32% | 38.36 / 5.07 | 26.96 / 6.45 | 2 |
| 1126 / 10.5, 62.5 | 35.87% | 18.25 / 4.08 | 17.62 / 3.88 | 2 |
| 1128 / 12.5, 62.5 | —% | — / — | — / — | Missing |
| 1138 / 22.5, 62.5 | 64.87% | 13.12 / 3.64 | 51.75 / 12.75 | 2 |
| 1174 / 8.5, 63.5 | 80.63% | 24.99 / 1.72 | 55.63 / 2.51 | 1 |
| 1175 / 9.5, 63.5 | 64.15% | 13.39 / 3.22 | 50.76 / 8.21 | 2 |
| 1178 / 12.5, 63.5 | 60.00% | 24.95 / 10.55 | 35.05 / 1.95 | 1 |
| 1180 / 14.5, 63.5 | 96.33% | 35.51 / 10.00 | 60.82 / 15.34 | 2 |
| 1186 / 20.5, 63.5 | 80.58% | 20.07 / 5.24 | 60.51 / 11.54 | 2 |
| 1195 / 29.5, 63.5 | —% | — / — | — / — | Missing |
| 1227 / 11.5, 64.5 | 77.34% | 30.20 / 7.69 | 47.15 / 8.67 | 2 |
| 1235 / 19.5, 64.5 | 89.34% | 17.94 / 4.99 | 71.40 / 19.30 | 2 |
| 1243 / 27.5, 64.5 | 74.01% | 36.05 / 9.47 | 37.96 / 11.52 | 2 |
| 1285 / 19.5, 65.5 | 66.42% | 37.99 / 10.48 | 28.43 / 7.73 | 2 |
| 1295 / 29.5, 65.5 | 37.89% | 18.46 / 4.98 | 19.42 / 5.31 | 2 |
| 1330 / 14.5, 66.5 | 50.56% | 13.41 / 3.42 | 37.15 / 9.24 | 2 |
| 1336 / 20.5, 66.5 | —% | — / — | — / — | Missing |
| 1344 / 28.5, 66.5 | 85.72% | 39.24 / 9.98 | 46.48 / 14.06 | 2 |
| 1386 / 20.5, 67.5 | 77.62% | 46.10 / 10.74 | 31.52 / 9.87 | 2 |
| 1387 / 21.5, 67.5 | 60.25% | 45.75 / 12.01 | 14.51 / 4.31 | 2 |
| 1430 / 14.5, 68.5 | 70.02% | 7.84 / 2.03 | 62.18 / 21.11 | 2 |
| 1432 / 16.5, 68.5 | 76.83% | 12.79 / 3.10 | 64.04 / 21.36 | 2 |
| 1433 / 17.5, 68.5 | 75.17% | 15.55 / 1.02 | 59.63 / 2.45 | 1 |
| 1434 / 18.5, 68.5 | 91.82% | 55.25 / 8.28 | 36.57 / 2.61 | 1 |
| 1435 / 19.5, 68.5 | 87.60% | 44.30 / 11.72 | 43.30 / 14.07 | 1 |
| 1436 / 20.5, 68.5 | 80.01% | 35.26 / 8.63 | 44.75 / 14.60 | 2 |
| 1438 / 22.5, 68.5 | 85.47% | 57.42 / 14.73 | 28.05 / 8.84 | 2 |
| 1442 / 26.5, 68.5 | 23.58% | 22.82 / 6.45 | 0.76 / 0.33 | Missing |
| 1485 / 19.5, 69.5 | 54.60% | 16.08 / 3.56 | 38.52 / 9.82 | 2 |
| 1486 / 20.5, 69.5 | 78.06% | 45.27 / 4.48 | 32.80 / 3.70 | 1 |
| 1487 / 21.5, 69.5 | 79.75% | 61.33 / 15.78 | 18.42 / 5.92 | 1 |
| 1489 / 23.5, 69.5 | 83.43% | 47.44 / 12.15 | 36.00 / 11.45 | 2 |
| 1493 / 27.5, 69.5 | 89.56% | 55.29 / 15.80 | 34.27 / 11.06 | 2 |
| 1494 / 28.5, 69.5 | 90.12% | 58.59 / 16.64 | 31.53 / 9.98 | 2 |
| 1543 / 27.5, 70.5 | 47.53% | 24.40 / 4.85 | 23.12 / 4.17 | 1 |
| 1544 / 28.5, 70.5 | 71.72% | 41.57 / 10.95 | 30.14 / 8.40 | 1 |
| 1547 / 31.5, 70.5 | 68.76% | 37.15 / 7.87 | 31.60 / 9.33 | 2 |
| 2035 / 24.5, 35.5 | —% | — / — | — / — | Missing |
| 2047 / 36.5, 35.5 | 3.91% | 1.20 / 0.61 | 2.71 / 1.00 | 2 |
| 2069 / -2.5, 36.5 | 73.68% | 53.39 / 6.94 | 20.29 / 2.09 | 2 |
| 2100 / 28.5, 36.5 | —% | — / — | — / — | Missing |
| 2101 / 29.5, 36.5 | 27.56% | 25.79 / 4.74 | 1.76 / 0.90 | 1 |
| 2130 / -2.5, 37.5 | 48.86% | 36.07 / 8.44 | 12.78 / 1.77 | 2 |
| 2131 / -1.5, 37.5 | 26.39% | 26.39 / 13.64 | 0.00 / 0.00 | 2 |
| 2145 / 12.5, 37.5 | 62.31% | 59.59 / 12.26 | 2.72 / 0.62 | 1 |
| 2155 / 22.5, 37.5 | 24.65% | 11.61 / 11.64 | 13.04 / 1.90 | 1 |
| 2156 / 23.5, 37.5 | —% | — / — | — / — | Missing |
| 2162 / 29.5, 37.5 | 21.07% | 20.32 / 7.51 | 0.74 / 0.40 | 1 |
| 2163 / 30.5, 37.5 | —% | — / — | — / — | Missing |
| 2164 / 31.5, 37.5 | 60.61% | 59.25 / 25.72 | 1.36 / 0.80 | 1 |
| 2166 / 33.5, 37.5 | 48.21% | 48.16 / 40.58 | 0.05 / 0.10 | 1 |
| 2191 / -2.5, 38.5 | 54.35% | 30.34 / 10.70 | 24.01 / 3.68 | 1 |
| 2193 / -0.5, 38.5 | 48.72% | 46.06 / 32.04 | 2.66 / 1.13 | 1 |
| 2195 / 1.5, 38.5 | 37.40% | 31.44 / 6.56 | 5.95 / 2.32 | 2 |
| 2214 / 20.5, 38.5 | —% | — / — | — / — | Missing |
| 2215 / 21.5, 38.5 | 53.75% | 50.79 / 41.57 | 2.96 / 1.53 | 1 |
| 2216 / 22.5, 38.5 | —% | — / — | — / — | Missing |
| 2224 / 30.5, 38.5 | 69.66% | 66.20 / 82.84 | 3.47 / 2.29 | 2 |
| 2228 / 34.5, 38.5 | —% | — / — | — / — | Missing |
| 2250 / -4.5, 39.5 | —% | — / — | — / — | Missing |
| 2253 / -1.5, 39.5 | —% | — / — | — / — | Missing |
| 2254 / -0.5, 39.5 | 30.47% | 19.42 / 3.11 | 11.05 / 2.79 | 1 |
| 2258 / 3.5, 39.5 | 59.94% | 49.88 / 12.20 | 10.06 / 4.77 | 1 |
| 2259 / 4.5, 39.5 | 69.48% | 59.73 / 9.08 | 9.76 / 2.86 | 1 |
| 2271 / 16.5, 39.5 | —% | — / — | — / — | Missing |
| 2275 / 20.5, 39.5 | 71.74% | 44.48 / 19.53 | 27.26 / 14.24 | 1 |
| 2276 / 21.5, 39.5 | 90.84% | 87.32 / 172.89 | 3.53 / 4.39 | 2 |
| 2277 / 22.5, 39.5 | 65.95% | 42.69 / 4.96 | 23.26 / 10.59 | 1 |
| 2278 / 23.5, 39.5 | —% | — / — | — / — | Missing |
| 2306 / 36.5, 40.5 | 48.92% | 42.04 / 20.01 | 6.88 / 3.82 | 1 |
| 2321 / 36.5, 41.5 | 15.12% | 14.26 / 19.13 | 0.87 / 0.44 | 2 |
| 2442 / 37.5, 49.5 | —% | — / — | — / — | Missing |
| 2470 / 35.5, 51.5 | 19.73% | 0.69 / 0.37 | 19.04 / 3.19 | Missing |
| 2807 / 36.5, 69.5 | 92.11% | 61.02 / 15.26 | 31.09 / 10.07 | 2 |
Sediments retain a record that a modern inventory cannot recover. The REVEALS model translates pollen into estimates of vegetation cover, correcting for differences in pollen production and dispersal. Its European reconstruction draws on 1,128 pollen records. Here, six selected windows show reconstructed woody cover in one-degree cells. Pale gaps mean missing evidence, not a treeless landscape.
Some cells draw on a large lake or several sites; others rely on one small lake or bog. Changing evidence coverage matters as much as changing color. The displayed windows begin around six thousand years before 1950, within the larger reconstruction’s 11,700-year coverage. They do not form a continuous annual census. The recent window is nominally 1850–1950 CE in the supplied labels, while the paper describes its upper boundary as the coring year; neither makes it a map of 2024.
Woody cover combines the reconstruction’s evergreen and summer-green components, including its constituent woody taxa. It is not a national forest-land definition. Component standard errors are retained separately because their covariance is unavailable. A precise-looking uncertainty interval for the sum would conceal an assumption that the source does not support. The historical map is useful precisely when its changing coverage and different truth status remain visible.
Sources: Githumbi et al. (2022): European pollen-based REVEALS reconstruction; LandClimII / REVEALS data and quality flags; Muigg & Tegel (2021): Forest History—New Perspectives for an Old Discipline
The inventory / land and canopy
More forest land can coexist with a more disturbed forest.
The corrected State of Europe’s Forests 2025 report records 232.353 million hectares of forest in its European reporting region, compared with 209.085 million in 1990. Within the EU-27, forest area rose from 145.853 million to 161.840 million hectares. Those are meaningful gains. They do not tell us how reliably the trees on that land are growing, storing carbon or surviving the next disturbance.
Forest land increased. Condition is another question.
Million hectares of forest land / five reporting dates
EU-27
161.8 million ha145.9 in 1990Europe reporting region
232.4 million ha209.1 in 1990Exact values and source limits
| Reporting region | 1990 | 2000 | 2010 | 2020 | 2025 |
|---|---|---|---|---|---|
| EU-27 | 145.853 | 152.203 | 156.674 | 160.801 | 161.840 |
| Europe reporting region | 209.085 | 216.868 | 223.478 | 230.156 | 232.353 |
Source: FOREST EUROPE, State of Europe’s Forests 2025, corrected May 2026, Table 1.1-3, p.41
The clocks therefore stay separate. The historical map reconstructs vegetation cover. The modern area chart reports forest hectares at five reporting dates. The satellite analysis measures annual disturbed hectares as a share of mapped forest. Joining them into one smooth curve would create a continuity that the evidence does not supply.
Sources: State of Europe’s Forests 2025, corrected May 2026, Table 1.1-3; FAO forest definitions: temporarily unstocked land expected to regenerate
The trunk / a productive resource
A forest is also an economy with a long memory.
In 1713, Hans Carl von Carlowitz published Sylvicultura oeconomica. Its title connects growing trees with households, building, brewing, mining and smelting. The problem was already economic: how can a society use a productive resource without consuming its future supply? Today, the investment horizon has an additional complication. A stand may mature under a climate materially different from the one in which it was established.
Eurostat counted 3.6 million people across forestry and wood-based industries in the EU in 2022. That broad total includes paper, wood products and furniture; forestry and logging itself accounted for about 540,000 employed and self-employed people. EU roundwood production reached 460 million cubic meters in 2023. Disturbance can travel from forest owners to sawmills, transport, construction and local labor markets.
Salvage logging can temporarily increase the supply of wood after trees have been damaged, even as the productive base becomes less dependable. A rise in removals can reflect planned harvesting, commercial demand or the response to a disaster. A timber statistic alone cannot distinguish those mechanisms.
The timing matters for value. An owner may receive money from salvage now but lose the option to sell mature timber later, while facing re-establishment costs before the next harvest. Processors may see plentiful raw material during the salvage phase and less dependable supply afterward. That mechanism is economic interpretation, not a loss estimate derived from these pixels. Measuring it would require prices, wood quality, costs, stand age and the intended management path.
A policy that counts hectares therefore needs a companion account of condition. The same land area can contain mature stands, young regeneration, recently harvested patches and damaged trees awaiting removal. The satellite record adds a history of canopy disturbance, while inventories and field observations are needed to establish whether recovery is restoring the functions that matter. Neither source can perform the other’s entire job.
Agriculture and settlement transformed woodland mosaics.
Households, metalworking and manufacturing competed for wood.
Long-lived stands connected present removals to future production.
Condition, regeneration and the next disturbance now enter the same account.
Sources: Hans Carl von Carlowitz, Sylvicultura oeconomica (1713), digitized original; Eurostat: forestry and wood-based employment, 2022; Eurostat: forests, forestry and logging; roundwood production; Joint Research Centre: forest ecosystem services; Muigg & Tegel (2021): Forest History—New Perspectives for an Old Discipline
The satellite record / 1985–2024
A recent year needs an older comparison.
Across the six countries, EFDA v3 maps 414,659 disturbed hectares in 2024, or 0.65% of their combined mapped forest. This is an area-weighted six-country aggregate, not a European total. 0 of the six countries place 2024 at or above the 90th percentile of their own 1985–2023 histories. Country-specific histories matter more than a shared label such as “exceptional.”
Czechia makes the distinction clear. Its 2024 disturbed share is 0.72%, at the 48.7th percentile of the earlier distribution. Yet mean annual disturbance in 2018–2024 is 2.44 times the 1985–2017 average. A return toward the historical middle in the latest year does not erase the recent sequence of disturbance.
Spain provides a useful contrast. Its 2024 disturbed share is 0.57%, at the 17.9th historical percentile. Its 2018–2024 average is 0.83 times the 1985–2017 average. Moving the baseline start to 1995 changes that ratio to 1.00. France’s corresponding ratios are 1.06 and 1.02. A claim about improvement or deterioration needs to name the history against which it is made.
The 2024 percentile always compares the latest year with the 39 earlier years, using a midrank for ties. It answers a different question from the post-2018 period mean. These are descriptive ranks of mapped estimates, without confidence intervals for detection error. A long sequence of elevated estimates deserves investigation even when its final observation is unremarkable.
Sources: European Forest Disturbance Atlas v3.0.0, 13 September 2026
The near view / a landscape of contrasts
National averages conceal the shape of disturbance.
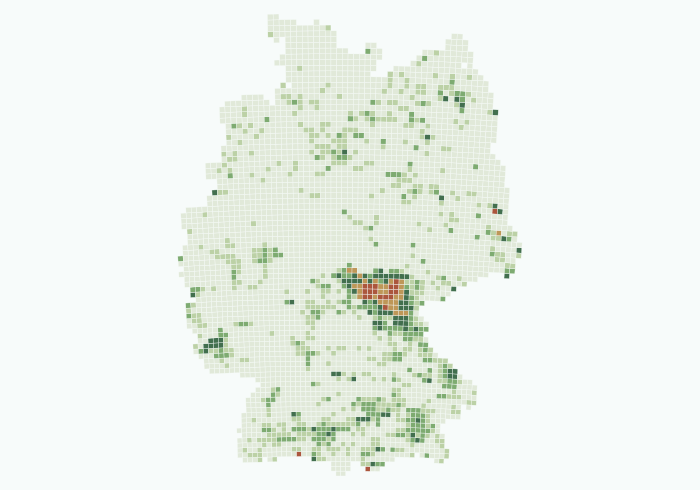
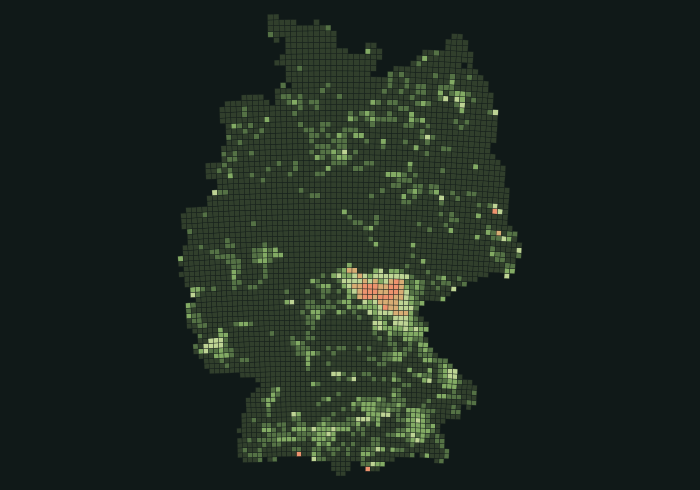
The 2024 map aggregates every mapped forest pixel into a ten-kilometer equal-area grid. Each cell’s color represents disturbed forest divided by mapped forest within that cell. It does not divide by national land area, nor does a larger country automatically receive a darker color. The national rate is the result of adding those numerators and denominators, not averaging the colored cell percentages.
Germany: the shape behind the average.
2024 disturbed forest / mapped forest within each 10 km source cell, percent
2024 national totals and mapped forest denominators
| Country | Disturbed ha | Mapped forest ha | Share |
|---|---|---|---|
| Germany | 85,103.82 | 12,231,690.12 | 0.6958% |
| Austria | 39,936.60 | 4,498,211.34 | 0.8878% |
| Czechia | 23,602.05 | 3,272,015.25 | 0.7213% |
| Poland | 98,237.43 | 11,148,582.42 | 0.8812% |
| France | 83,312.37 | 17,709,519.78 | 0.4704% |
| Spain | 84,466.26 | 14,908,557.69 | 0.5666% |
Source: European Forest Disturbance Atlas v3.0.0; equal-area native-pixel aggregation
The official-area check uses Eurostat forest closing stocks for 2023. An administrative inventory and a satellite forest mask need not have identical definitions or boundaries. France’s comparator is metropolitan France, including Corsica. Spain’s EFDA raster excludes the Canary Islands, while the official national total includes them: this is a qualified geographic scale check. Spain’s official value is imputed and France’s is estimated and provisional. A fixed comparator changes levels, but cannot change a country’s year rankings or post/pre ratio.
Sources: European Forest Disturbance Atlas v3.0.0, 13 September 2026; Eurostat for_area_efa: forest closing stock, 2023, thousand hectares
The mechanism / classification before interpretation
A disturbed pixel does not explain its own cause.
EFDA assigns detected disturbance to fire, harvest, or a combined wind and bark-beetle class. The last category cannot be split into separate wind and insect estimates from this product. The bars retain unclassified disturbance where the source lacks an agent, so their denominator remains all detected disturbed area.
Harvesting is part of this record. That is useful when the question concerns canopy change, but makes “natural disaster area” an incorrect label. Salvage logging links management to preceding damage: a sequence can involve drought, insect attack and removal, while the classification presents a finite set of agent categories.
What the map classifies in 2024.
Percent of all detected disturbed hectares / 2024
Classified agent hectares and shares
| Country | Wind / bark beetle | Fire | Harvest | Unclassified |
|---|---|---|---|---|
| Germany | 46,819.62 ha / 55.01% | 12.96 ha / 0.02% | 38,271.24 ha / 44.97% | 0.00 ha / 0.00% |
| Austria | 16,046.10 ha / 40.18% | 0.00 ha / 0.00% | 23,890.50 ha / 59.82% | 0.00 ha / 0.00% |
| Czechia | 6,374.52 ha / 27.01% | 0.00 ha / 0.00% | 17,227.53 ha / 72.99% | 0.00 ha / 0.00% |
| Poland | 15,677.82 ha / 15.96% | 211.05 ha / 0.21% | 82,348.56 ha / 83.83% | 0.00 ha / 0.00% |
| France | 25,967.16 ha / 31.17% | 3,465.18 ha / 4.16% | 53,880.03 ha / 64.67% | 0.00 ha / 0.00% |
| Spain | 1,432.89 ha / 1.70% | 22,501.62 ha / 26.64% | 60,531.75 ha / 71.66% | 0.00 ha / 0.00% |
Source: European Forest Disturbance Atlas v3.0.0; native 30 m raster calculations
Changes in the agent mix describe what the map is seeing. They do not identify a causal coefficient for drought or management. Weather, species, age, soils, earlier damage and harvesting decisions can move together. A plausible mechanism earns further investigation; it does not become a finding merely because the colors fit it.
Sources: European Forest Disturbance Atlas v3.0.0, 13 September 2026; Viana-Soto & Senf (2025): forest mask and agent attribution; earlier detector
Return visits / the repeated footprint
Some forest pixels enter the record more than once.
The horizontal coordinate is the share of mapped forest disturbed at least once from 1985 to 2024. The vertical coordinate is the share disturbed more than once, using EFDA’s distinct-event count. Both use the same mapped-forest denominator and forty-year window. Repeated area is a subset of ever-disturbed area, so a positive relationship is partly mathematical; it cannot establish a mechanism.
A repeated footprint is evidence of recurrence within the observed window. It is insufficient evidence that a forest failed to recover. The interval between events, their severity, their agents and the regeneration between them matter. Two harvests decades apart do not by themselves demonstrate chronic ecological stress.
Some pixels enter the record more than once.
Percent of mapped forest / complete 1985-2024 window
Repeatedly disturbed / mapped forest (%)
Ever disturbed / mapped forest (%)
Germany: 18.26% disturbed at least once; 2.47% more than once.
Forty-year disturbance footprints
| Country | Ever disturbed | Repeatedly disturbed | Repeated / ever disturbed |
|---|---|---|---|
| Germany | 18.2586% | 2.4685% | 13.5195% |
| Austria | 20.6598% | 3.1529% | 15.2610% |
| Czechia | 25.5564% | 3.5513% | 13.8958% |
| Poland | 21.5953% | 3.3529% | 15.5263% |
| France | 20.0566% | 5.5525% | 27.6839% |
| Spain | 25.0569% | 7.4578% | 29.7635% |
Source: European Forest Disturbance Atlas v3.0.0; native 30 m raster calculations
Looking back to 1985 gives later years more chances to find a previous disturbance. The companion data therefore include a fixed ten-year lookback from 1995 onward. It counts current-year detections with an earlier detection in the preceding decade. This avoids future leakage and equalizes the lookback, while leaving recovery unmeasured.
Sources: European Forest Disturbance Atlas v3.0.0, 13 September 2026
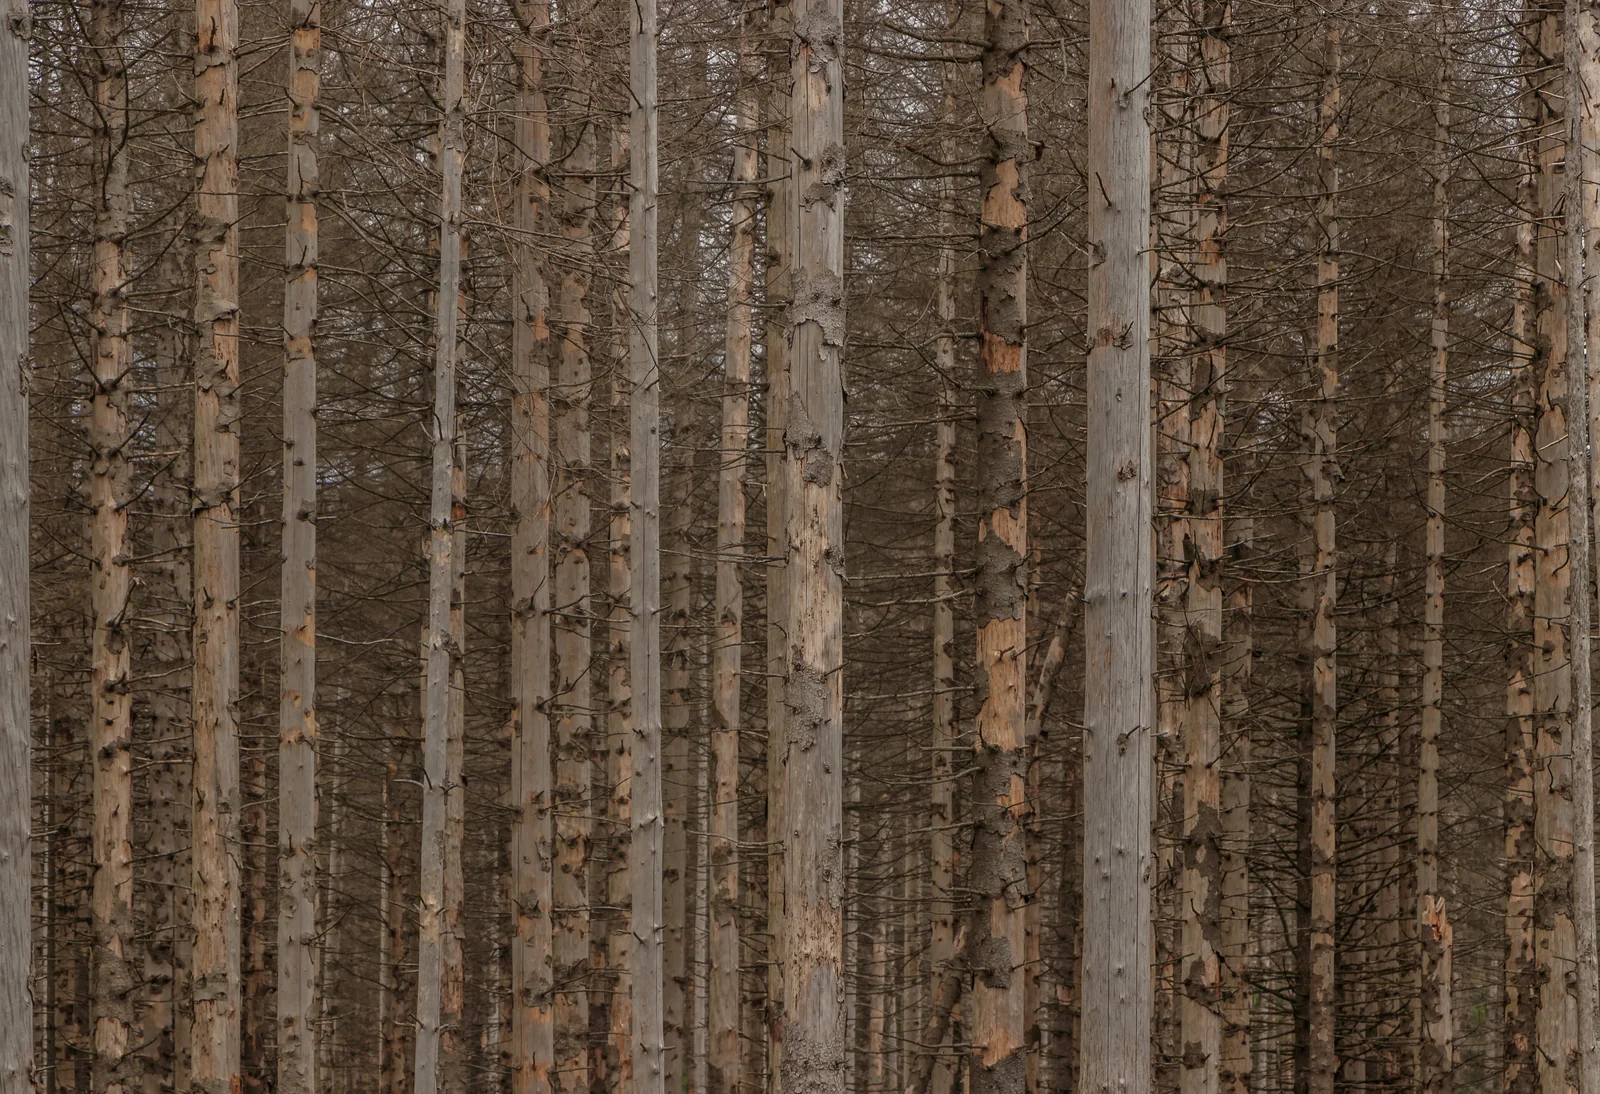
The trees on the ground.Wurmberg, Harz / July 2024. Llez / CC BY-SA 3.0. A different place from the opening image, not a before/after comparison.

After 2018 / the baseline changes the question
An elevated period can outlast its peak year.
Germany’s mean annual mapped disturbance in 2018–2024 is 2.25 times its 1985–2017 average. In 2024 alone, EFDA maps 85,104 disturbed hectares, or 0.70% of its forest mask. That year stands at the 79.5th historical percentile. The peak annual mapped share in the full record occurs in 2020.
With a fixed ten-year lookback, 8.8% of German disturbed hectares in 1995–2017 had also been disturbed in the preceding decade, compared with 10.4% in 2018–2024. These conditional shares must be read alongside the larger change in overall disturbed area. A rise in hectares receiving a repeat event can reflect more disturbance overall, a greater conditional tendency to revisit affected pixels, or both.
Germany after 2018, in historical context.
Mean annual disturbed hectares / mapped forest hectares, percent
A fixed ten-year lookback: 8.8% of disturbed hectares in 1995-2017 had a previous disturbance in that decade, compared with 10.4% in 2018-2024. These are pooled conditional shares, weighted by current disturbed hectares.
Germany period means and lengths
| Period | Years | Mean annual ha | Mean annual share |
|---|---|---|---|
| 1985-1989 | 5 | 45,000.56 | 0.3679% |
| 1990-1999 | 10 | 40,087.36 | 0.3277% |
| 2000-2009 | 10 | 68,366.25 | 0.5589% |
| 2010-2017 | 8 | 58,866.97 | 0.4813% |
| 2018-2024 | 7 | 121,626.80 | 0.9944% |
Source: European Forest Disturbance Atlas v3.0.0; native 30 m raster calculations
The period chart uses means per year because its periods have different lengths. The shorter 1985–1989 and 2010–2017 windows are labeled. The choice of 2018 is motivated by the recent episode, not selected by an estimated change-point model. This describes a break worth investigating; it does not prove a permanent change in the underlying process.
At EU level, the EEA reports that the entire land-use and forestry sector removed a net 198 million tonnes of CO₂-equivalent in 2023. Its average sink in 2014–2023 was 30% smaller than in the preceding decade. This broader account includes land uses beyond forests. Turning disturbance hectares into emissions would require biomass, deadwood, harvested products and recovery observations.
Sources: European Forest Disturbance Atlas v3.0.0, 13 September 2026; Thünen Institute: results of the 2022 National Forest Inventory; EEA: Europe’s land carbon sink declines
The signal / magnitude without a damage price
Severity measures spectral change, not an invoice.
The main estimates retain observed signed values, including those outside the interval stated in the metadata. Range diagnostics and a restricted-range sensitivity are supplied. All retained values must pass the physical dNBR range check. Negative values remain in the calculation.
Spectral change, without a damage price. 2024.
Signed dNBR / disturbed pixels with nonmissing severity
Severity, missingness and restricted-range sensitivity
| Country | Mean | 75th percentile | Missing pixels | Outside [-1,1] | Restricted mean / Q75 |
|---|---|---|---|---|---|
| Germany | 0.26191 | 0.32500 | 0 | 7 | 0.26190 / 0.32500 |
| Austria | 0.24044 | 0.29400 | 0 | 5 | 0.24043 / 0.29400 |
| Czechia | 0.23659 | 0.28500 | 0 | 0 | 0.23659 / 0.28500 |
| Poland | 0.30579 | 0.38500 | 0 | 24 | 0.30577 / 0.38500 |
| France | 0.30060 | 0.37600 | 0 | 712 | 0.30001 / 0.37600 |
| Spain | 0.32445 | 0.40500 | 0 | 480 | 0.32408 / 0.40500 |
Source: European Forest Disturbance Atlas v3.0.0; native 30 m raster calculations
The source supplies each pixel’s latest disturbance year. A greatest-disturbance-year layer is absent in v3, so the companion calculation derives the year with the largest valid dNBR among detected events, selecting the earliest year for ties. This is a spectral definition of greatest, with limited ecological meaning.
Sources: European Forest Disturbance Atlas v3.0.0, 13 September 2026
The measurement / what the map misses
An accuracy headline can hide the events.
The manual reference contains 1,000 locations per country, split equally between disturbed and undisturbed strata defined by an earlier map. After excluding sites outside the v3 forest mask, the comparison uses their annual labels from 1985 through 2023. These are unweighted sample diagnostics. The design does not supply population weights for national accuracy, and independence from the v3 training data has not been established.
In Germany, exact-year matching finds 203 shared disturbance events, 158 mapped events without an exact-year reference match, and 151 reference events without an exact-year mapped match. The resulting commission rate is 43.8% and omission rate 42.7%. Stable site-years dominate overall agreement, which is why an apparently high accuracy percentage would be a poor summary of event detection.
Count the missed events, not only the quiet years.
Commission and omission / sampled disturbance events, 1985-2023
CommissionMapped events without a reference match / all mapped events.
OmissionReference events without a map match / all reference events.
| Country | Commission | Omission | Mapped / reference events |
|---|---|---|---|
| Germany | 43.8 / 34.3% | 42.7 / 33.1% | 361 / 354 |
| Austria | 38.2 / 32.0% | 35.0 / 28.5% | 369 / 351 |
| Czechia | 34.8 / 24.5% | 45.2 / 36.6% | 400 / 476 |
| Poland | 34.8 / 27.3% | 32.7 / 25.0% | 388 / 376 |
| France | 44.1 / 37.5% | 38.6 / 31.3% | 510 / 464 |
| Spain | 29.6 / 26.7% | 33.8 / 31.1% | 442 / 470 |
Confusion counts, timing offsets and excluded sites
| Country | TP | FP | FN | TN | Included sites | Outside mask / extent | Map timing: early / same / late |
|---|---|---|---|---|---|---|---|
| Germany | 203 | 158 | 151 | 36811 | 957 | 43 / 0 | 3 / 203 / 31 |
| Austria | 228 | 141 | 123 | 37494 | 974 | 26 / 0 | 2 / 228 / 21 |
| Czechia | 261 | 139 | 215 | 37020 | 965 | 35 / 0 | 4 / 261 / 37 |
| Poland | 253 | 135 | 123 | 36461 | 948 | 52 / 0 | 0 / 253 / 29 |
| France | 285 | 225 | 179 | 35737 | 934 | 66 / 0 | 2 / 285 / 32 |
| Spain | 311 | 131 | 159 | 35786 | 933 | 67 / 0 | 1 / 311 / 12 |
Legacy sampling strata and high-confidence sensitivity
| Country / sample | Mapped events | Reference events | Commission | Omission |
|---|---|---|---|---|
| Germany / Legacy undisturbed stratum | 38 | 41 | 73.68% | 75.61% |
| Germany / Legacy disturbed stratum | 323 | 313 | 40.25% | 38.34% |
| Germany / High-confidence subset | 213 | 293 | 5.16% | 31.06% |
| Austria / Legacy undisturbed stratum | 52 | 47 | 61.54% | 57.45% |
| Austria / Legacy disturbed stratum | 317 | 304 | 34.38% | 31.58% |
| Austria / High-confidence subset | 238 | 313 | 4.20% | 27.16% |
| Czechia / Legacy undisturbed stratum | 54 | 75 | 55.56% | 68.00% |
| Czechia / Legacy disturbed stratum | 346 | 401 | 31.50% | 40.90% |
| Czechia / High-confidence subset | 271 | 427 | 4.80% | 39.58% |
| Poland / Legacy undisturbed stratum | 29 | 21 | 79.31% | 71.43% |
| Poland / Legacy disturbed stratum | 359 | 355 | 31.20% | 30.42% |
| Poland / High-confidence subset | 267 | 355 | 5.24% | 28.73% |
| France / Legacy undisturbed stratum | 33 | 56 | 57.58% | 75.00% |
| France / Legacy disturbed stratum | 477 | 408 | 43.19% | 33.58% |
| France / High-confidence subset | 310 | 432 | 8.06% | 34.03% |
| Spain / Legacy undisturbed stratum | 42 | 58 | 35.71% | 53.45% |
| Spain / Legacy disturbed stratum | 400 | 412 | 29.00% | 31.07% |
| Spain / High-confidence subset | 332 | 453 | 6.63% | 31.57% |
Germany annual diagnostics / Austria annual diagnostics / Czechia annual diagnostics / Poland annual diagnostics / France annual diagnostics / Spain annual diagnostics
Source: European forest disturbance reference database v2; matched against EFDA v3
Allowing a one-year timing difference changes Germany’s commission and omission rates to 34.3% and 33.1%. Matching is one-to-one: an observed event cannot validate multiple detections. The exact-year, tolerance, stratum and high-confidence results are all retained. The confidence flag partly uses the same spectral evidence as the satellite method, so it is a sensitivity check rather than an independent certificate.
The reference ends in 2023 and has no causal-agent labels. It cannot validate 2024 directly or certify the agent mix. Nor do these sample rates justify multiplying each country’s mapped hectares by an error correction factor. The findings should be understood as patterns within one consistently processed map release, bounded by a visible account of measurement disagreement.
Sources: European forest disturbance reference database v2, 25 August 2026; European Forest Disturbance Atlas v3.0.0, 13 September 2026
The denominator / a separate sensitivity
Forest hectares, whichever account supplies them.
The principal denominator is the fixed EFDA forest mask. The sensitivity uses Eurostat’s 2023 closing stock of forest hectares, excluding other wooded land and never substituting total national area. Definitions, geographic scope and inventory methods differ, so the result is a scale comparison rather than a harmonized forest-at-risk estimate.
Replacing one positive constant forest denominator with another changes the level of every annual rate in a country by the same factor. It cannot change that country’s year ranking or its ratio of post-period to pre-period means. Across-country levels and area-weighted aggregates can change, which is why both denominators are retained rather than declaring one interchangeable with the other.
A second denominator changes the level.
2024 disturbed ha / mapped forest or 2023 official forest ha, percent
Both forest denominators and source flags
| Country | Mapped ha | Official ha | Disturbed ha | Mapped / official share | Flag |
|---|---|---|---|---|---|
| Germany | 12,231,690.12 | 11,488,390.00 | 85,103.82 | 0.6958 / 0.7408% | None |
| Austria | 4,498,211.34 | 3,898,270.00 | 39,936.60 | 0.8878 / 1.0245% | None |
| Czechia | 3,272,015.25 | 2,946,180.00 | 23,602.05 | 0.7213 / 0.8011% | None |
| Poland | 11,148,582.42 | 9,407,130.00 | 98,237.43 | 0.8812 / 1.0443% | None |
| France | 17,709,519.78 | 17,717,000.00 | 83,312.37 | 0.4704 / 0.4702% | ep |
| Spain | 14,908,557.69 | 19,072,490.00 | 84,466.26 | 0.5666 / 0.4429% | i |
Source: Eurostat for_area_efa
Spain’s national official total includes the Canary Islands, while the EFDA extent does not. France is metropolitan, including Corsica. The Spanish official value is flagged as imputed; the French one is estimated and provisional. Those limitations accompany the sensitivity, instead of being hidden by additional decimal places.
Sources: Eurostat for_area_efa: forest closing stock, 2023, thousand hectares; FAO forest definitions: temporarily unstocked land expected to regenerate
What the evidence permits
A forest needs time to recover.
A latest-year ranking and a diagnosis of a disturbance regime answer different questions. Czechia demonstrates why: a year close to the historical middle can follow a period whose average disturbance was substantially higher. Spain supplies counterevidence to a uniform transition. The six-country record supports different trajectories, not a single Europe-wide regime diagnosis.
For forest owners and public authorities, the next question is whether regeneration restores the services needed before disturbance returns. That requires stand age, species, management, weather and recovery observations alongside the satellite record. A forest can remain green on an administrative map while the time available for recovery changes. That is the condition worth monitoring.
Sources / definitions / failure boundaries
What survives an audit?
One satellite release, every forest pixel
EFDA v3.0.0 supplies all forty years. Native 30 m pixels are counted exactly inside the fixed forest mask, with agent totals, terminal event counts, latest years and ten-kilometer map cells reconciled. Annual recurrence excludes future events; the fixed ten-year lookback is available from 1995. Severity retains signed values and reports missingness and restricted-range sensitivity.
The derived greatest-disturbance year is the maximum valid event dNBR, with earliest-year tie breaking. It is not a native v3 product. France’s 97 and Spain’s 154 outside-mask pixel-year detections are excluded and recorded, never added to forest rates.
What remains unmeasured
Manual labels end in 2023. Their legacy equal strata do not supply national accuracy weights or establish an independent v3 holdout. No causal-agent reference, weather regression, carbon conversion, damage price or recovery model is estimated.
The historical map retains a hash-verified recovered extract, separate component standard errors and missing cells. The original workbook could not be re-extracted during this edition because its archive endpoint was unavailable. Its reconstruction cannot be joined to modern forest hectares as one continuous series.
Research package: data, source receipts + code
- European Forest Disturbance Atlas v3.0.0, 13 September 2026
- Viana-Soto & Senf (2025): forest mask and agent attribution; earlier detector
- European forest disturbance reference database v2, 25 August 2026
- State of Europe’s Forests 2025, corrected May 2026, Table 1.1-3
- FAO forest definitions: temporarily unstocked land expected to regenerate
- Githumbi et al. (2022): European pollen-based REVEALS reconstruction
- LandClimII / REVEALS data and quality flags
- Muigg & Tegel (2021): Forest History—New Perspectives for an Old Discipline
- Hans Carl von Carlowitz, Sylvicultura oeconomica (1713), digitized original
- Eurostat: forestry and wood-based employment, 2022
- Eurostat: forests, forestry and logging; roundwood production
- Thünen Institute: results of the 2022 National Forest Inventory
- Joint Research Centre: forest ecosystem services
- EEA: Europe’s land carbon sink declines
- Eurostat for_area_efa: forest closing stock, 2023, thousand hectares
EFDA and manual-reference data: CC BY 4.0. Historical source rights and photograph licenses remain attached to their receipts. Calculations and interpretation: Michael Schymura. More data stories