01 / Establish the observation
01The build-out is large. What does it establish?
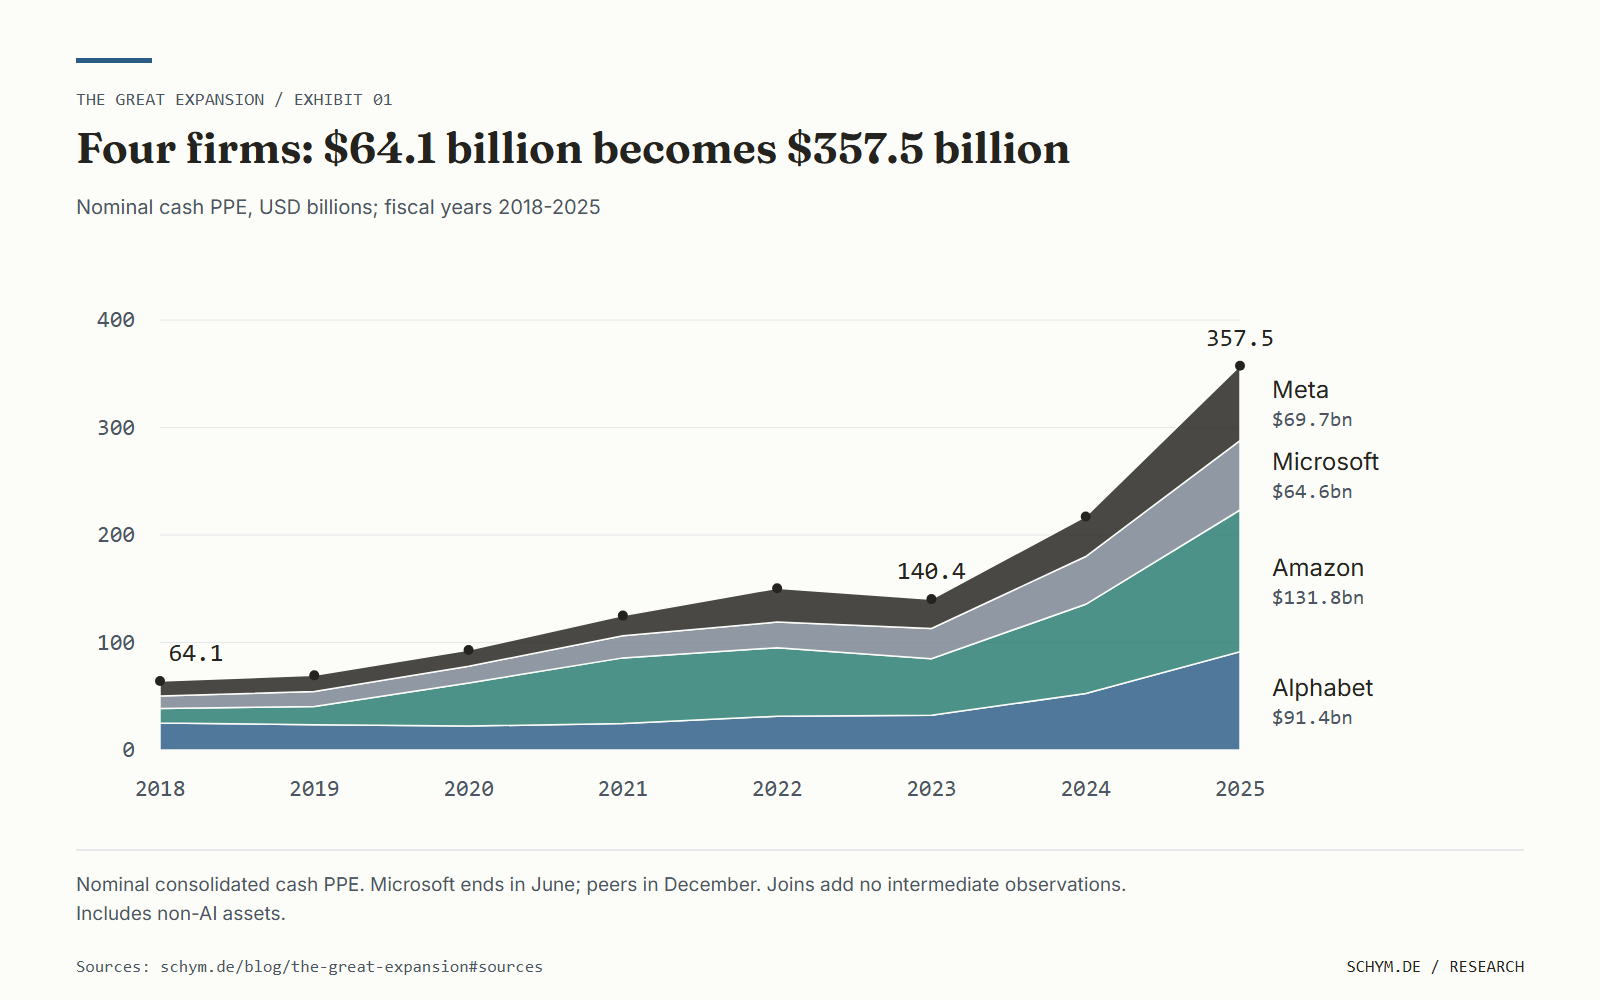
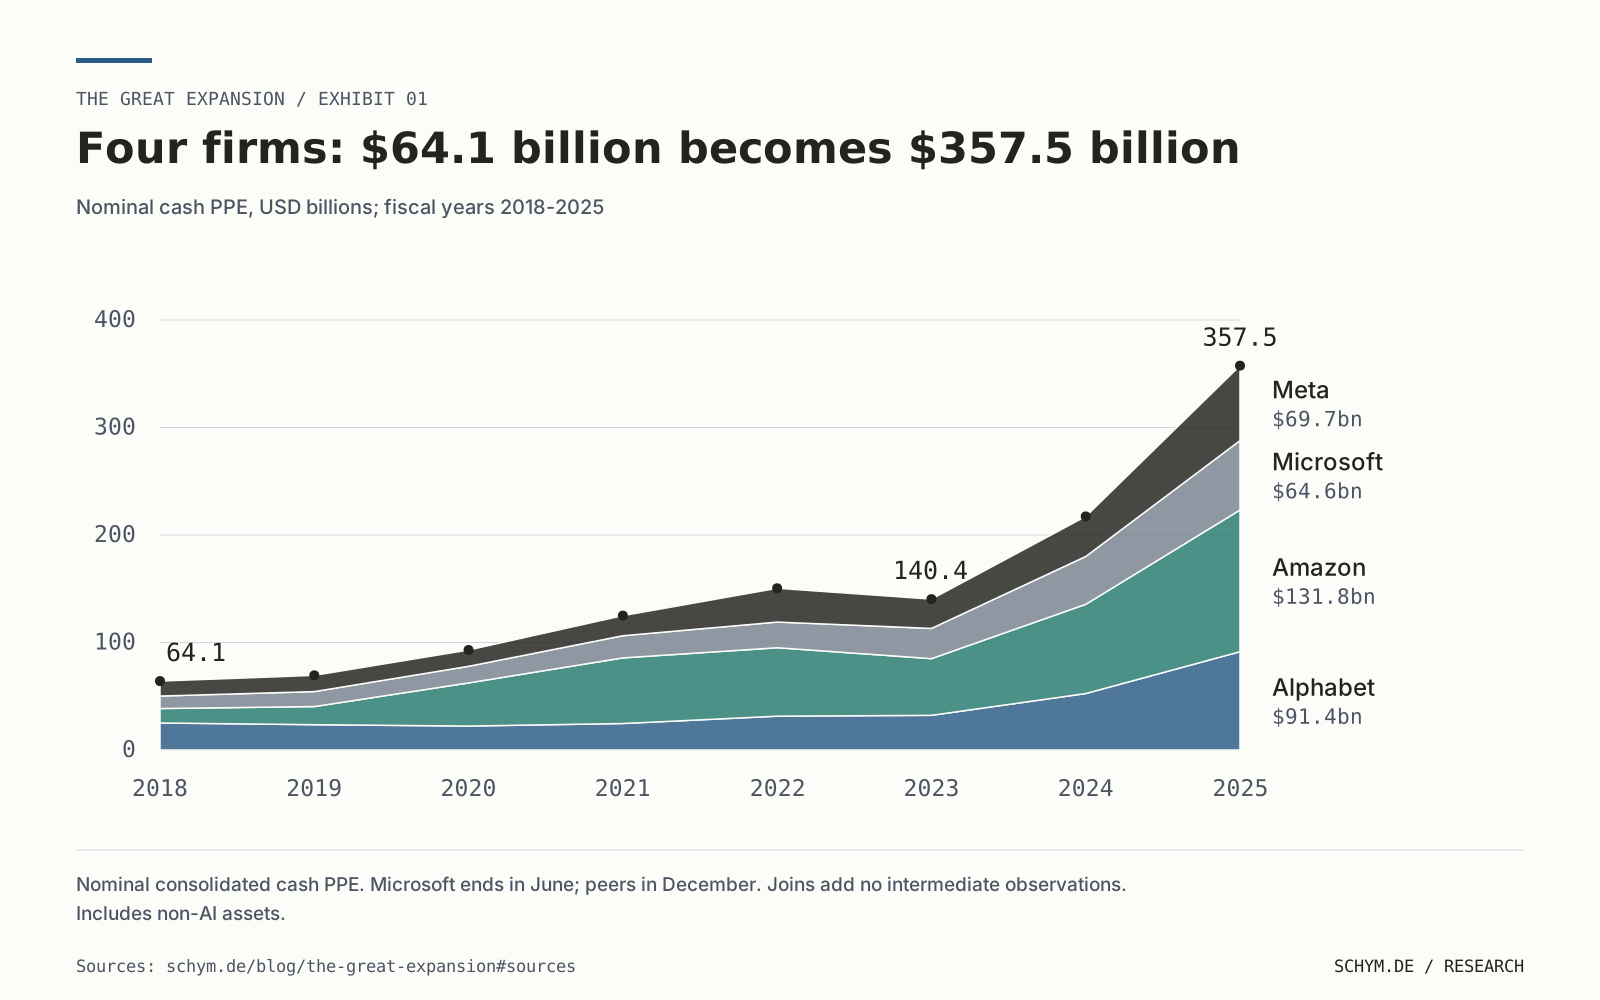
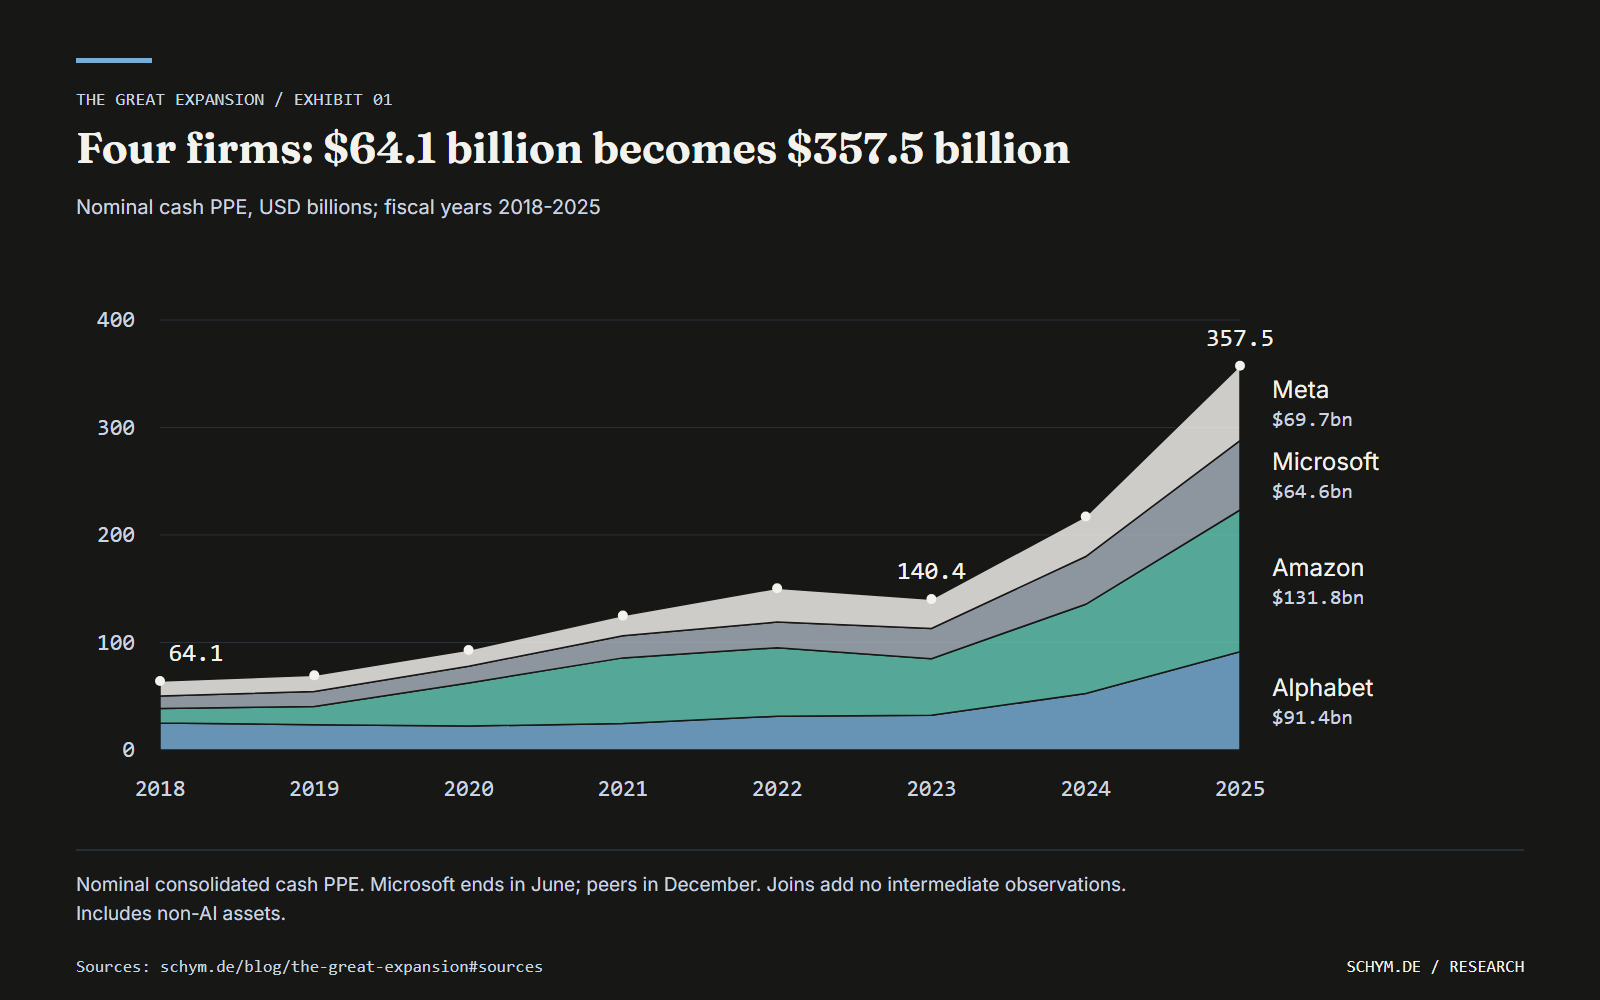
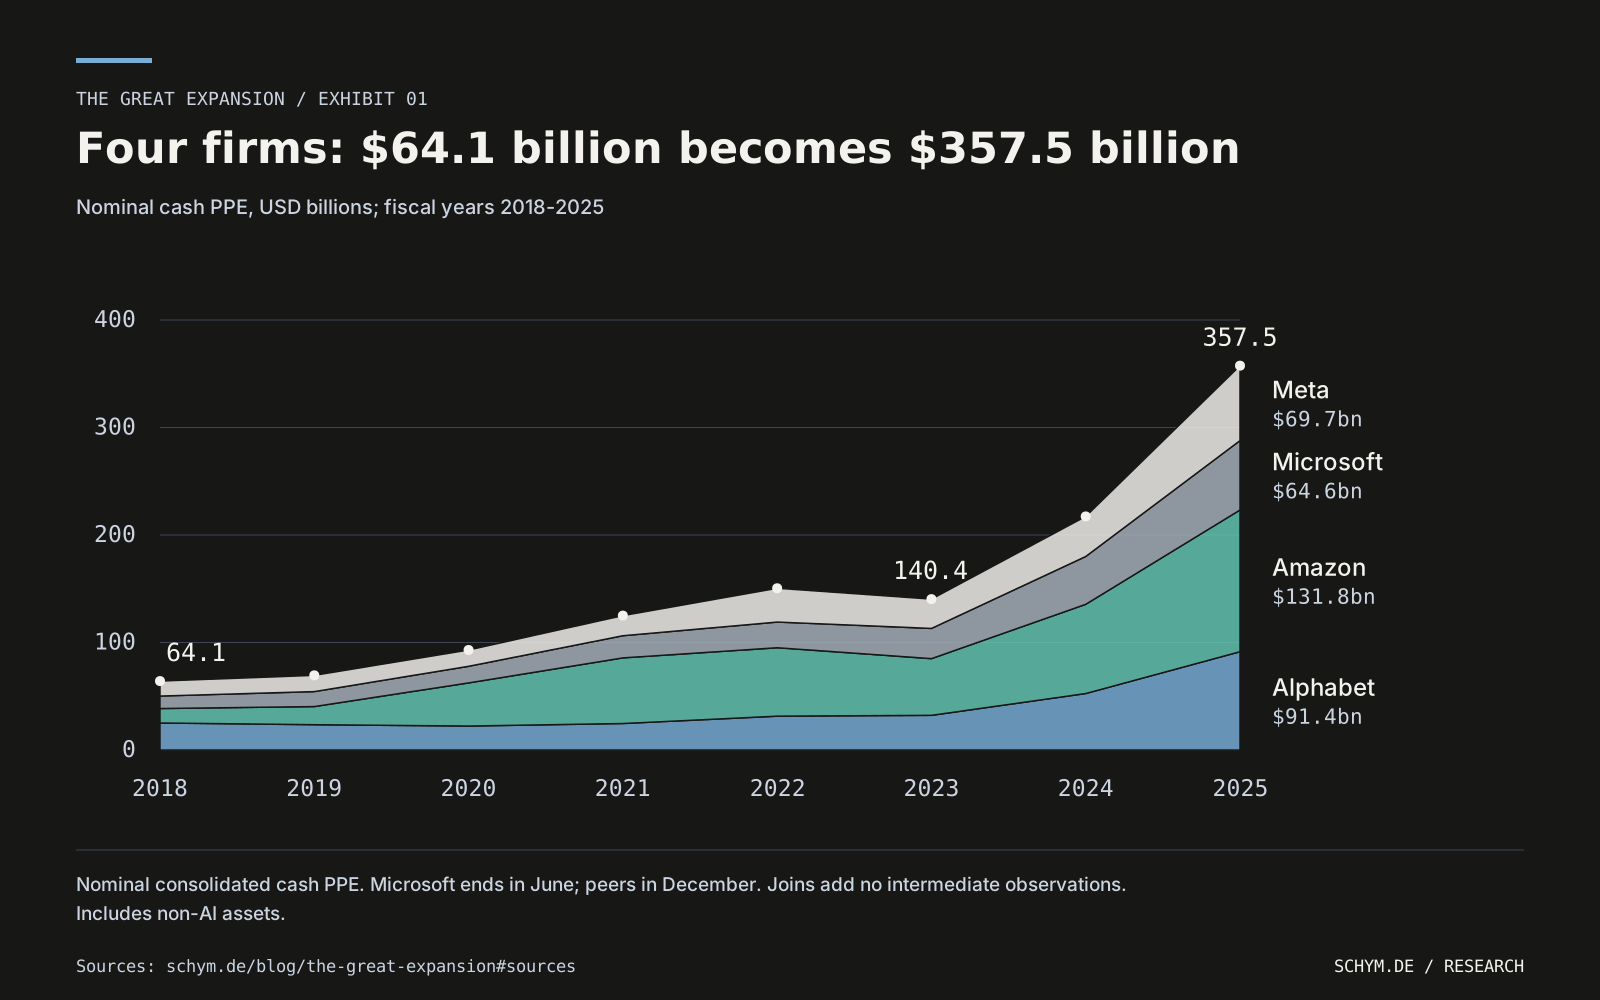
Across Alphabet, Amazon, Microsoft and Meta, annual cash purchases of property and equipment increased from $64.113 billion in FY2018 to $357.508 billion in FY2025. The endpoint is about 5.6 times the starting value. This is a substantial commitment of resources, measured in completed company accounts rather than by adding announcements of future spending.
The annual path matters as much as the endpoints. The cohort total fell from $150.447 billion in FY2022 to $140.353 billion in FY2023, before the subsequent rise. A story of uninterrupted acceleration would erase that reversal. Nor does the aggregate describe four identical businesses: Amazon's physical assets support retail and logistics as well as cloud computing, while the other firms have different operating structures.
Sources SEC EDGAR / Alphabet; SEC EDGAR / Amazon; SEC EDGAR / Microsoft; SEC EDGAR / Meta
Four firms moved from $64.113bn in FY2018 to $357.508bn in FY2025, with a visible FY2023 dip to $140.353bn from $150.447bn.
Hover or tap a year to inspect it. With the chart focused, use arrow keys, Home or End; press Enter to pin and Escape to return to the pinned year.
- Alphabet$91.447bn · FY2025
- Amazon$131.819bn · FY2025
- Microsoft$64.551bn · FY2025
- Meta$69.691bn · FY2025
- FY2018$64.113bn
- FY2019$69.436bn
- FY2020$93.025bn
- FY2021$125.005bn
- FY2022$150.447bn
- FY2023$140.353bn
- FY2024$217.267bn
- FY2025$357.508bn
Nominal consolidated-company cash PPE, not AI-only spending. Fiscal years mix June and December period ends. Straight joins connect actual annual observations; they do not add estimated intermediate records.
Inspect exact values and sources
| Firm | Fiscal year | Period end | Cash PPE, $bn | Revenue, $bn | Cash PPE / revenue | Source |
|---|---|---|---|---|---|---|
| Alphabet | 2018 | 2018-12-31 | 25.139 | 136.819 | 18.3739% | fin-alphabet-facts |
| Alphabet | 2019 | 2019-12-31 | 23.548 | 161.857 | 14.5486% | fin-alphabet-facts |
| Alphabet | 2020 | 2020-12-31 | 22.281 | 182.527 | 12.2070% | fin-alphabet-facts |
| Alphabet | 2021 | 2021-12-31 | 24.640 | 257.637 | 9.5638% | fin-alphabet-facts |
| Alphabet | 2022 | 2022-12-31 | 31.485 | 282.836 | 11.1319% | fin-alphabet-facts |
| Alphabet | 2023 | 2023-12-31 | 32.251 | 307.394 | 10.4917% | fin-alphabet-facts |
| Alphabet | 2024 | 2024-12-31 | 52.535 | 350.018 | 15.0092% | fin-alphabet-facts, fin-alphabet-2025 |
| Alphabet | 2025 | 2025-12-31 | 91.447 | 402.836 | 22.7008% | fin-alphabet-facts, fin-alphabet-2025 |
| Amazon | 2018 | 2018-12-31 | 13.427 | 232.887 | 5.7655% | fin-amazon-facts |
| Amazon | 2019 | 2019-12-31 | 16.861 | 280.522 | 6.0106% | fin-amazon-facts |
| Amazon | 2020 | 2020-12-31 | 40.140 | 386.064 | 10.3972% | fin-amazon-facts |
| Amazon | 2021 | 2021-12-31 | 61.053 | 469.822 | 12.9949% | fin-amazon-facts |
| Amazon | 2022 | 2022-12-31 | 63.645 | 513.983 | 12.3827% | fin-amazon-facts |
| Amazon | 2023 | 2023-12-31 | 52.729 | 574.785 | 9.1737% | fin-amazon-facts |
| Amazon | 2024 | 2024-12-31 | 82.999 | 637.959 | 13.0101% | fin-amazon-facts, fin-amazon-2025 |
| Amazon | 2025 | 2025-12-31 | 131.819 | 716.924 | 18.3867% | fin-amazon-facts, fin-amazon-2025 |
| Microsoft | 2018 | 2018-06-30 | 11.632 | 110.360 | 10.5401% | fin-microsoft-facts |
| Microsoft | 2019 | 2019-06-30 | 13.925 | 125.843 | 11.0654% | fin-microsoft-facts |
| Microsoft | 2020 | 2020-06-30 | 15.441 | 143.015 | 10.7968% | fin-microsoft-facts |
| Microsoft | 2021 | 2021-06-30 | 20.622 | 168.088 | 12.2686% | fin-microsoft-facts |
| Microsoft | 2022 | 2022-06-30 | 23.886 | 198.270 | 12.0472% | fin-microsoft-facts |
| Microsoft | 2023 | 2023-06-30 | 28.107 | 211.915 | 13.2633% | fin-microsoft-facts |
| Microsoft | 2024 | 2024-06-30 | 44.477 | 245.122 | 18.1448% | fin-microsoft-facts, fin-microsoft-2026 |
| Microsoft | 2025 | 2025-06-30 | 64.551 | 281.724 | 22.9129% | fin-microsoft-facts, fin-microsoft-2026 |
| Meta | 2018 | 2018-12-31 | 13.915 | 55.838 | 24.9203% | fin-meta-facts |
| Meta | 2019 | 2019-12-31 | 15.102 | 70.697 | 21.3616% | fin-meta-facts |
| Meta | 2020 | 2020-12-31 | 15.163 | 85.965 | 17.6386% | fin-meta-facts |
| Meta | 2021 | 2021-12-31 | 18.690 | 117.929 | 15.8485% | fin-meta-facts |
| Meta | 2022 | 2022-12-31 | 31.431 | 116.609 | 26.9542% | fin-meta-facts |
| Meta | 2023 | 2023-12-31 | 27.266 | 134.902 | 20.2117% | fin-meta-facts |
| Meta | 2024 | 2024-12-31 | 37.256 | 164.501 | 22.6479% | fin-meta-facts, fin-meta-2025 |
| Meta | 2025 | 2025-12-31 | 69.691 | 200.966 | 34.6780% | fin-meta-facts, fin-meta-2025 |
InterpretationRead these as annual cash commitments by a fixed four-firm cohort. The composition identifies which disclosed company accounts contribute to the total; it does not identify the AI purpose of each asset.
- Unit
- Nominal cash PPE, USD billions; fiscal years 2018-2025
- Sources
8 reviewed records
- Exact values
- CSV
A capital-expenditure account answers a narrower question than a corporate map. It records payments for physical assets. It does not tell us whether a particular server supports AI, which production stage moved under common ownership, or who contracts with the final customer. Cash purchases also omit some assets acquired through financing arrangements. Mixing them with lease-inclusive headlines would change the accounting definition in the middle of the comparison.
The clock has a boundary too. Microsoft's fiscal year ends in June; the three peers end in December. These are nominal, consolidated-company amounts, including international and non-AI operations. Their sum is a useful fiscal-year cohort comparison, not a synchronized calendar-year measure of global AI investment.
The spending increase establishes capacity and commitment. To infer a larger firm boundary, we need an additional argument: why should owning the next activity outperform buying its output from someone else? That is a question about governance, not simply about scale.
Sources SEC EDGAR / Alphabet; SEC EDGAR / Amazon; SEC EDGAR / Microsoft; SEC EDGAR / Meta; Wiley / Economica
02 / Let the first explanation fail
02AI works on both sides of the make-or-buy decision.
Coase's starting point is straightforward: using a market is not free. Finding a supplier, explaining the task, negotiating terms, checking quality and adapting to surprises all consume resources. A firm replaces some of those transactions with managerial direction. It does not make coordination disappear. Managers must still allocate attention, transmit knowledge, motivate people and correct mistakes.
A firm boundary is the point at which an activity is organized under common ownership rather than obtained through a market relationship. The relevant comparison is the full cost of delivering a specified result under each arrangement. A supplier's price is only one component; internal production cost is only another. Verification, delivery risk, adaptation and incremental fixed costs belong in the comparison as well.
Consider the teaching model below. Its inputs are arbitrary cost units per equivalent project, not estimates for any company. Internal production starts at 60 units, internal coordination at 30, verification at 10 and expected delivery or liability cost at 10. Integration overhead is a separate assumption. The market alternative has a purchase price of 70, contracting cost of 25, verification cost of 10, expected failure cost of 5 and fixed cost of 5.
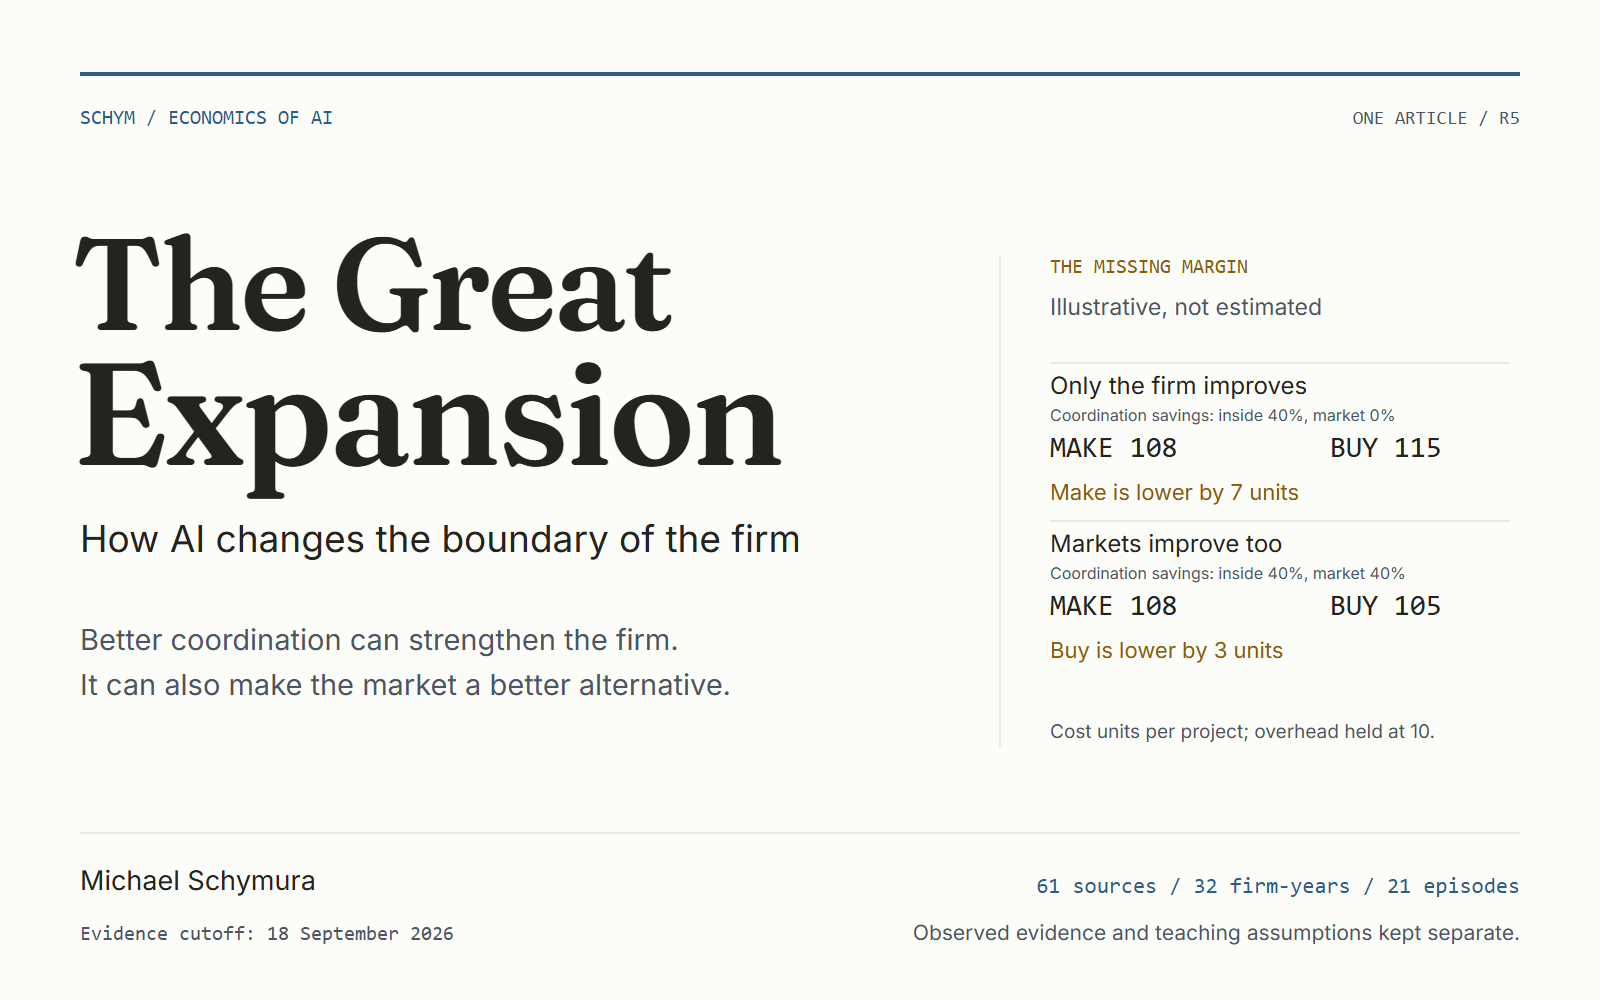
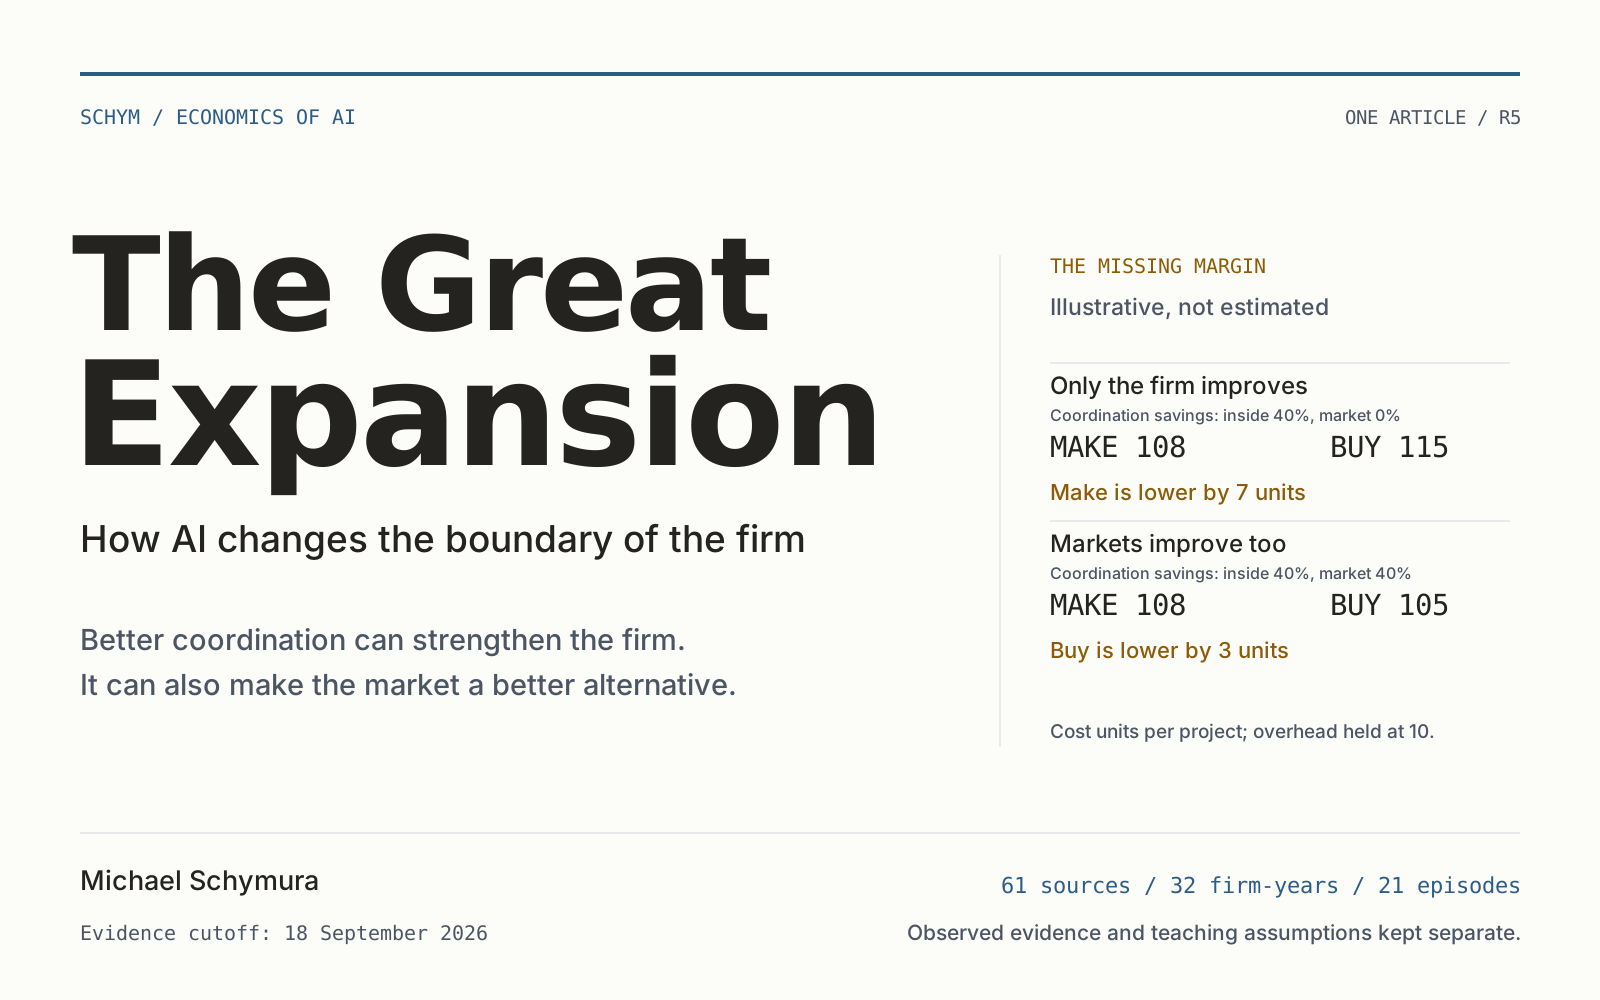
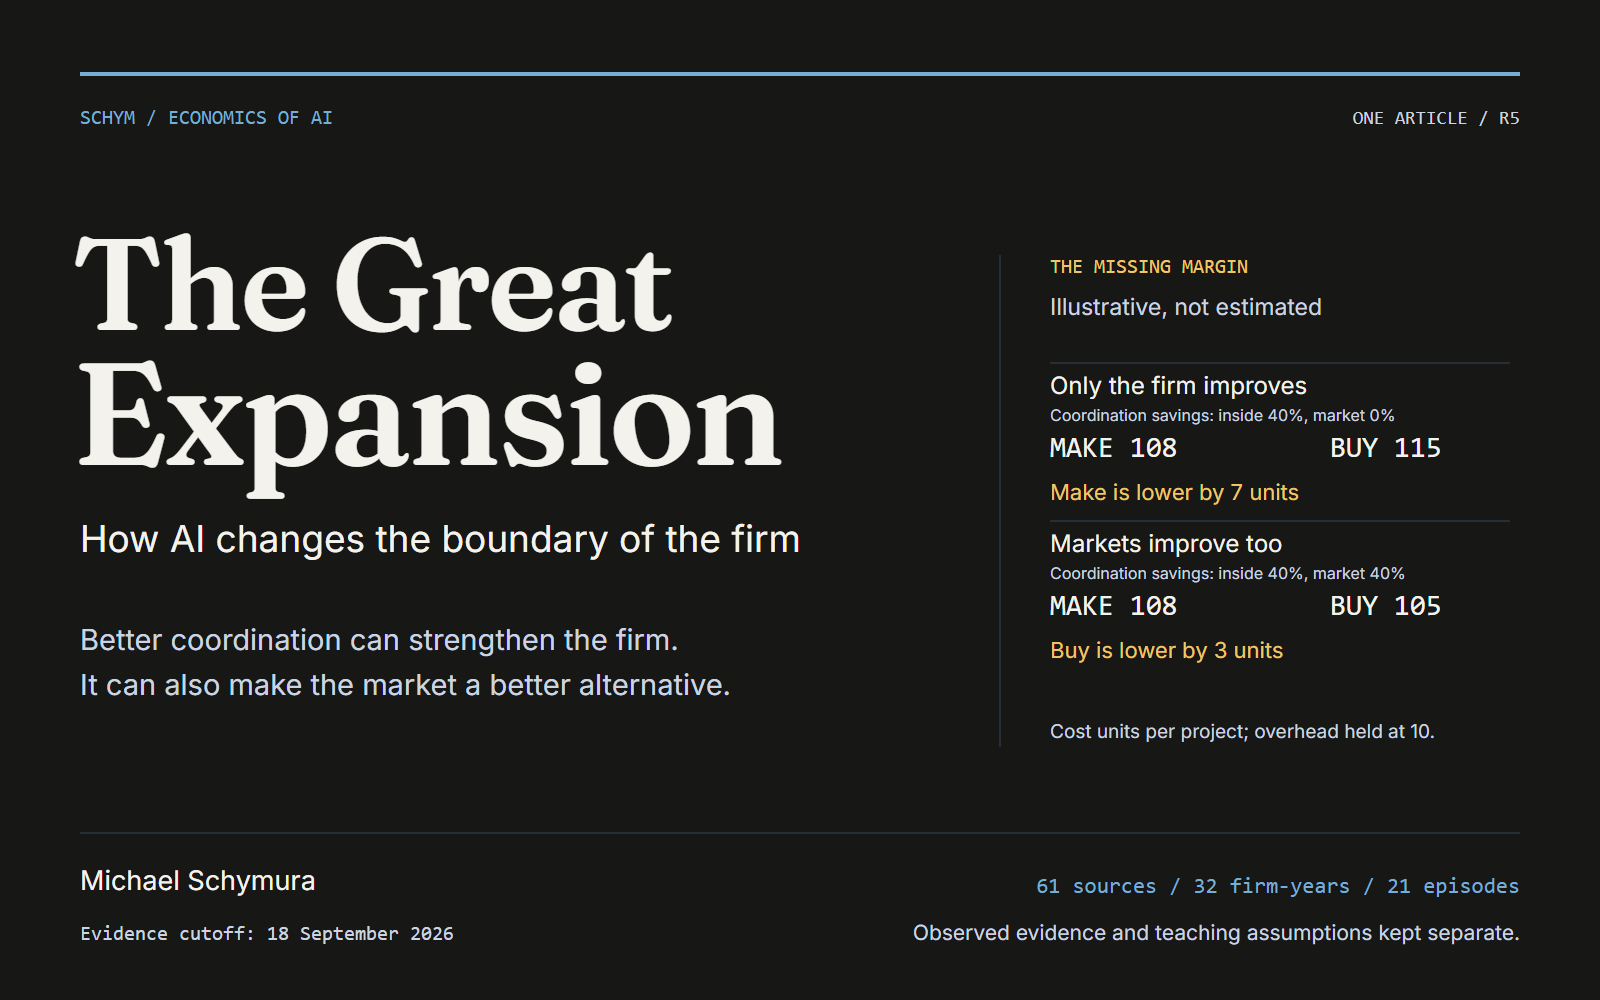
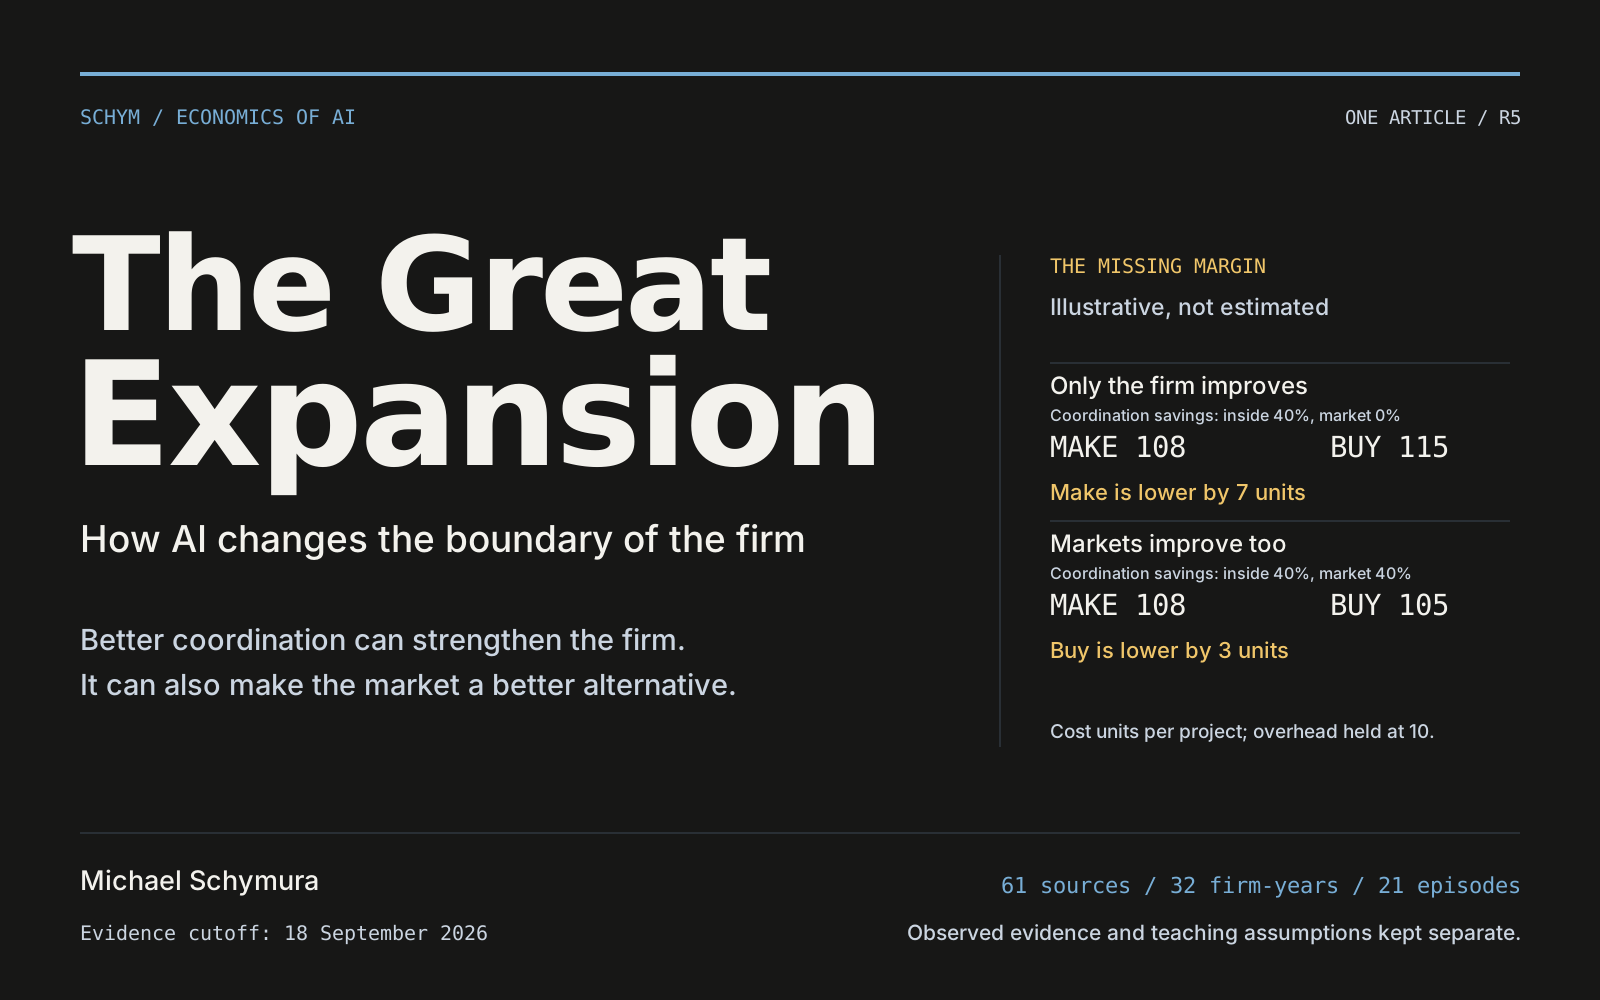
With overhead set to 10, a 40% reduction in internal coordination cost lowers the internal total to 108, compared with 115 for the unchanged market alternative. The one-sided story therefore favors making the output inside the firm. Now let market contracting costs fall by 40% as well. The market total becomes 105 while the internal total remains 108. The preferred arrangement reverses, although the firm has become more efficient.
Sources Wiley / Economica
Fig. 02 / illustrative decision instrument
Two margins define a straight make-or-buy boundary.
Move the inside and market savings independently. Each contour joins assumptions with the same gap between making and buying. The solid zero line marks equal cost under this teaching model, not an estimated company boundary.
Negative Δ: make lower. Positive Δ: buy lower. Solid Δ = 0: equal cost.
Keyboard: ←/→ changes inside saving by 5 points; ↓/↑ changes market saving by 5. Pointer or touch selects the nearest whole-percentage pair.
Exact component ledger
| Component | Make | Buy |
|---|---|---|
| Production / purchase | 60.00 | 70.00 |
| Coordination / contracting | 18.00 | 15.00 |
| Verification | 10.00 | 10.00 |
| Expected delivery / liability cost | 10.00 | 5.00 |
| Incremental fixed cost | 10.00 | 5.00 |
| Current total | 108.00 | 105.00 |
Interpretation boundary
Illustrative cost units per equivalent project. These inputs are assumptions, not estimated company costs or an AI impact forecast. Other cost components remain fixed at the values shown.
Conceptual source anchors: Coase · Williamson. The contour is illustrative—not estimated company costs, a probability, confidence interval or forecast.
Inspect exact values and sources
| Teaching case | Inside saving | Market saving | Overhead | Internal cost | Market cost | Lower-cost arrangement |
|---|---|---|---|---|---|---|
| Only the firm improves | 40% | 0% | 10 | 108.00 | 115.00 | make |
| Markets improve too | 40% | 40% | 10 | 108.00 | 105.00 | buy |
| Lower integration overhead | 40% | 40% | 0 | 98.00 | 105.00 | make |
InterpretationChange one assumption at a time. The frontier separates lower internal cost from lower market cost under this displayed model. It is not a fitted boundary, a probability of acquisition or a forecast of company behavior.
- Unit
- Illustrative cost difference per equivalent project; two saving assumptions in percent
- Sources
- Exact values
- Default model grid CSV
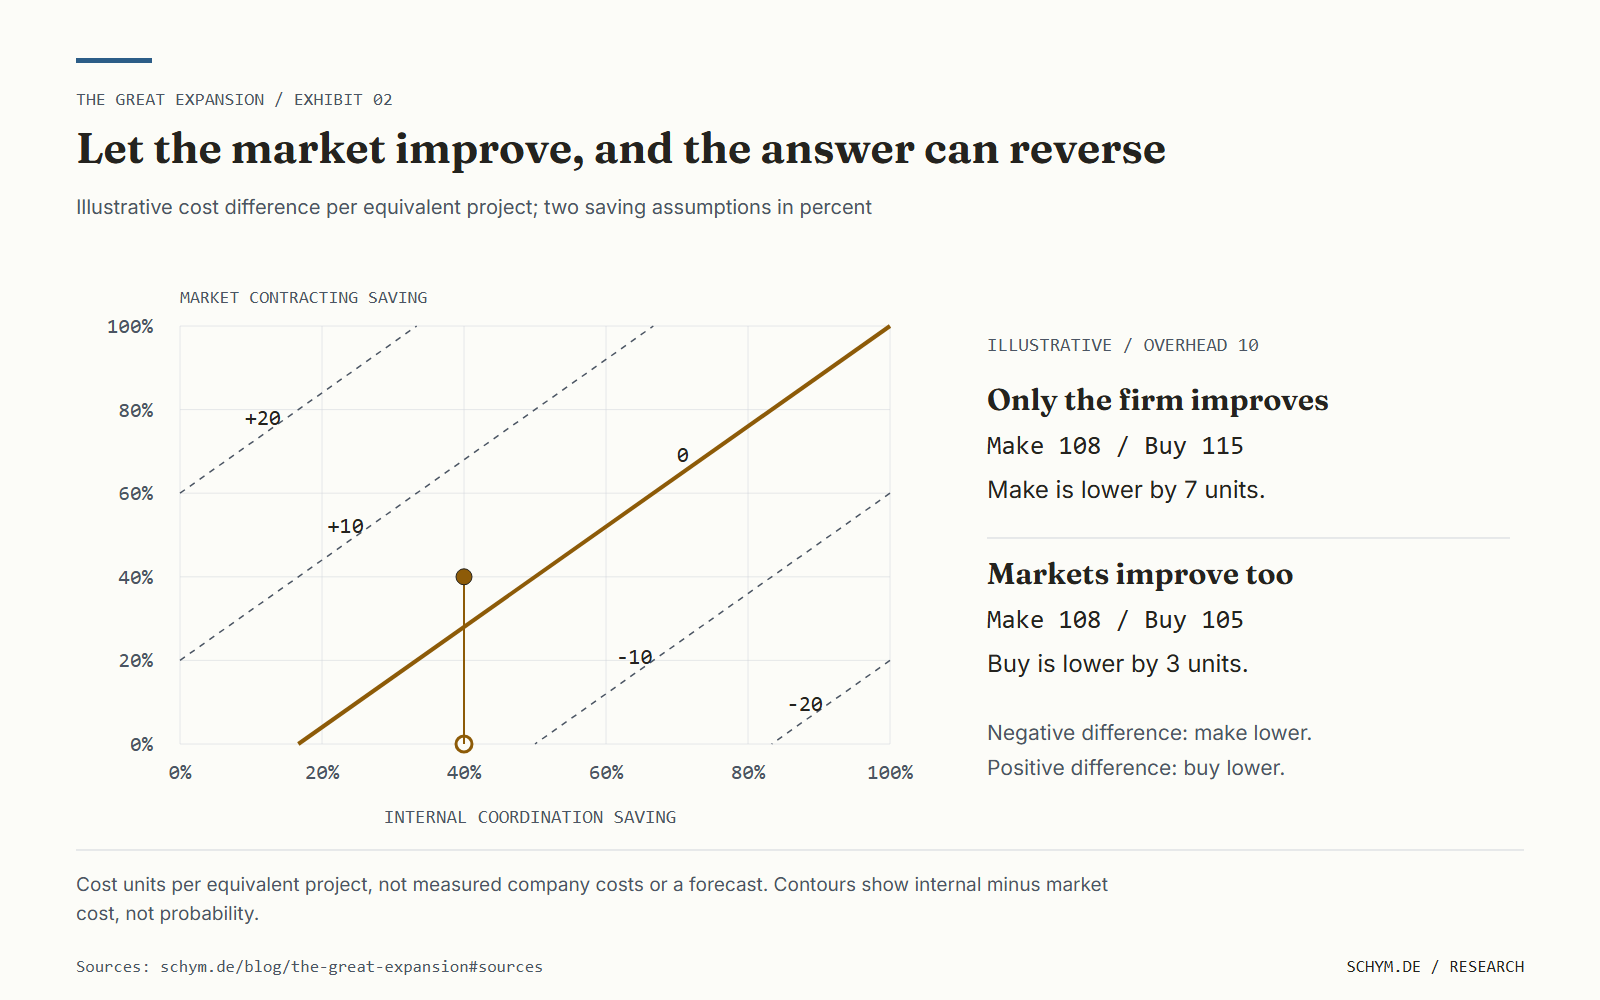
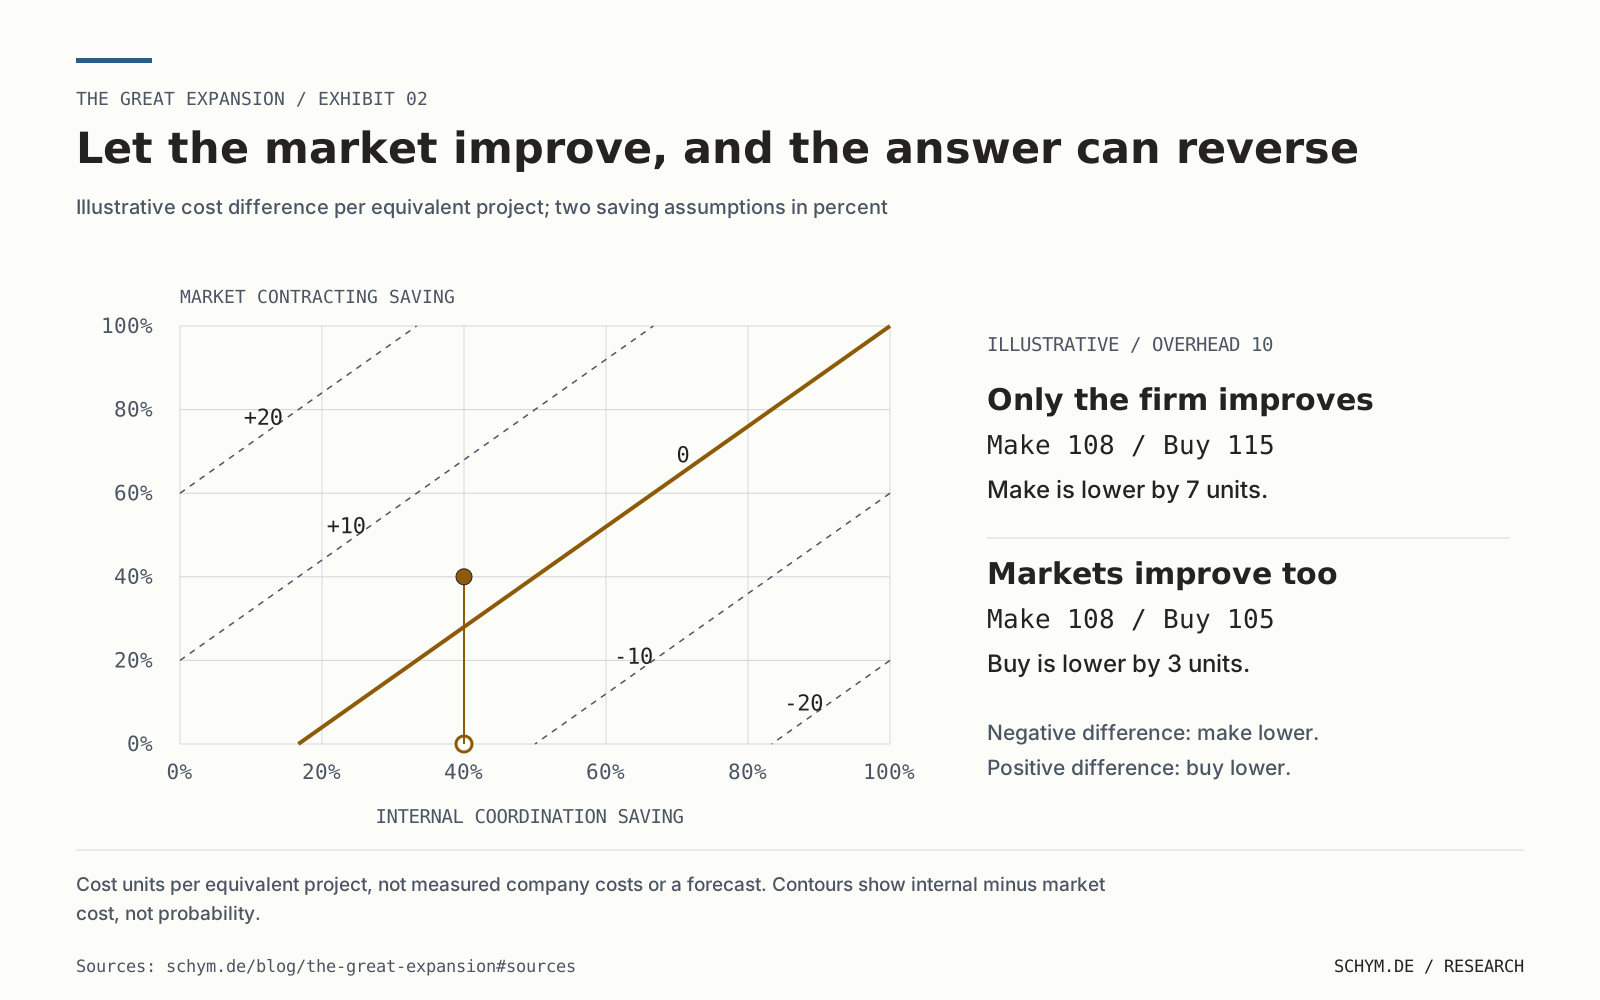
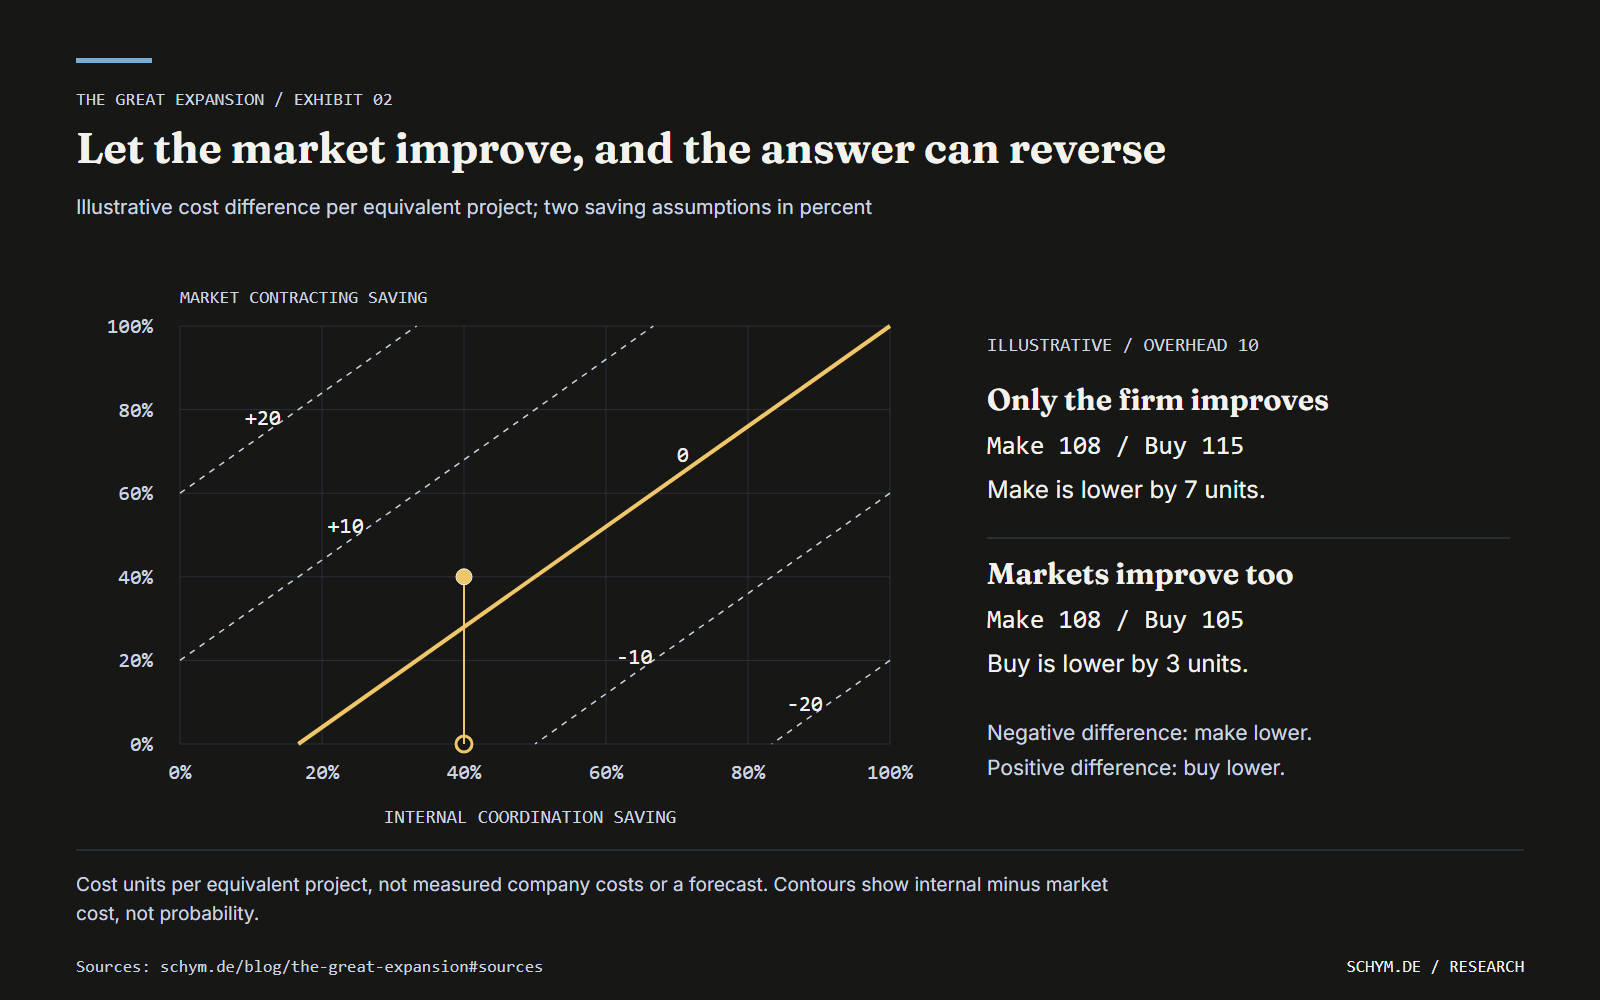
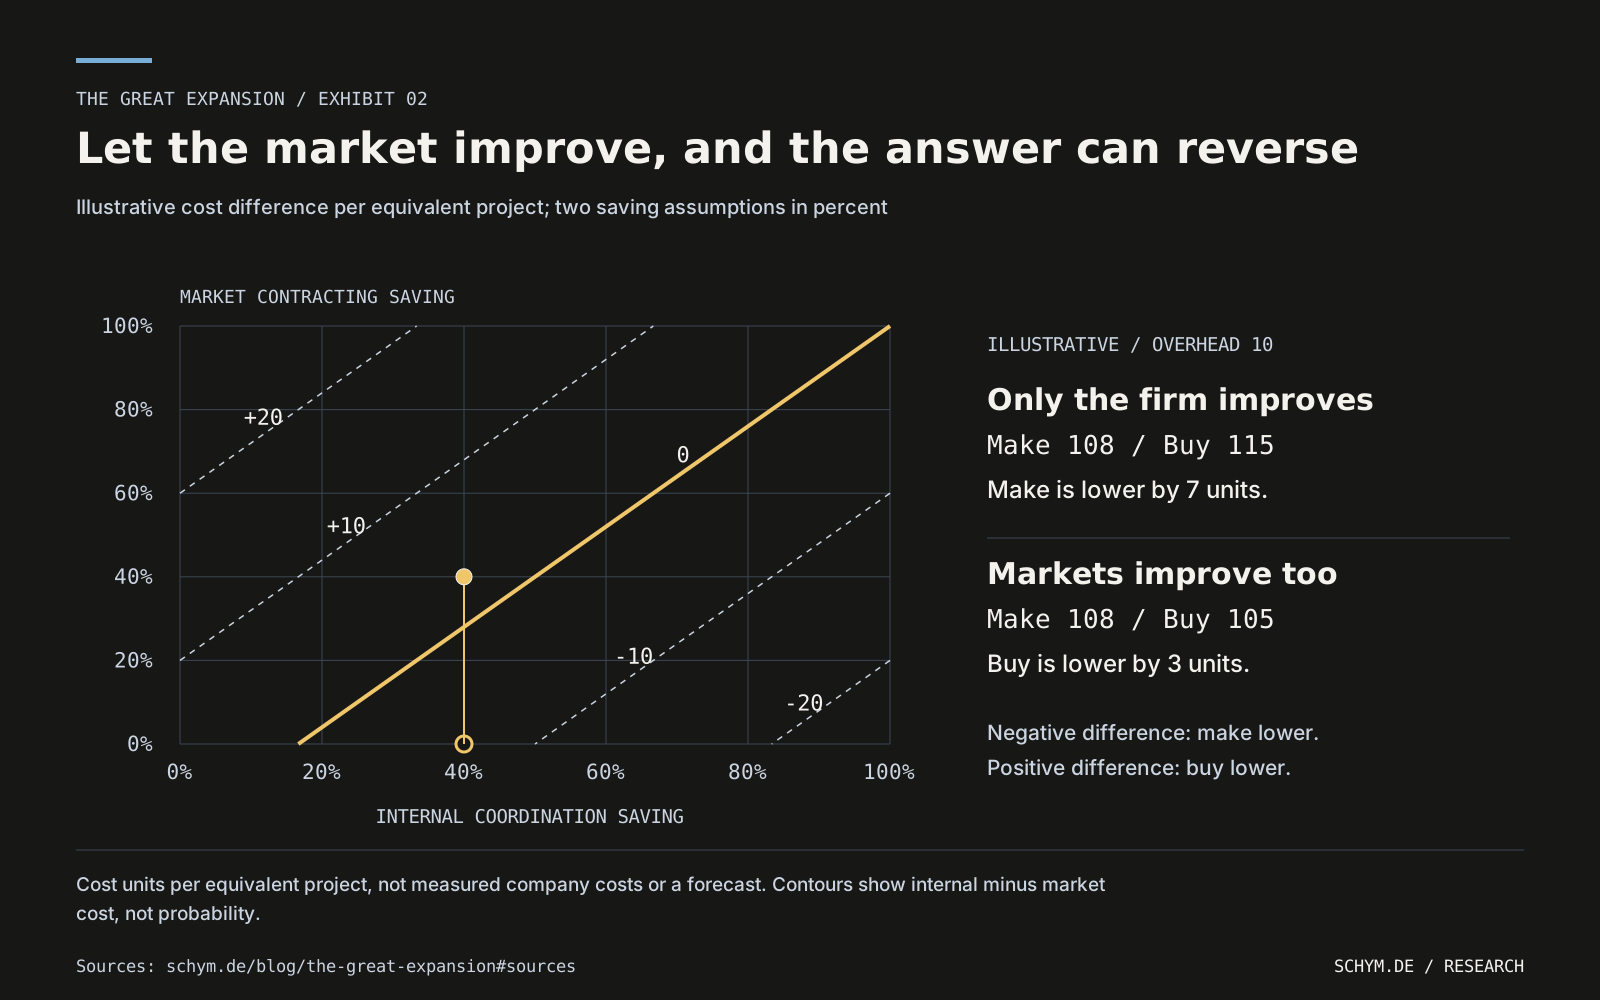
IllustrativeIn the illustrative example, improving internal coordination alone favors making at 108 versus buying at 115. Improving market coordination too favors buying at 105 versus making at 108.
The lesson is the comparison, not the chosen numbers. Lower internal costs do not determine the direction of the boundary unless we know what happened to the external alternative. Reducing integration overhead can reverse the result again. In practice, AI may also alter production quality, verification needs, failure risk and capacity constraints; this small model holds those other components at the assumptions shown.
This is why general technical capability does not, by itself, predict a new conglomerate. A reusable model may lower the cost of entering another activity, but an API can make a similar capability available to an independent entrant. Ownership needs an additional advantage: difficult-to-contract adaptation, specific assets, privileged information, a scarce complement or a durable quality benefit from common control.
Sources Wiley / Economica; University of Chicago Press; University of Chicago Press / Harvard DASH; University of Connecticut / Oxford University Press
03 / Return to the company accounts
03A larger business and a more capital-intensive business are different findings.
The financial panel cannot supply the unobserved costs in that teaching model. It can answer a related descriptive question: did physical investment rise only because the firms grew, or did it also become larger relative to their revenue? Dividing cash property spending by the same firm's revenue separates investment scale from the size of the sales base.
For the cohort as a whole, the ratio of summed cash property spending to summed revenue rises from 11.964% in FY2018 to 22.310% in FY2025. This is a ratio of sums, not a simple average of four company percentages. It says that a larger share of the cohort's revenue was matched by that year's cash property spending under the chosen accounting definition.
Sources SEC EDGAR / Alphabet; SEC EDGAR / Amazon; SEC EDGAR / Microsoft; SEC EDGAR / Meta
Hover to inspect; click or tap to keep a point. With the plot focused, use left and right arrows for fiscal year, up and down arrows for firm, Home and End for year bounds, then Enter to persist or Escape to cancel inspection. The selects provide the same controls without the plot interaction.
- Alphabet
- Amazon
- Microsoft
- Meta
Each path joins eight observed fiscal records. Selection emphasizes one firm, not a fitted relationship.
Nominal consolidated-company accounts with mixed fiscal-year ends. Cash property spending is not an AI-only spending measure, and the observed path is neither a forecast nor an interpolation.
FY2018–FY2025 is emphasized; all 32 reviewed observations remain in context.
Exact 32-record capital ledger
| Firm | FY | Period end | Revenue, $bn | Cash PPE, $bn | Ratio | Audit source |
|---|---|---|---|---|---|---|
| Alphabet | 2018 | 2018-12-31 | 136.819 | 25.139 | 18.3739% | fin-alphabet-facts |
| Alphabet | 2019 | 2019-12-31 | 161.857 | 23.548 | 14.5486% | fin-alphabet-facts |
| Alphabet | 2020 | 2020-12-31 | 182.527 | 22.281 | 12.2070% | fin-alphabet-facts |
| Alphabet | 2021 | 2021-12-31 | 257.637 | 24.640 | 9.5638% | fin-alphabet-facts |
| Alphabet | 2022 | 2022-12-31 | 282.836 | 31.485 | 11.1319% | fin-alphabet-facts |
| Alphabet | 2023 | 2023-12-31 | 307.394 | 32.251 | 10.4917% | fin-alphabet-facts |
| Alphabet | 2024 | 2024-12-31 | 350.018 | 52.535 | 15.0092% | fin-alphabet-facts, fin-alphabet-2025 |
| Alphabet | 2025 | 2025-12-31 | 402.836 | 91.447 | 22.7008% | fin-alphabet-facts, fin-alphabet-2025 |
| Amazon | 2018 | 2018-12-31 | 232.887 | 13.427 | 5.7655% | fin-amazon-facts |
| Amazon | 2019 | 2019-12-31 | 280.522 | 16.861 | 6.0106% | fin-amazon-facts |
| Amazon | 2020 | 2020-12-31 | 386.064 | 40.140 | 10.3972% | fin-amazon-facts |
| Amazon | 2021 | 2021-12-31 | 469.822 | 61.053 | 12.9949% | fin-amazon-facts |
| Amazon | 2022 | 2022-12-31 | 513.983 | 63.645 | 12.3827% | fin-amazon-facts |
| Amazon | 2023 | 2023-12-31 | 574.785 | 52.729 | 9.1737% | fin-amazon-facts |
| Amazon | 2024 | 2024-12-31 | 637.959 | 82.999 | 13.0101% | fin-amazon-facts, fin-amazon-2025 |
| Amazon | 2025 | 2025-12-31 | 716.924 | 131.819 | 18.3867% | fin-amazon-facts, fin-amazon-2025 |
| Microsoft | 2018 | 2018-06-30 | 110.360 | 11.632 | 10.5401% | fin-microsoft-facts |
| Microsoft | 2019 | 2019-06-30 | 125.843 | 13.925 | 11.0654% | fin-microsoft-facts |
| Microsoft | 2020 | 2020-06-30 | 143.015 | 15.441 | 10.7968% | fin-microsoft-facts |
| Microsoft | 2021 | 2021-06-30 | 168.088 | 20.622 | 12.2686% | fin-microsoft-facts |
| Microsoft | 2022 | 2022-06-30 | 198.270 | 23.886 | 12.0472% | fin-microsoft-facts |
| Microsoft | 2023 | 2023-06-30 | 211.915 | 28.107 | 13.2633% | fin-microsoft-facts |
| Microsoft | 2024 | 2024-06-30 | 245.122 | 44.477 | 18.1448% | fin-microsoft-facts, fin-microsoft-2026 |
| Microsoft | 2025 | 2025-06-30 | 281.724 | 64.551 | 22.9129% | fin-microsoft-facts, fin-microsoft-2026 |
| Meta | 2018 | 2018-12-31 | 55.838 | 13.915 | 24.9203% | fin-meta-facts |
| Meta | 2019 | 2019-12-31 | 70.697 | 15.102 | 21.3616% | fin-meta-facts |
| Meta | 2020 | 2020-12-31 | 85.965 | 15.163 | 17.6386% | fin-meta-facts |
| Meta | 2021 | 2021-12-31 | 117.929 | 18.690 | 15.8485% | fin-meta-facts |
| Meta | 2022 | 2022-12-31 | 116.609 | 31.431 | 26.9542% | fin-meta-facts |
| Meta | 2023 | 2023-12-31 | 134.902 | 27.266 | 20.2117% | fin-meta-facts |
| Meta | 2024 | 2024-12-31 | 164.501 | 37.256 | 22.6479% | fin-meta-facts, fin-meta-2025 |
| Meta | 2025 | 2025-12-31 | 200.966 | 69.691 | 34.6780% | fin-meta-facts, fin-meta-2025 |
InterpretationMoving right means more reported revenue; moving up means more cash property spending. A ray from the origin represents a constant spending-to-revenue ratio. The ordered observations reveal changes in scale and intensity without turning the relationship into a production function.
- Unit
- Revenue and cash PPE in nominal USD billions; FY2018-2025
- Sources
8 reviewed records
- Exact values
- CSV
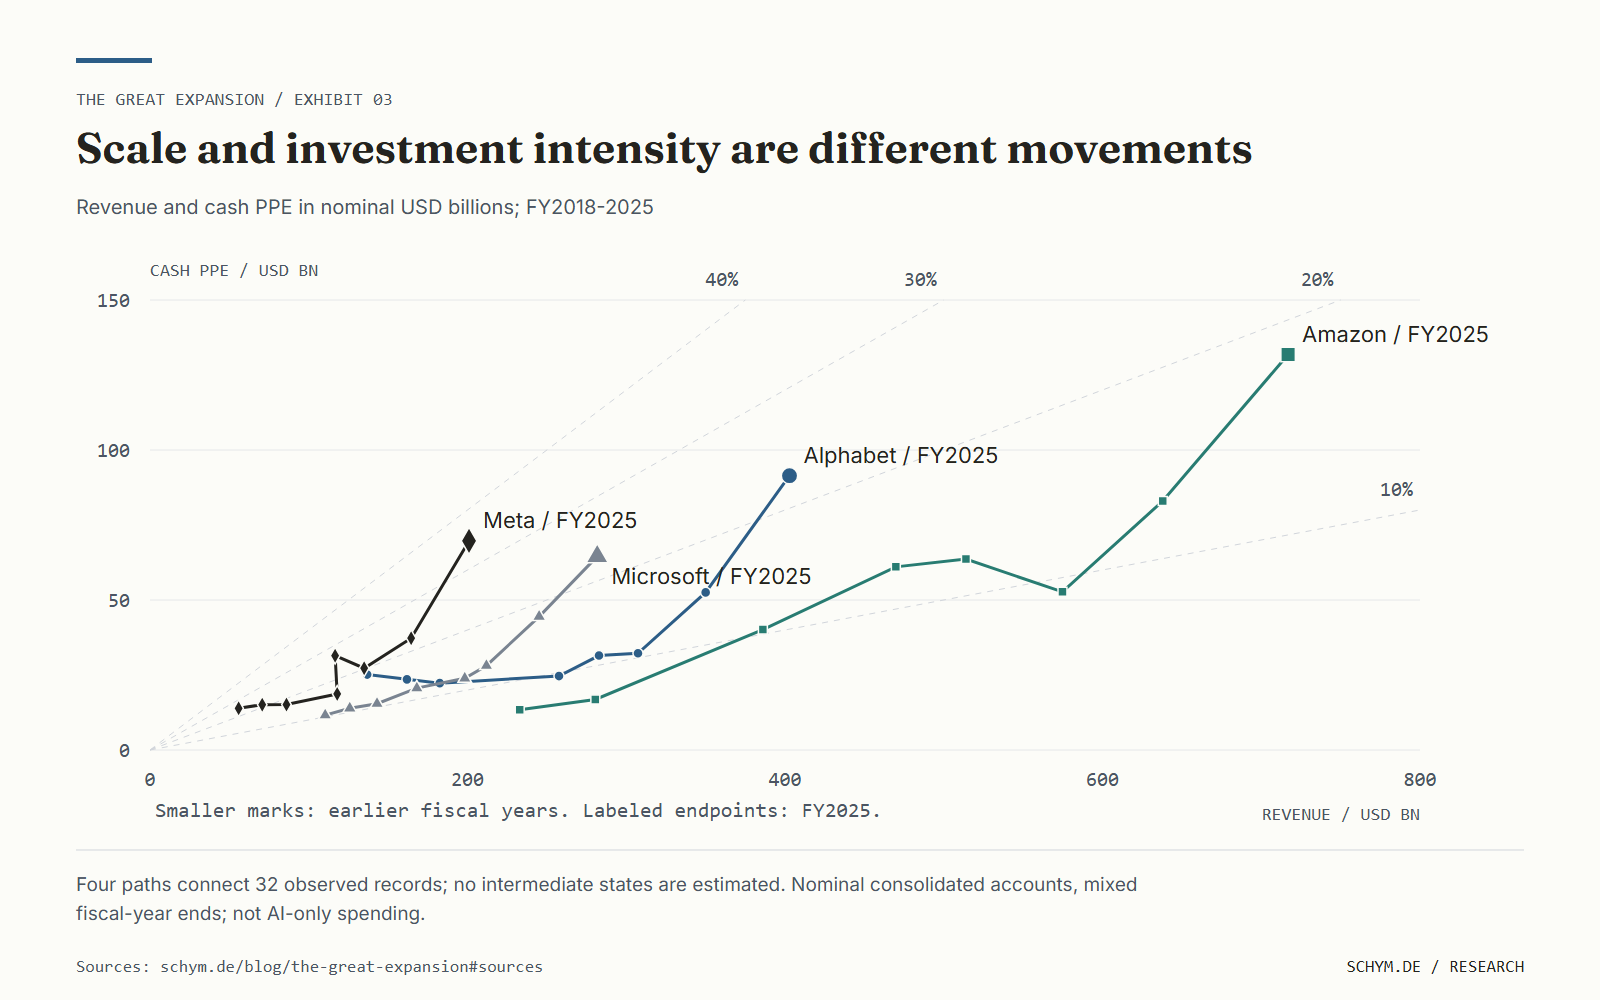
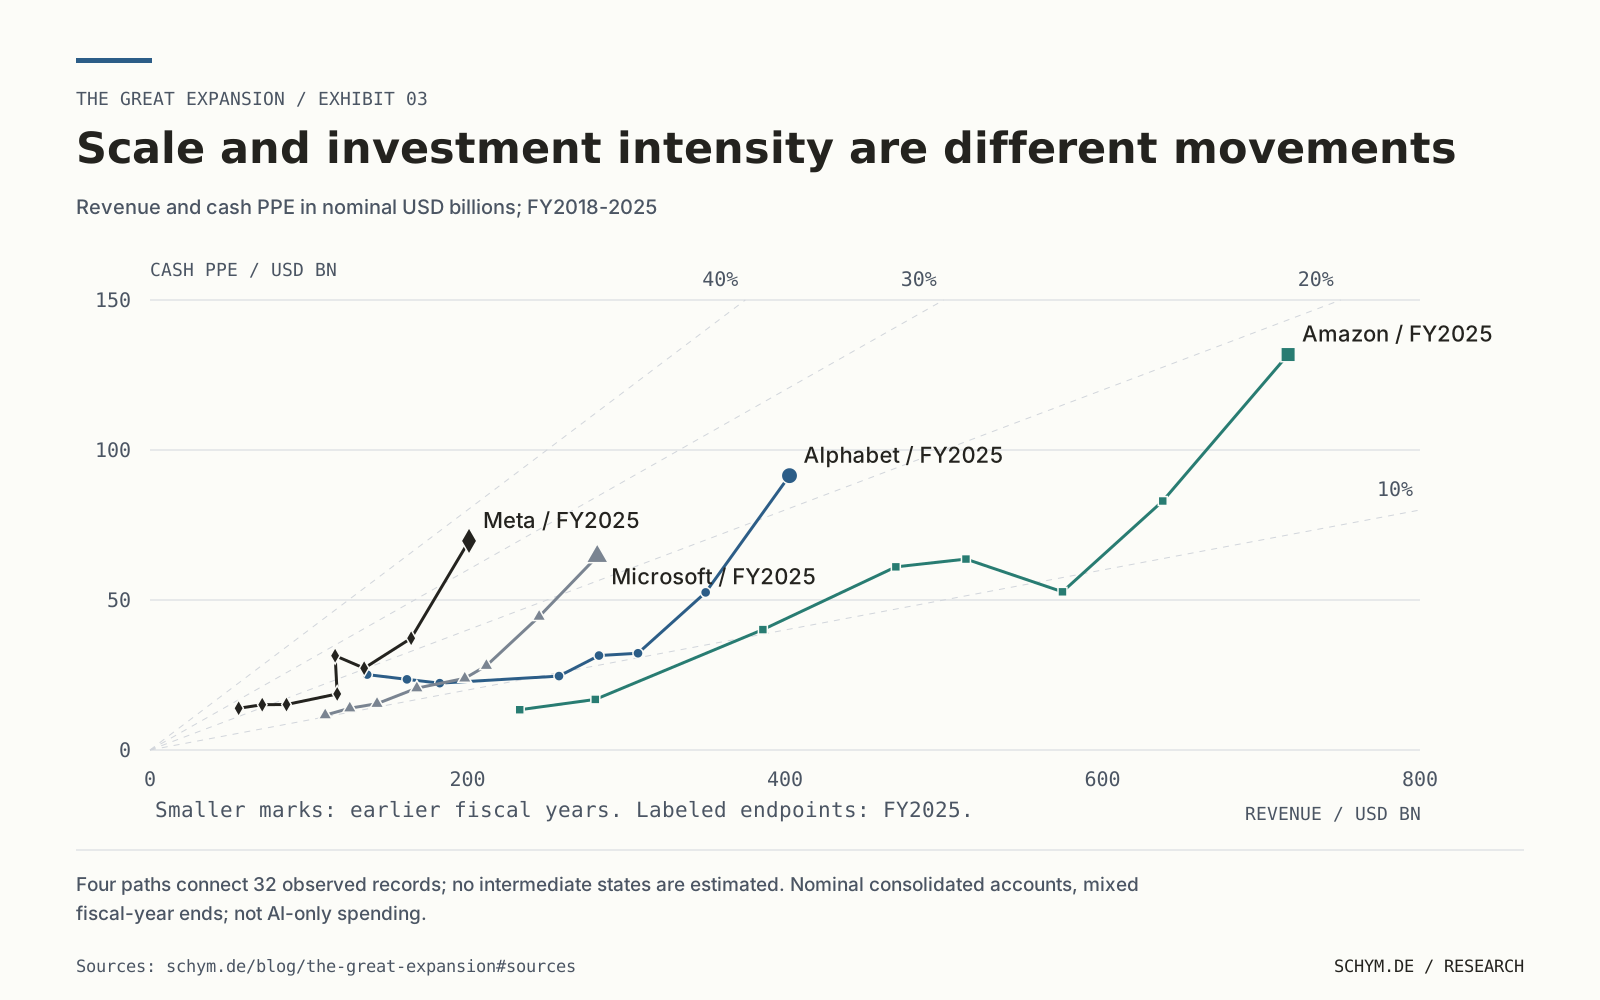
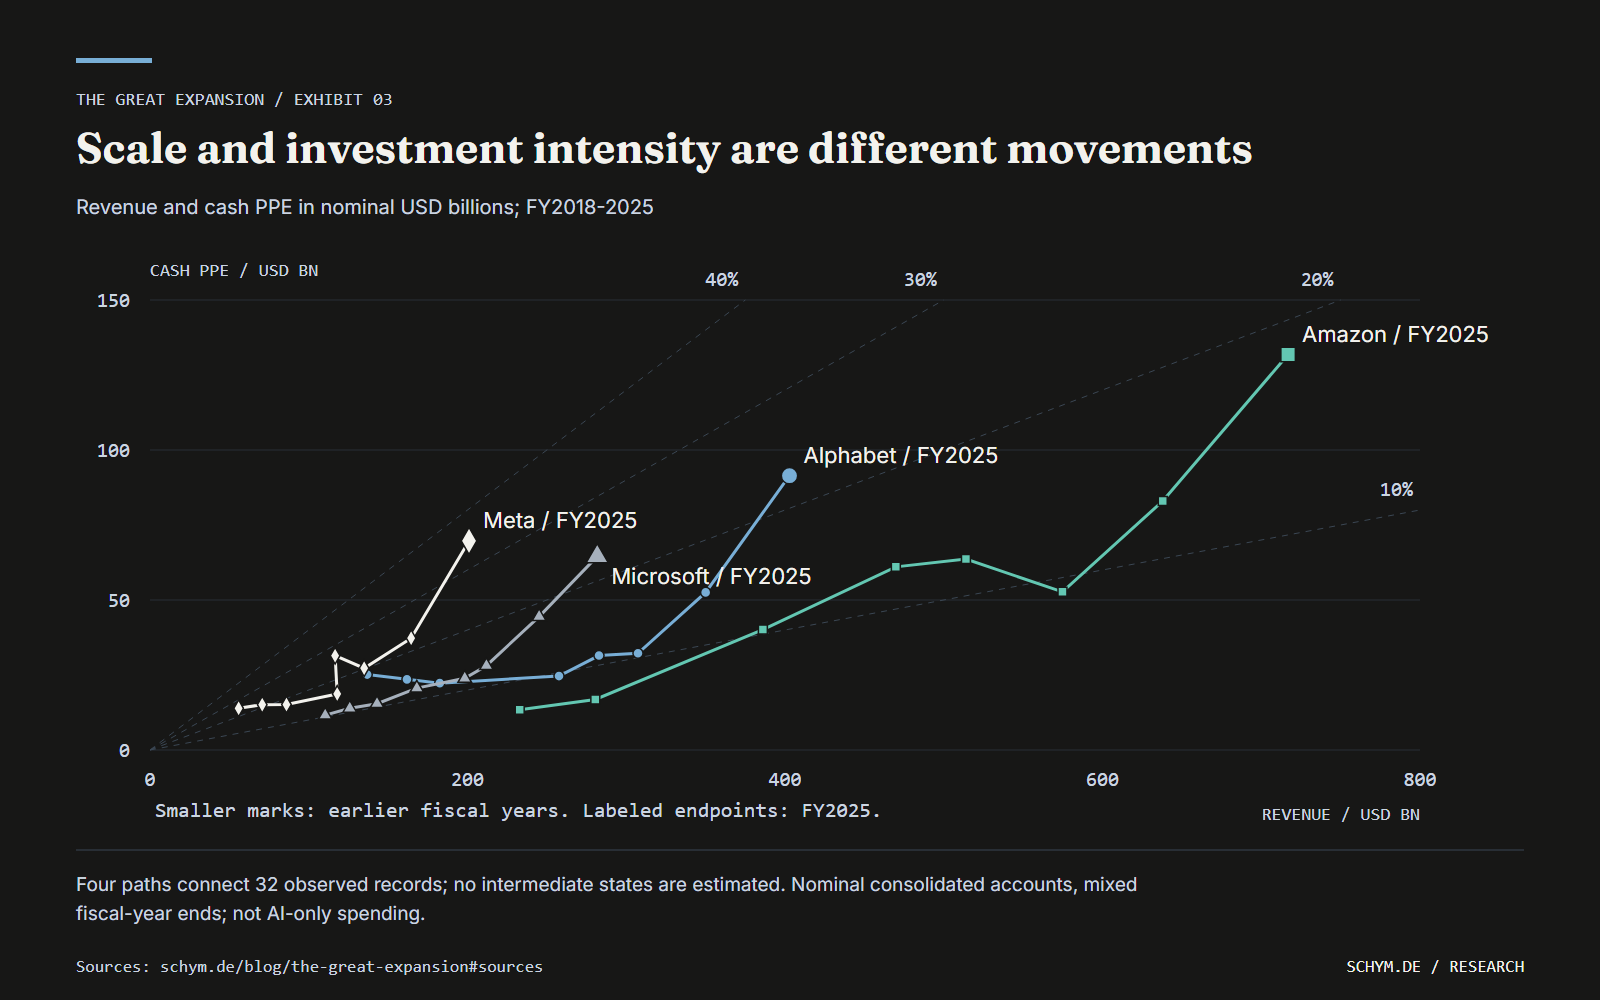
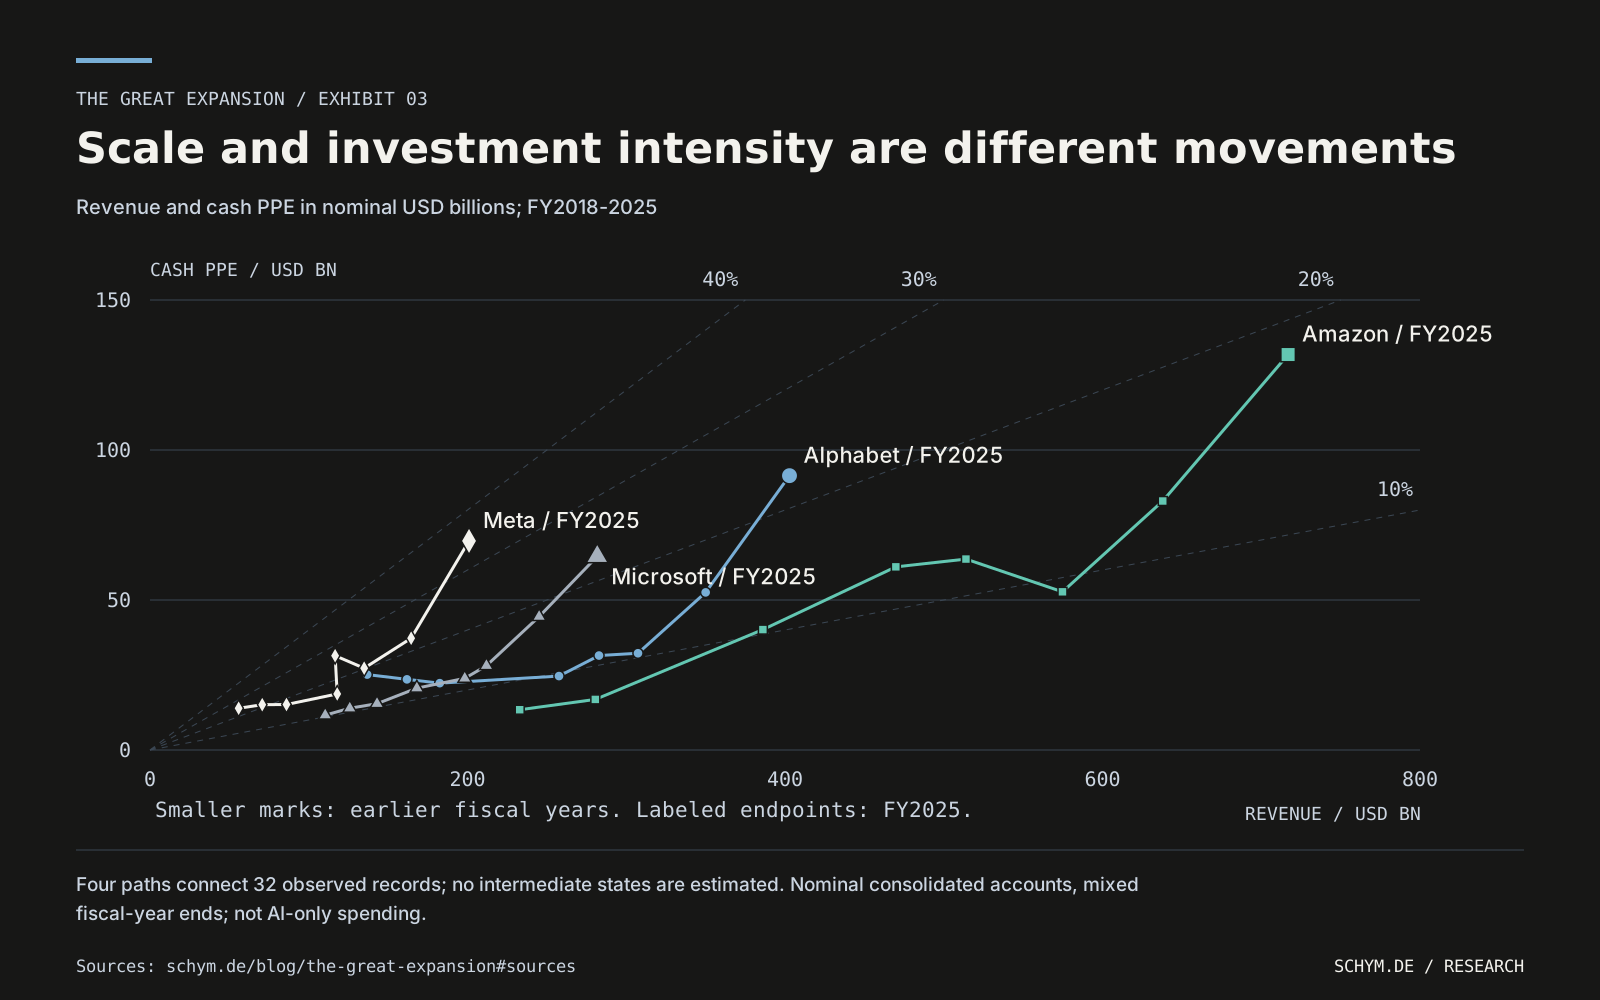
A nearly vertical movement means spending changed much more than revenue over that interval. Movement along a similar origin-ray means greater scale without a comparable change in the ratio. Neither direction identifies which assets serve AI. A ratio can rise because purchases increase, because revenue grows more slowly, or through both channels.
The accounting details are therefore part of the explanation. Meta's FY2025 filing distinguishes $69.691 billion of cash property purchases from $72.215 billion including finance-lease principal. This panel uses the former. Its earlier gross purchases were also reconciled against later presentations net of disposal proceeds. Without that reconciliation, a reporting change could appear as an economic change.
A higher cash-investment ratio is evidence of a different resource commitment. It is not an ownership score. To move from the accounts to the boundary, we must identify the activity, the operating entity and the responsibility that changed hands.
Sources SEC EDGAR / Meta; SEC EDGAR / Meta; SEC EDGAR / Alphabet; SEC EDGAR / Amazon; SEC EDGAR / Microsoft


04 / Follow the responsibility
04An interface, an operating business and an owner are not interchangeable.
Three boundaries make the distinction concrete. The production boundary concerns who creates and delivers the substantive output. The decision boundary concerns who selects the provider, routes the transaction or determines the sequence of action. The liability boundary concerns who owes a remedy or carries professional, contractual or regulatory responsibility when something fails. Ownership may connect these boundaries, but it does not make them identical.
OpenAI's Instant Checkout illustrates the separation. Its announcement retains the merchant's role in accepting orders, processing payments, fulfillment, returns and customer support. The interface can expand its influence over discovery and the transaction while the merchant remains the merchant. That can be economically important without establishing ownership of the retail business.
Amazon's completed One Medical acquisition is a different kind of event. Yet the entity structure still matters: 1Life provides administrative and management services, while affiliated physician-owned professional corporations deliver medical services. The record supports operating participation in primary care; it does not justify saying that Amazon owns the clinical practices.
Sources OpenAI; One Medical
The case instrument keeps 21 dated episodes across seven firms visible while you inspect the definition. Its five categories distinguish technology supply, task augmentation, intermediation, production and operating participation. These are ordered descriptions. They are neither equally spaced quantities nor a sequence that every business must follow.
The cases were chosen to make organizational contrasts inspectable. Their number and coverage differ by firm, so the display is not a league table of true corporate breadth. A firm with no qualifying selected episode under a particular rule may still have relevant activities outside this collection.
Sources OpenAI; One Medical; Isomorphic Labs / PR Newswire
Current audit result
8–9 of 21 selected episodes meet the threshold.
The denominator changes only with the firm and legacy controls. Raising the threshold changes eligibility; it does not erase launches, ambiguity or documented exits.Alphabet / Waymo OneStage 4 / Dec 5, 2018 / Commercial-service launch
On a narrow screen, inspect the same cases in the classification list below. Changing the threshold keeps every selected case on the record.
Persistent case
Waymo One
Waymo delivered a transportation service rather than only licensing driving technology.
- Firm
- Alphabet
- Event
- Dec 5, 2018 / Commercial-service launch
- Classification
- Stage 4
- Coding rationale
- Direct operating participation in passenger transport at the documented launch.
- Status at event
- Commercial service introduced to existing early riders; trained drivers initially supervised vehicles
- Limitation
- The launch does not establish continuous operation through 2026 or material economic scale.
The source supports this dated episode; it does not establish uninterrupted current operation.
Sources: Waymo 2018-12-05.
Portable result
Durable share linkEvery material selection travels in the page address.
Inspect exact values and sources
| Firm | Dated episode | Recorded event | Stage bounds | Legacy/core | Documented exit | Source |
|---|---|---|---|---|---|---|
| Alphabet | Waymo One | Dec 5, 2018 / Commercial-service launch | 4 | Yes | No exit recorded here | gov-01 |
| Alphabet | Stadia | Sep 29, 2022 / Exit announcement | 4 | Yes | Jan 18, 2023 | gov-03 |
| Microsoft | LinkedIn Talent and professional marketplace | Jun 30, 2026 / Annual-report observation | 2 | Yes | No exit recorded here | fin-microsoft-2026 |
| Microsoft | Xbox and first-party gaming | Jun 30, 2026 / Annual-report observation | 4 | Yes | No exit recorded here | fin-microsoft-2026 |
| Microsoft | Mixer | Jun 22, 2020 / Exit announcement | 4 | Yes | Jul 22, 2020 | gov-08 |
| Meta | Advertising placements | Dec 31, 2025 / Annual-report observation | 4 | Yes | No exit recorded here | fin-meta-2025 |
| Meta | Quest, VR software and content | Dec 31, 2025 / Annual-report observation | 4 | Yes | No exit recorded here | fin-meta-2025 |
| NVIDIA | DRIVE collaboration with Mercedes-Benz | Jun 23, 2020 / Partnership announcement | 0 | Yes | No exit recorded here | gov-10 |
| NVIDIA | DGX and Clara collaboration with Schrodinger | Apr 12, 2021 / Partnership announcement | 0 | Yes | No exit recorded here | gov-12 |
| Alphabet | Isomorphic Labs and Novartis | Jan 7, 2024 / Research collaboration signed | 3–4 | No | No exit recorded here | gov-02 |
| Amazon | One Medical | Feb 22, 2023 / Acquisition completed | 4 | No | No exit recorded here | gov-04 |
| Amazon | Zoox robotaxi service | Sep 10, 2025 / Public-service launch | 4 | No | No exit recorded here | gov-05 |
| Microsoft | Dragon Copilot | Mar 3, 2025 / Product announcement | 1 | No | No exit recorded here | gov-06 |
| NVIDIA | Isaac and GR00T robotics platform | Mar 18, 2024 / Platform announcement | 0 | No | No exit recorded here | gov-11 |
| OpenAI | Instant Checkout in ChatGPT | Sep 29, 2025 / Product launch | 2 | No | No exit recorded here | gov-14 |
| OpenAI | Astra for Law | Sep 17, 2026 / Limited-access launch | 1 | No | No exit recorded here | gov-15 |
| OpenAI | Original standalone Sora product | Dec 9, 2024 / Product launch | 3 | No | Apr 26, 2026 | gov-16 |
| Anthropic | Claude for Financial Services | Jul 15, 2025 / Product launch | 1 | No | No exit recorded here | gov-17 |
| Anthropic | Claude for Healthcare | Jan 11, 2026 / Product launch | 1 | No | No exit recorded here | gov-18 |
| Anthropic | Claude for Education | Apr 2, 2025 / Product launch | 1 | No | No exit recorded here | gov-19 |
| Anthropic | Claude in Juni Tutor Bot | Mar 14, 2023 / Partner use disclosed | 0 | No | No exit recorded here | gov-20 |
0: Supply / 1: Assist / 2: Mediate / 3: Produce / 4: Operate
InterpretationEach mark is a dated episode, not a unit of market share. Inspect what the source establishes, including the operating entity, rationale and limitation. An uncertain classification remains uncertain rather than being converted into a midpoint.
- Unit
- Dated selected episodes on five ordered participation categories
- Sources
19 reviewed records
- Waymo / 2018-12-05
- Google / 2022-09-29
- SEC EDGAR / Microsoft / 2026-07-29
- Xbox / Microsoft / 2020-06-22
- SEC EDGAR / Meta / 2026-01-29
- NVIDIA / 2020-06-23
- NVIDIA / 2021-04-12
- Isomorphic Labs / PR Newswire / 2024-01-07
- One Medical / 2023-02-22
- Zoox / 2025-09-10
- Microsoft / 2025-03-03
- NVIDIA / 2024-03-18
- OpenAI / 2025-09-29
- OpenAI / 2026-09-17
- OpenAI / 2024-12-09; discontinuation note 2026-04-26
- Anthropic / 2025-07-15; updated 2026-04-10
- Anthropic / 2026-01-11
- Anthropic / 2025-04-02
- Anthropic / 2023-03-14
- Exact values
- CSV
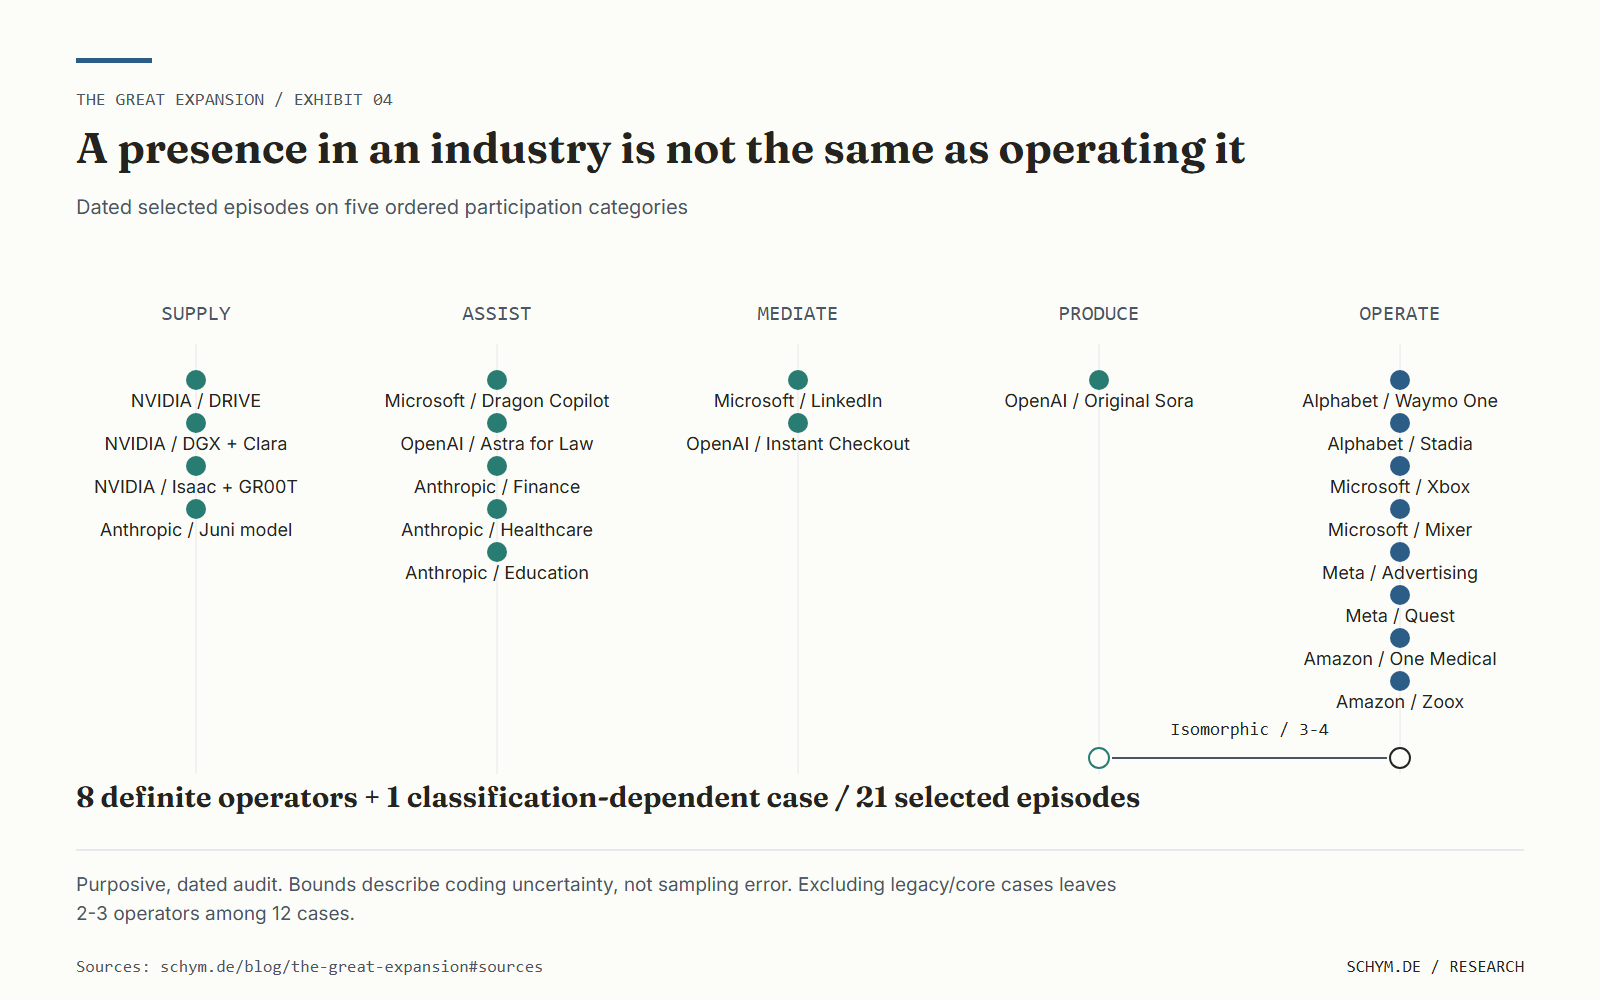
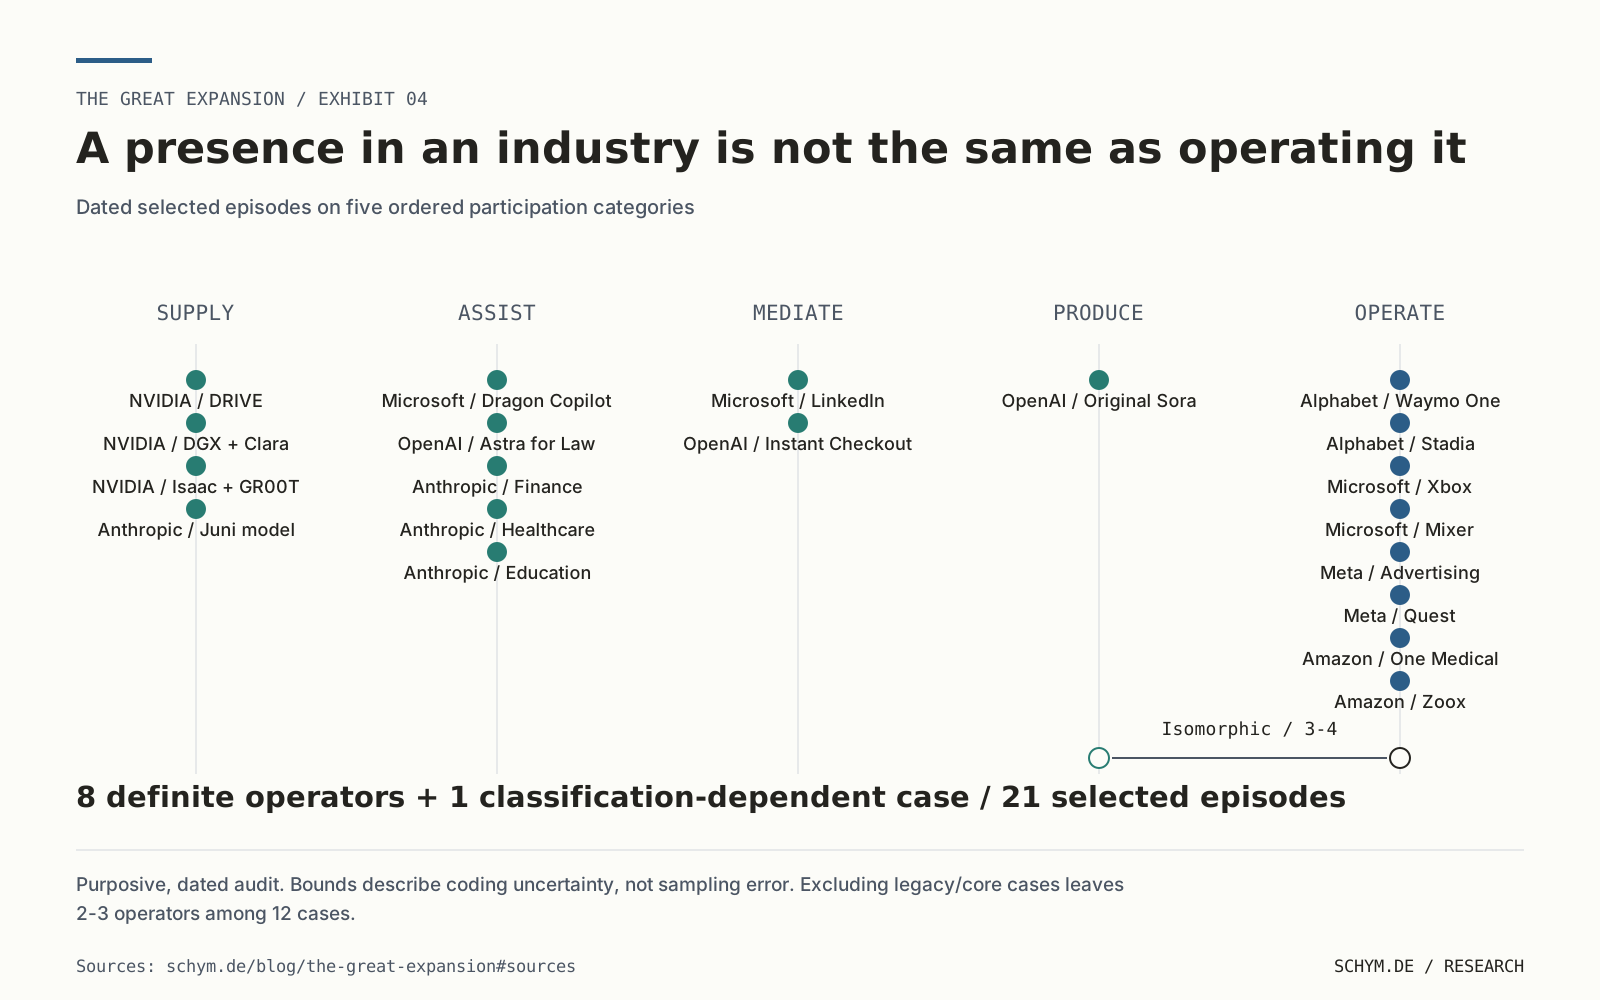
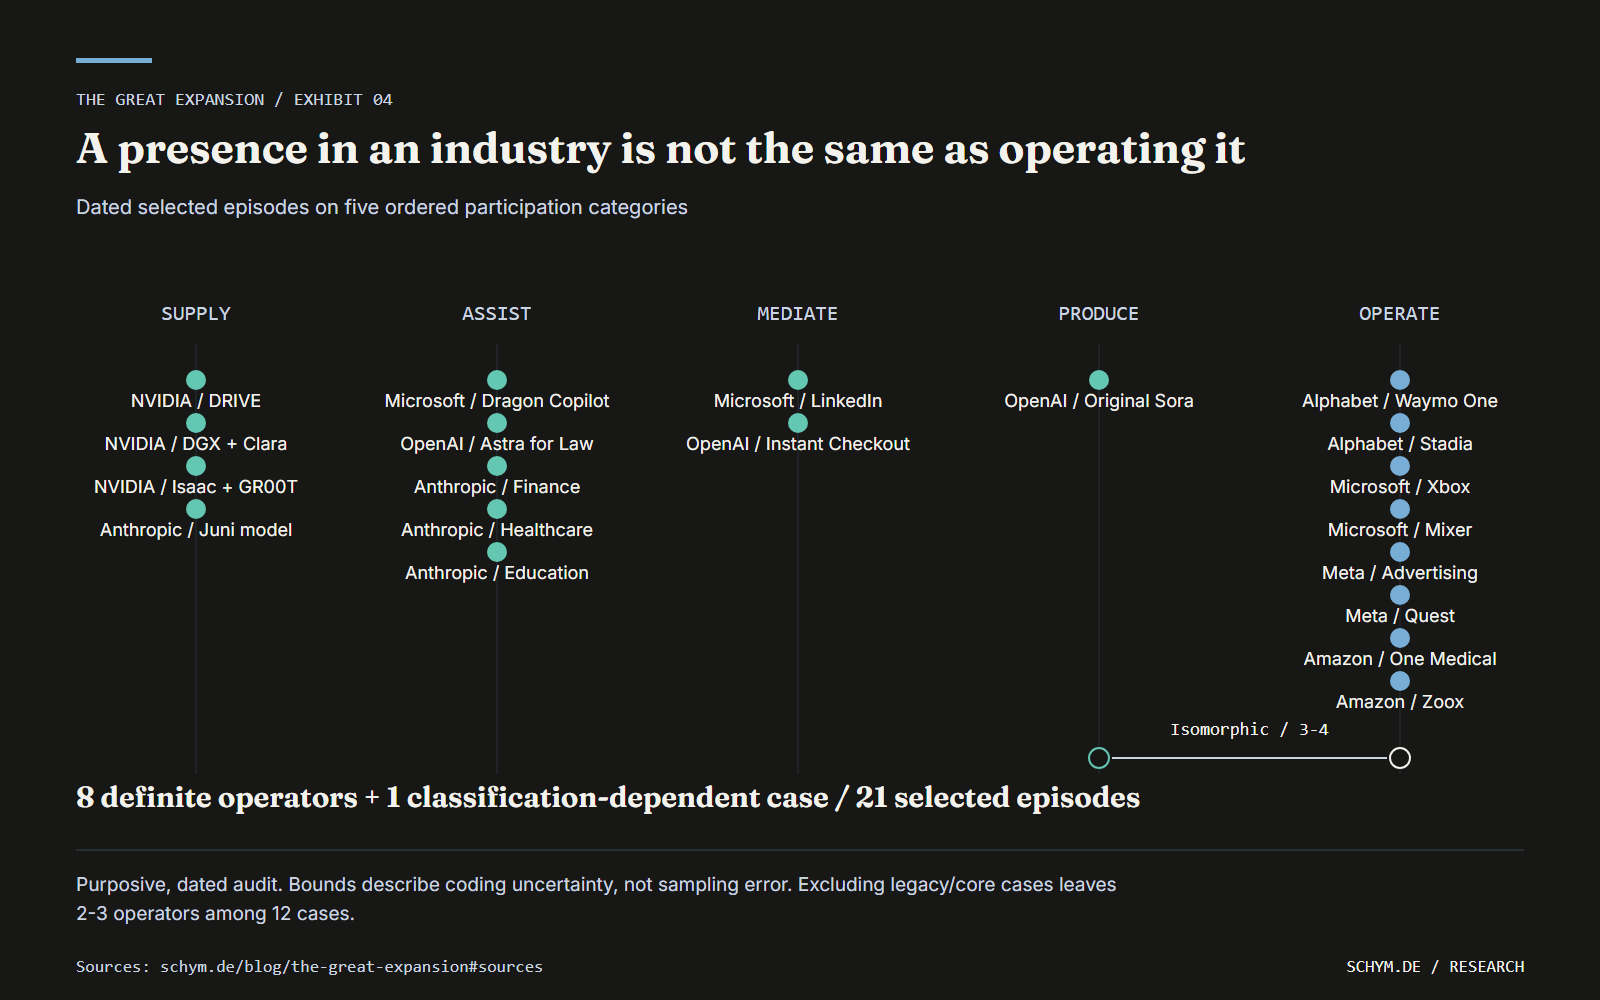
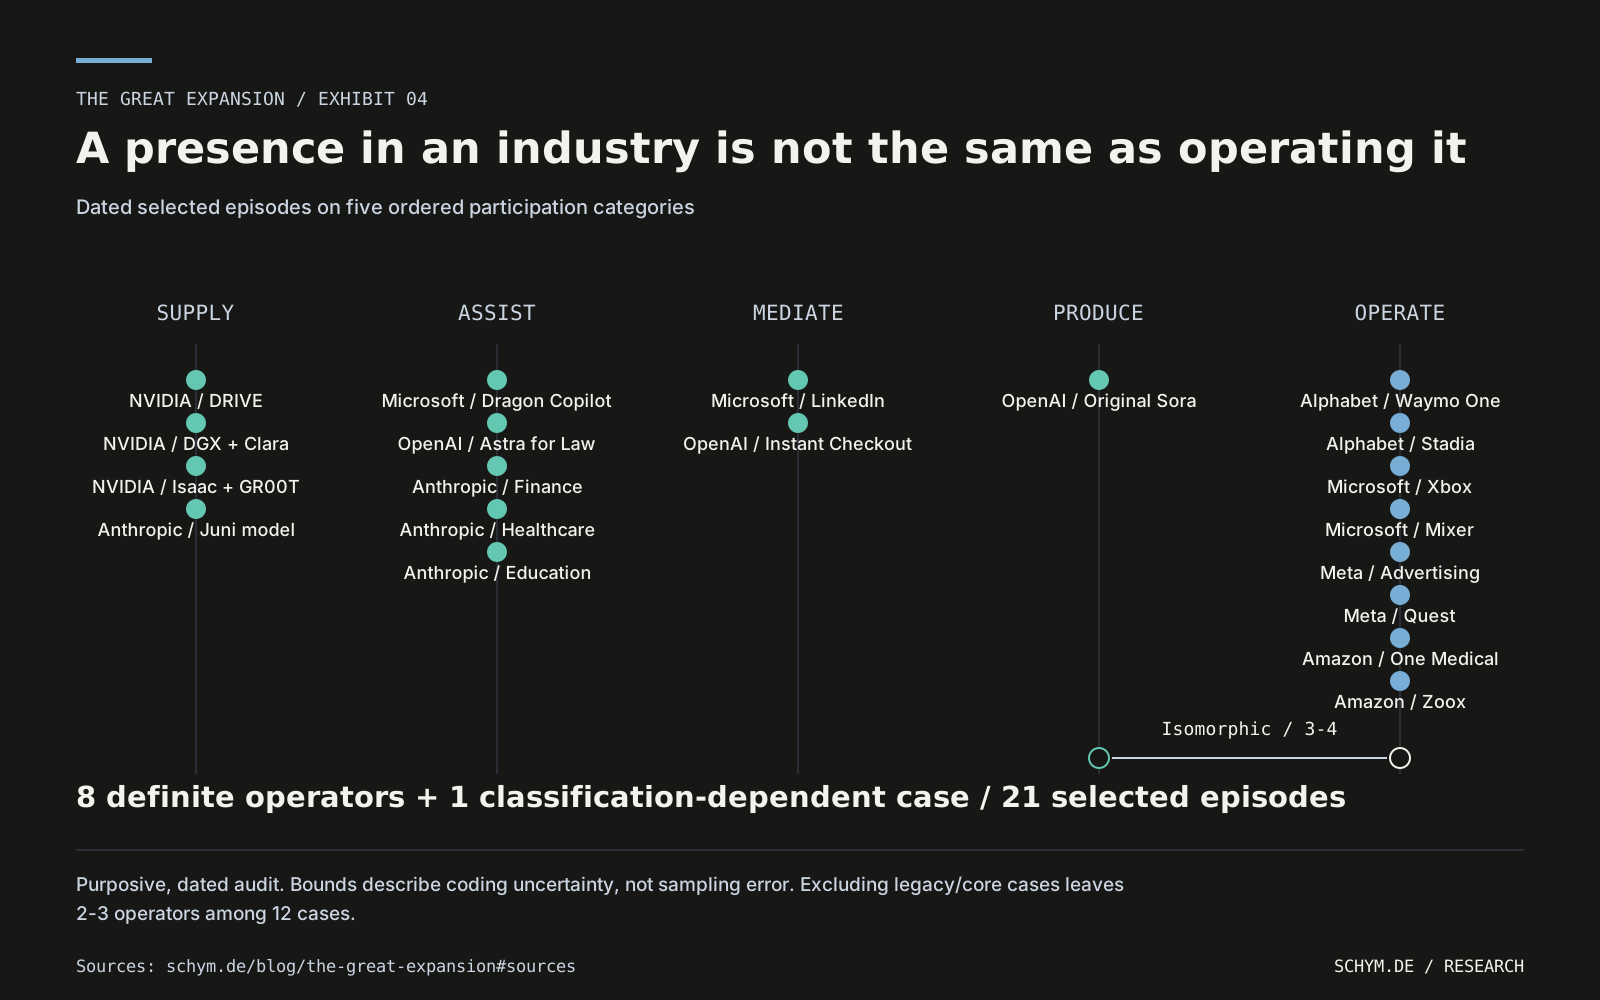
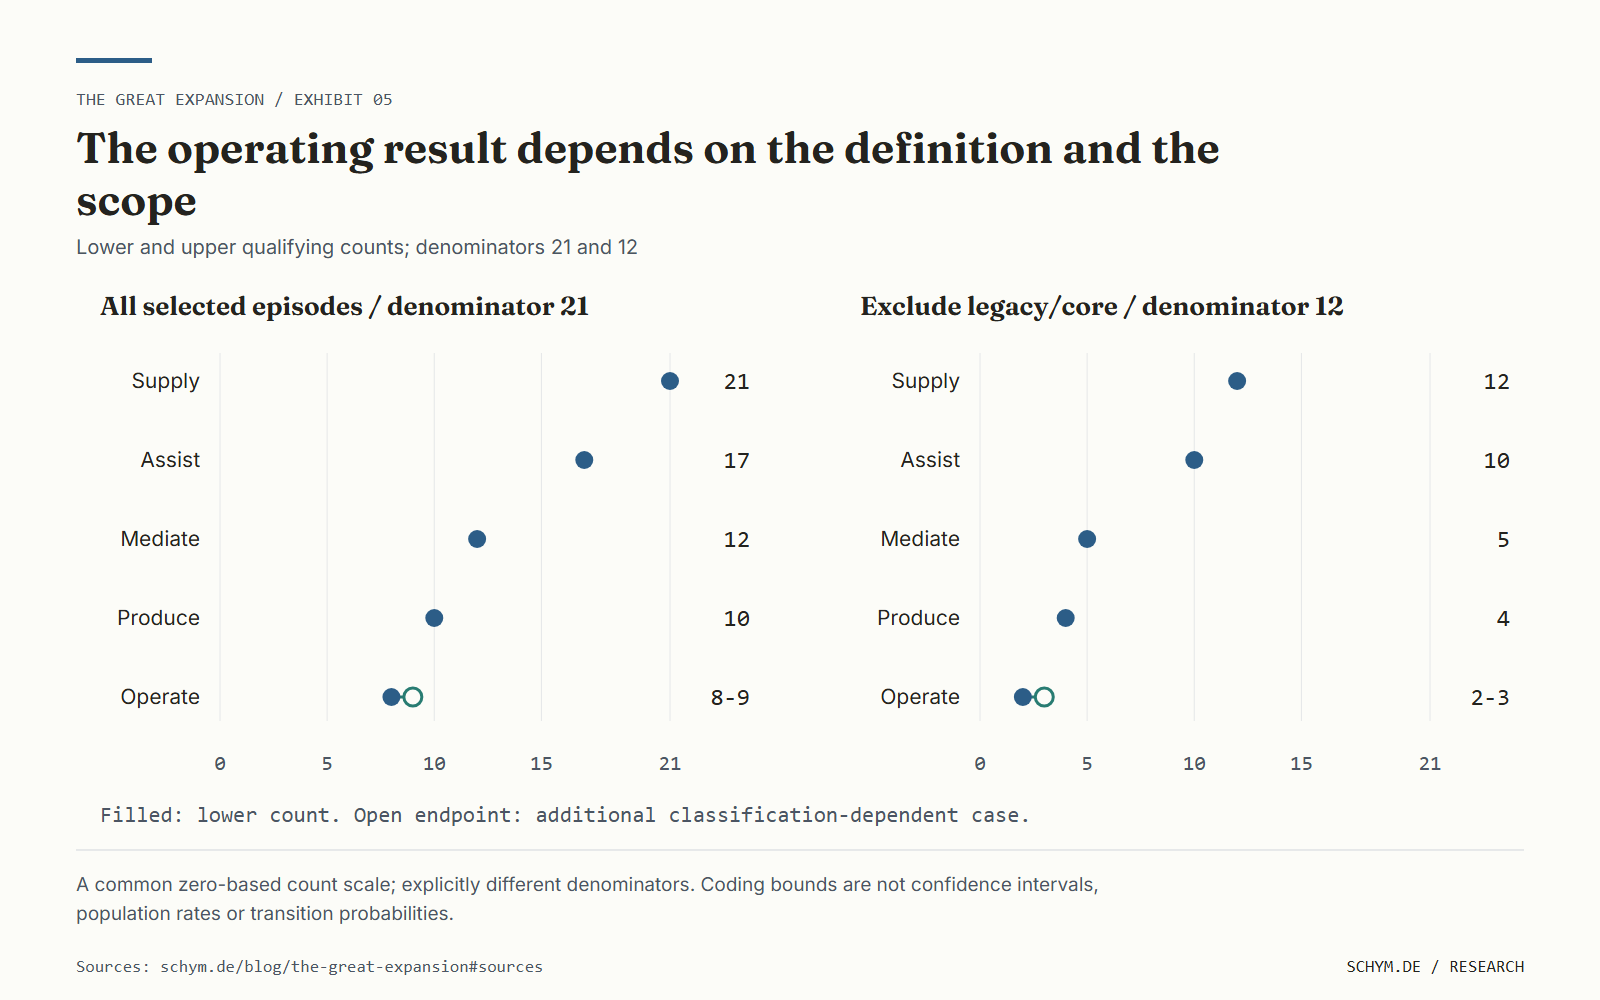
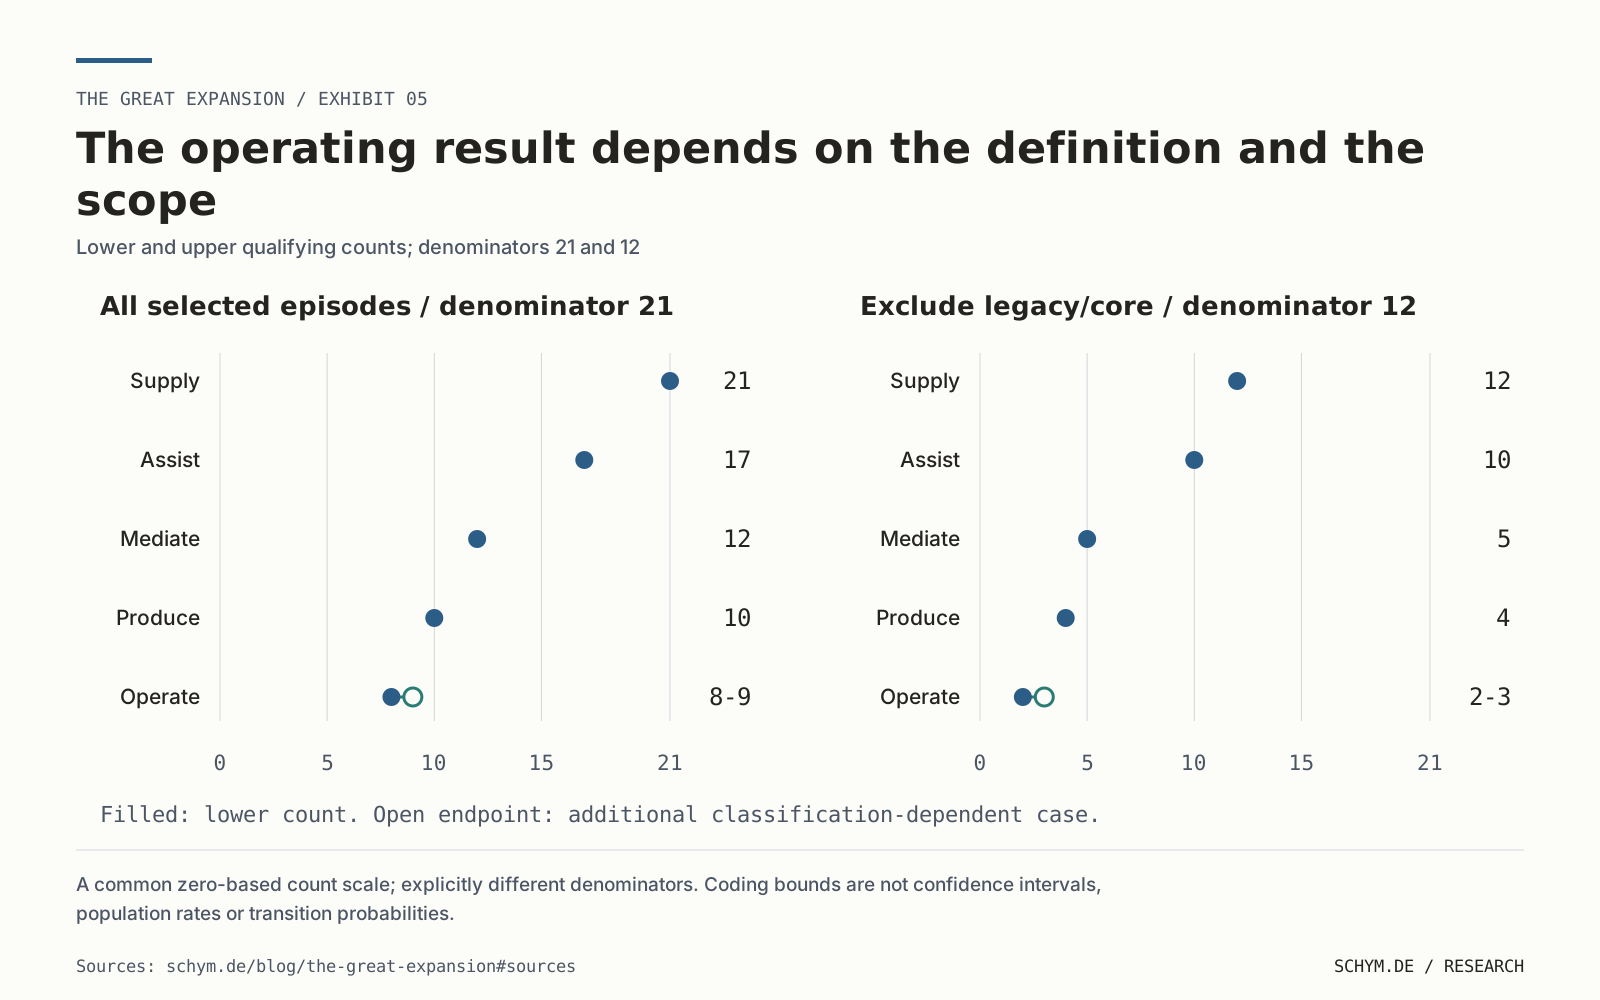
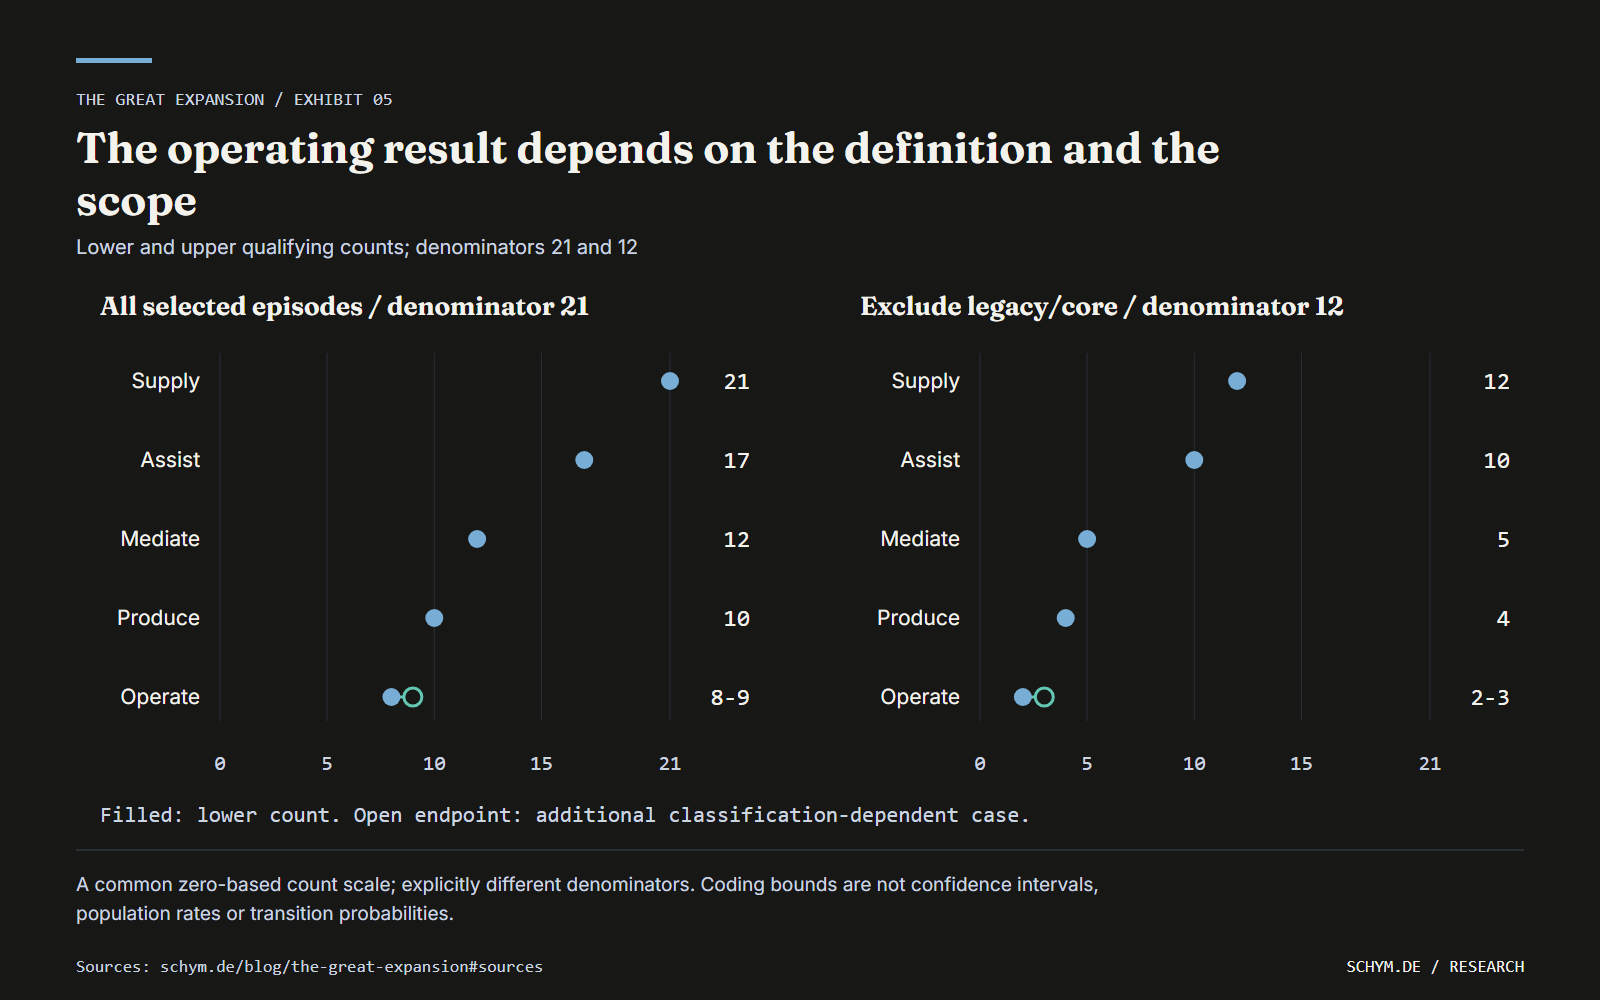
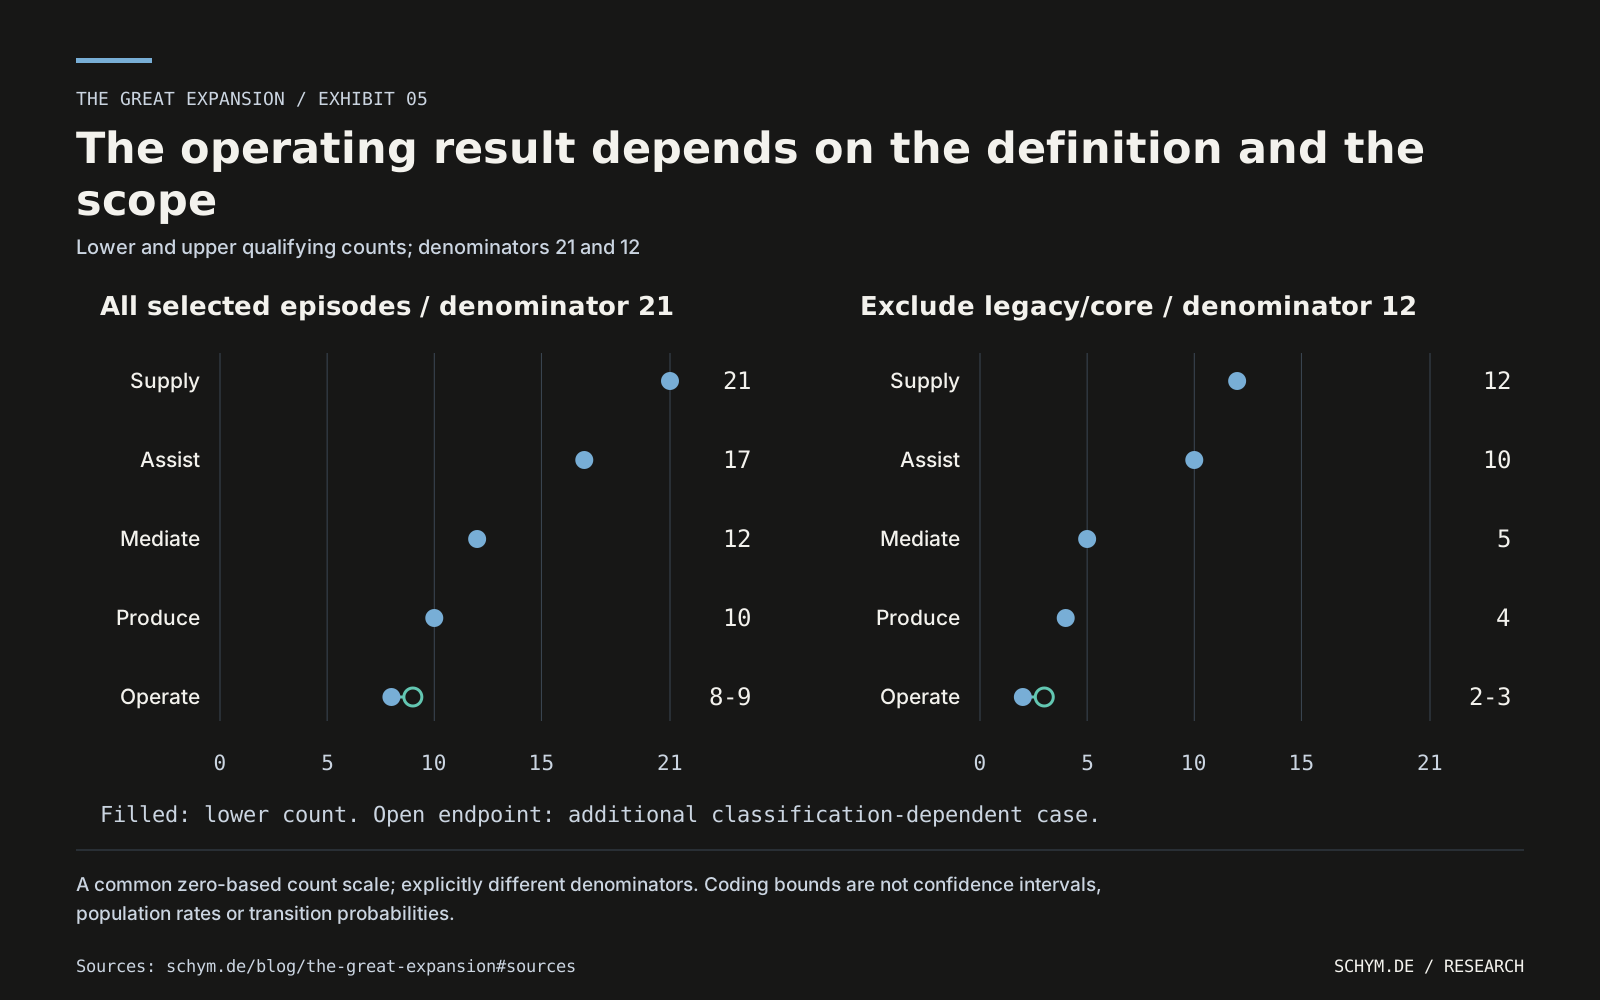
Under the strict operating-participation rule, eight episodes clearly qualify and a ninth may qualify. Isomorphic Labs' collaboration with Novartis remains bounded between direct research production and industry operation. The range records a classification question, not a statistical confidence interval.
The denominator changes when legacy and core activities are excluded. Removing nine such episodes leaves twelve selected cases, of which two to three meet the strict threshold. Tightening a definition and changing a sample are different operations. The following comparison keeps both visible.
Sources Isomorphic Labs / PR Newswire; One Medical; OpenAI
At the operating threshold, the count is 8–9 of 21 across all selected episodes and 2–3 of 12 after excluding legacy/core cases.
Filled dots are lower counts; a hollow endpoint marks a different upper count. Hover or tap a row, or use arrow keys, Home and End while the chart is focused.
The segments are classification bounds, not confidence intervals or midpoint estimates. The 2–3 operating cases in the nonlegacy scope reflect one unresolved classification. Both denominators describe purposively selected records; the results are not population shares.
Inspect exact values and sources
| Case scope | Participation threshold | Qualifying cases | Denominator |
|---|---|---|---|
| All selected episodes | 0 / Technology supplier | 21 | 21 |
| All selected episodes | 1 / Task augmentation | 17 | 21 |
| All selected episodes | 2 / Intermediation | 12 | 21 |
| All selected episodes | 3 / Production | 10 | 21 |
| All selected episodes | 4 / Operating participation | 8–9 | 21 |
| Excluding legacy/core | 0 / Technology supplier | 12 | 12 |
| Excluding legacy/core | 1 / Task augmentation | 10 | 12 |
| Excluding legacy/core | 2 / Intermediation | 5 | 12 |
| Excluding legacy/core | 3 / Production | 4 | 12 |
| Excluding legacy/core | 4 / Operating participation | 2–3 | 12 |
InterpretationThe changing count shows how the stated rule acts on this audit. It does not estimate the share of the economy owned by AI firms or the probability that an AI supplier will become an operator.
- Unit
- Lower and upper qualifying counts; denominators 21 and 12
- Sources
19 reviewed records
- Waymo / 2018-12-05
- Google / 2022-09-29
- SEC EDGAR / Microsoft / 2026-07-29
- Xbox / Microsoft / 2020-06-22
- SEC EDGAR / Meta / 2026-01-29
- NVIDIA / 2020-06-23
- NVIDIA / 2021-04-12
- Isomorphic Labs / PR Newswire / 2024-01-07
- One Medical / 2023-02-22
- Zoox / 2025-09-10
- Microsoft / 2025-03-03
- NVIDIA / 2024-03-18
- OpenAI / 2025-09-29
- OpenAI / 2026-09-17
- OpenAI / 2024-12-09; discontinuation note 2026-04-26
- Anthropic / 2025-07-15; updated 2026-04-10
- Anthropic / 2026-01-11
- Anthropic / 2025-04-02
- Anthropic / 2023-03-14
- Exact values
- CSV
05 / Explain the organizational choice
05The strongest case for ownership is often a problem of adaptation.
A chip, compiler, training system and model may need repeated adjustment together. When performance depends on that co-design, a complete contract for every future contingency is difficult to write. A party that commits an asset to one relationship may also lose attractive outside options. Common ownership can reduce repeated bargaining and make coordinated adaptation easier.
This is a stronger integration argument than the observation that a technology has many applications. It identifies a problem that market exchange may solve poorly. But it still leaves a comparison to make. Long-term procurement, joint development, information rights, multi-sourcing and repeated relationships can provide safeguards without turning one party into a subsidiary.
Sources University of Chicago Press; University of Chicago Press / Harvard DASH; MIT Press / MIT Sloan; Federal Trade Commission
Ownership also changes incentives. An independent specialist can retain a return on effort, serve several customers and develop knowledge that a parent cannot easily replace. Acquisition may improve coordination while weakening some of the incentives that made the specialist valuable. Grossman and Hart, and Hart and Moore, make that trade-off central to the allocation of residual control.
The FTC's study of selected cloud-AI partnerships is useful because it preserves different contractual features instead of compressing them into a single ownership score. Equity, cloud commitments, information access and consultation rights can create influence and dependence in different ways. Formal independence does not establish easy substitutability; contractual influence does not automatically establish legal integration.
Sources University of Chicago Press / Harvard DASH; University of Chicago Press / Harvard DASH; MIT Press / MIT Sloan; Federal Trade Commission
The record starts with internal TPU use in 2015, before the dense partnership, procurement and product milestones of 2023–2026.
Hover or tap a numbered milestone. With the chronology focused, use arrow keys, Home or End. The labels below preserve every title and source link.
- 01TPU v1 used internally2015 · year precision · AlphabetSource: gov-21
- 02Cloud TPU offered externally2018 · year precision · AlphabetSource: gov-21
- 03Microsoft and OpenAI compute partnershipJul 22, 2019 · day precision · MicrosoftSource: gov-23
- 04Inferentia-powered Inf1 launchesDec 3, 2019 · day precision · AmazonSource: gov-22
- 05Anthropic selects Google CloudFeb 3, 2023 · day precision · AnthropicSource: gov-24
- 06Claude launches through chat and APIMar 14, 2023 · day precision · AnthropicSource: gov-20
- 07MTIA first generation disclosedMay 18, 2023 · day precision · MetaSource: gov-25
- 08Amazon and Anthropic form allianceSep 25, 2023 · day precision · AnthropicSource: gov-26
- 09Maia 100 unveiledNov 15, 2023 · day precision · MicrosoftSource: gov-27
- 10OpenAI expands agent toolingMar 11, 2025 · day precision · OpenAISource: gov-28
- 11Claude Code reaches general availabilityMay 22, 2025 · day precision · AnthropicSource: gov-29
- 12OpenAI and Broadcom plan acceleratorsOct 13, 2025 · day precision · OpenAISource: gov-31
- 13Anthropic expands planned TPU accessOct 23, 2025 · day precision · AnthropicSource: gov-30
- 14Anthropic announces facility programNov 12, 2025 · day precision · AnthropicSource: gov-32
- 15NVIDIA reports contracted manufacturingJan 25, 2026 · day precision · NVIDIASource: fin-nvidia-2026
- 16Meta reports MTIA deploymentMar 11, 2026 · day precision · MetaSource: gov-33
- 17Anthropic expands AWS compute agreementApr 20, 2026 · day precision · AnthropicSource: gov-34
The two whole-year bands show recorded precision only. They are not January observations, operating durations or state transitions. Lanes resolve collisions and do not encode an ownership network.
Inspect exact values and sources
| Recorded date | Firm | Milestone | Relationship | Status | Source |
|---|---|---|---|---|---|
| 2015 | Alphabet | TPU v1 used internally | First-party chip design and use | Retrospectively documented operation | gov-21 |
| 2018 | Alphabet | Cloud TPU offered externally | First-party capability supplied through cloud | Retrospectively documented launch | gov-21 |
| Jul 22, 2019 | Microsoft | Microsoft and OpenAI compute partnership | Investment, procurement and co-development | Agreement announced | gov-23 |
| Dec 3, 2019 | Amazon | Inferentia-powered Inf1 launches | First-party accelerator design and cloud supply | Operational launch | gov-22 |
| Feb 3, 2023 | Anthropic | Anthropic selects Google Cloud | Cloud procurement and co-design | Agreement announced | gov-24 |
| Mar 14, 2023 | Anthropic | Claude launches through chat and API | Model, application and distribution | Product launch | gov-20 |
| May 18, 2023 | Meta | MTIA first generation disclosed | First-party accelerator design | Development announcement | gov-25 |
| Sep 25, 2023 | Anthropic | Amazon and Anthropic form alliance | Minority investment, primary cloud and co-design | Agreement announced | gov-26 |
| Nov 15, 2023 | Microsoft | Maia 100 unveiled | First-party chip and system design | Announcement; deployment prospective | gov-27 |
| Mar 11, 2025 | OpenAI | OpenAI expands agent tooling | Developer-platform and workflow tooling | Product launch | gov-28 |
| May 22, 2025 | Anthropic | Claude Code reaches general availability | Developer workflow application | Generally available | gov-29 |
| Oct 13, 2025 | OpenAI | OpenAI and Broadcom plan accelerators | Co-design and future procurement | Announced; commissioning not verified | gov-31 |
| Oct 23, 2025 | Anthropic | Anthropic expands planned TPU access | Procurement and capacity commitment | Announced; future capacity | gov-30 |
| Nov 12, 2025 | Anthropic | Anthropic announces facility program | Dedicated capacity and partner construction | Announced; operating title unresolved | gov-32 |
| Jan 25, 2026 | NVIDIA | NVIDIA reports contracted manufacturing | Fabless design with external manufacturing | FY2026 filing observation | fin-nvidia-2026 |
| Mar 11, 2026 | Meta | Meta reports MTIA deployment | First-party design and internal operation | Operational disclosure; later generations prospective | gov-33 |
| Apr 20, 2026 | Anthropic | Anthropic expands AWS compute agreement | Procurement and investment dependence | Current use plus future commitments | gov-34 |
InterpretationRead the date together with the source's relationship and status. A first-party design, a minority investment, a capacity agreement and an operating disclosure are different observations. Announced capacity remains announced until operation is documented.
- Unit
- Recorded milestone dates; original relationship and status wording
- Sources
16 reviewed records
- Google Cloud / 2024-07-31
- Microsoft / 2019-07-22
- AWS / 2019-12-03
- Anthropic / 2023-02-03
- Anthropic / 2023-03-14
- Meta AI / 2023-05-18
- Anthropic / 2023-09-25
- Microsoft / 2023-11-15
- OpenAI / 2025-03-11
- Anthropic / 2025-05-22
- OpenAI / 2025-10-13
- Anthropic / 2025-10-23
- Anthropic / 2025-11-12
- SEC EDGAR / NVIDIA / 2026-02-25
- Meta / 2026-03-11
- Anthropic / 2026-04-20
- Exact values
- CSV
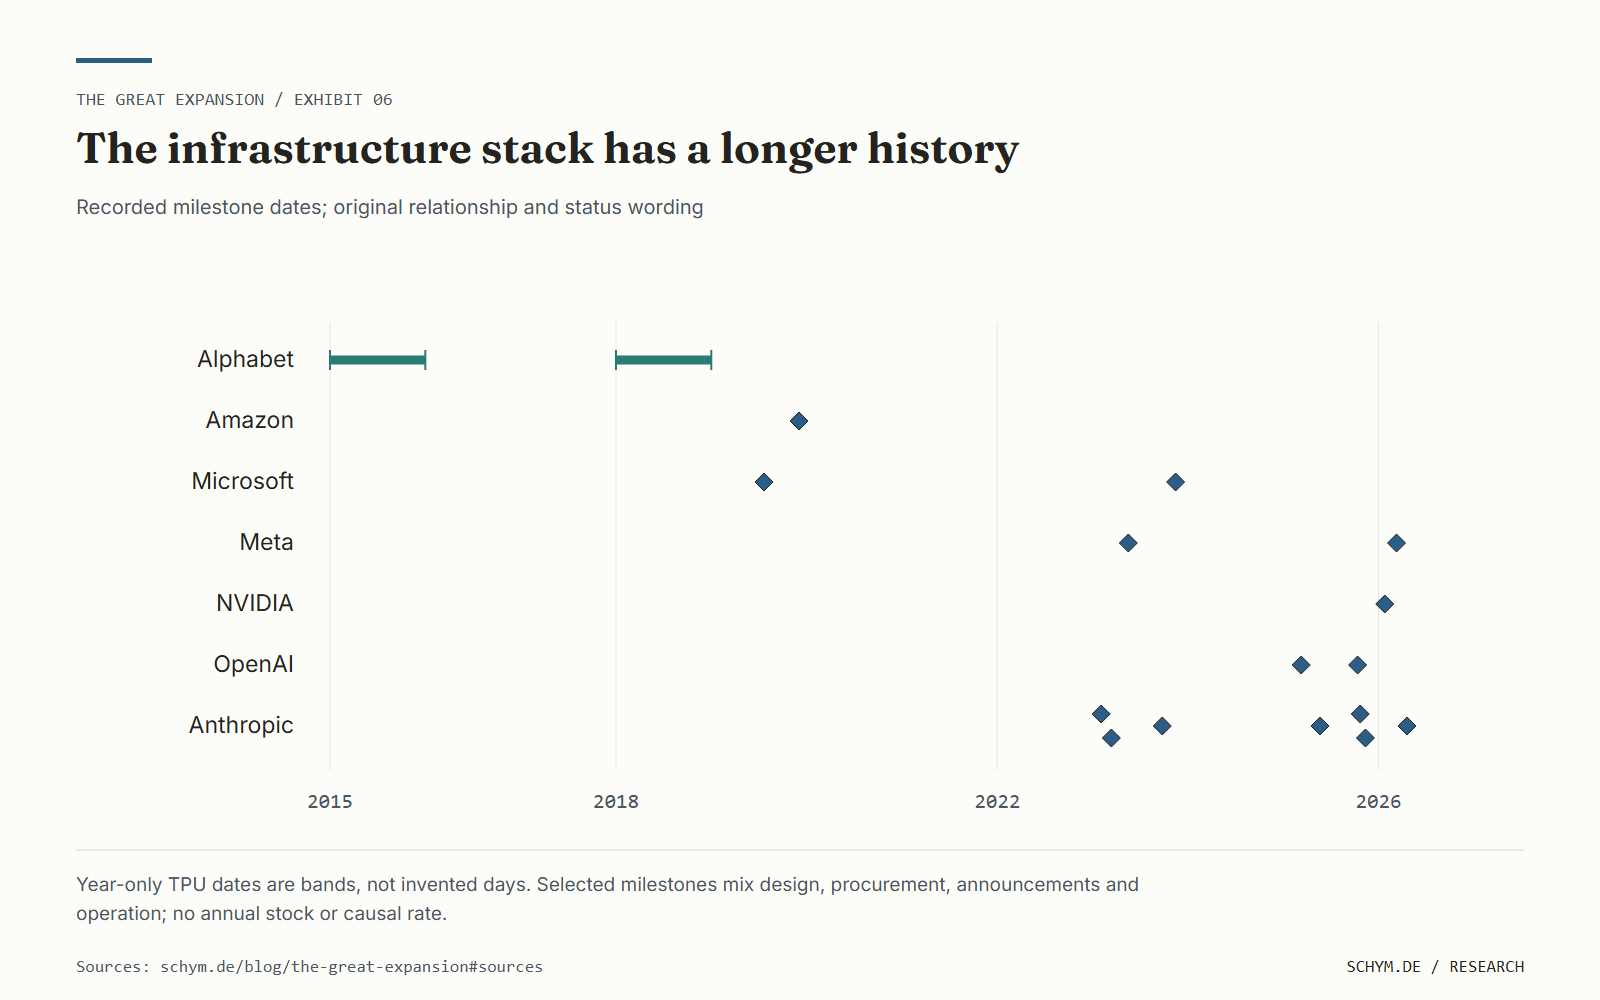
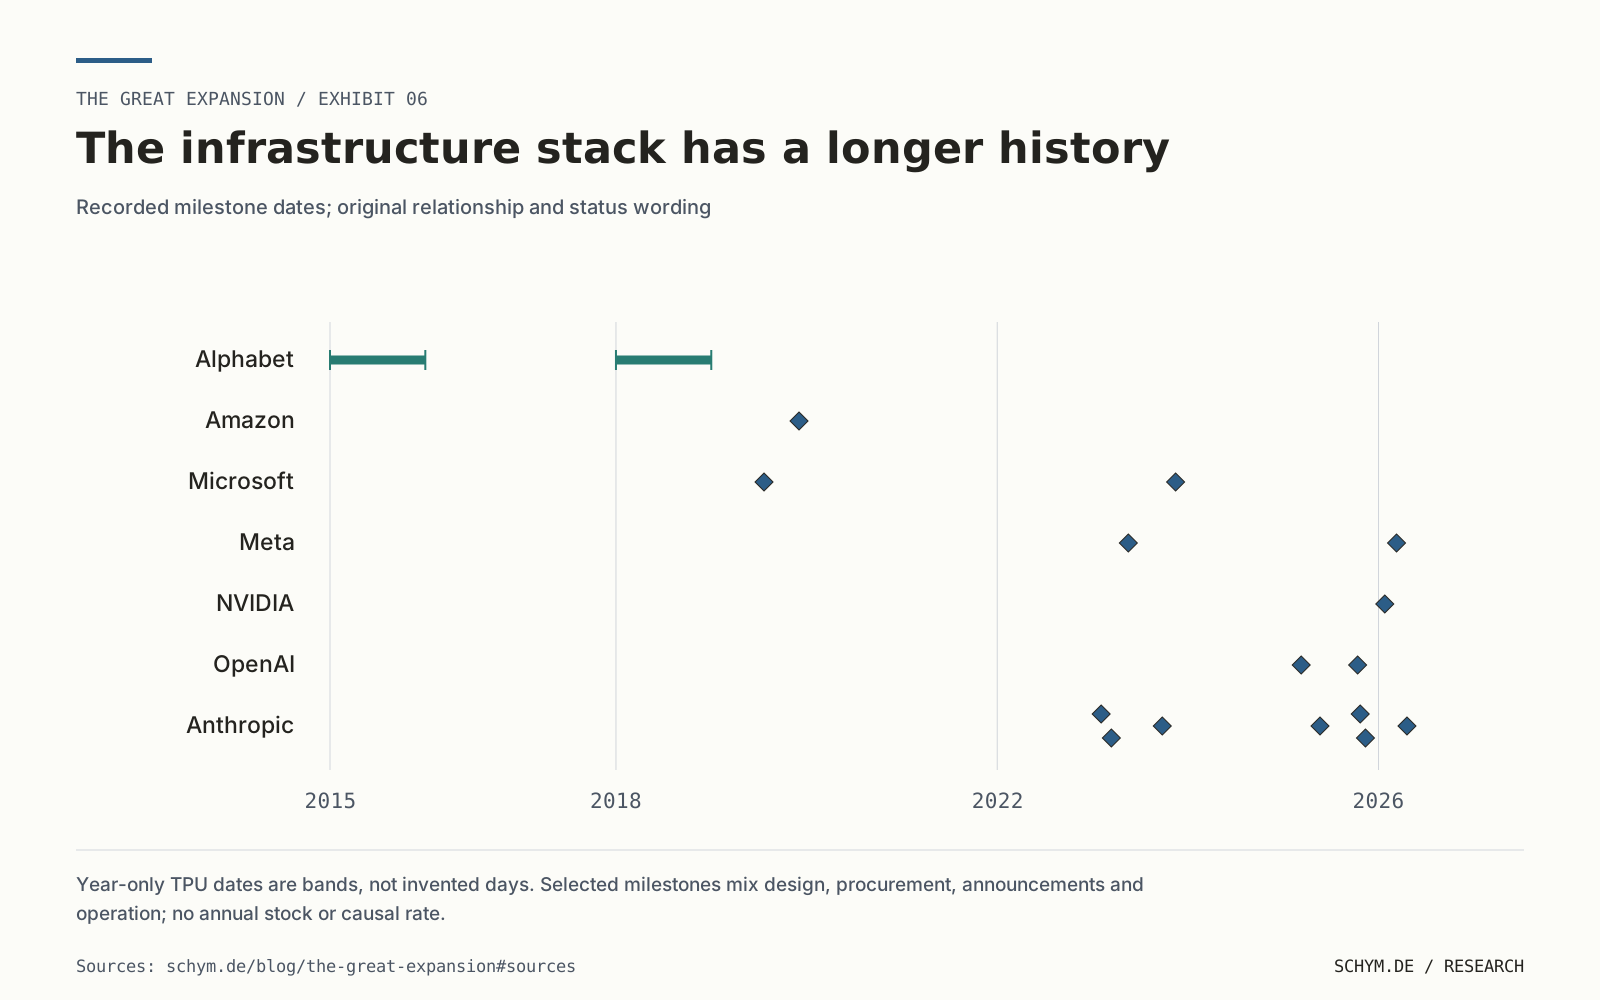
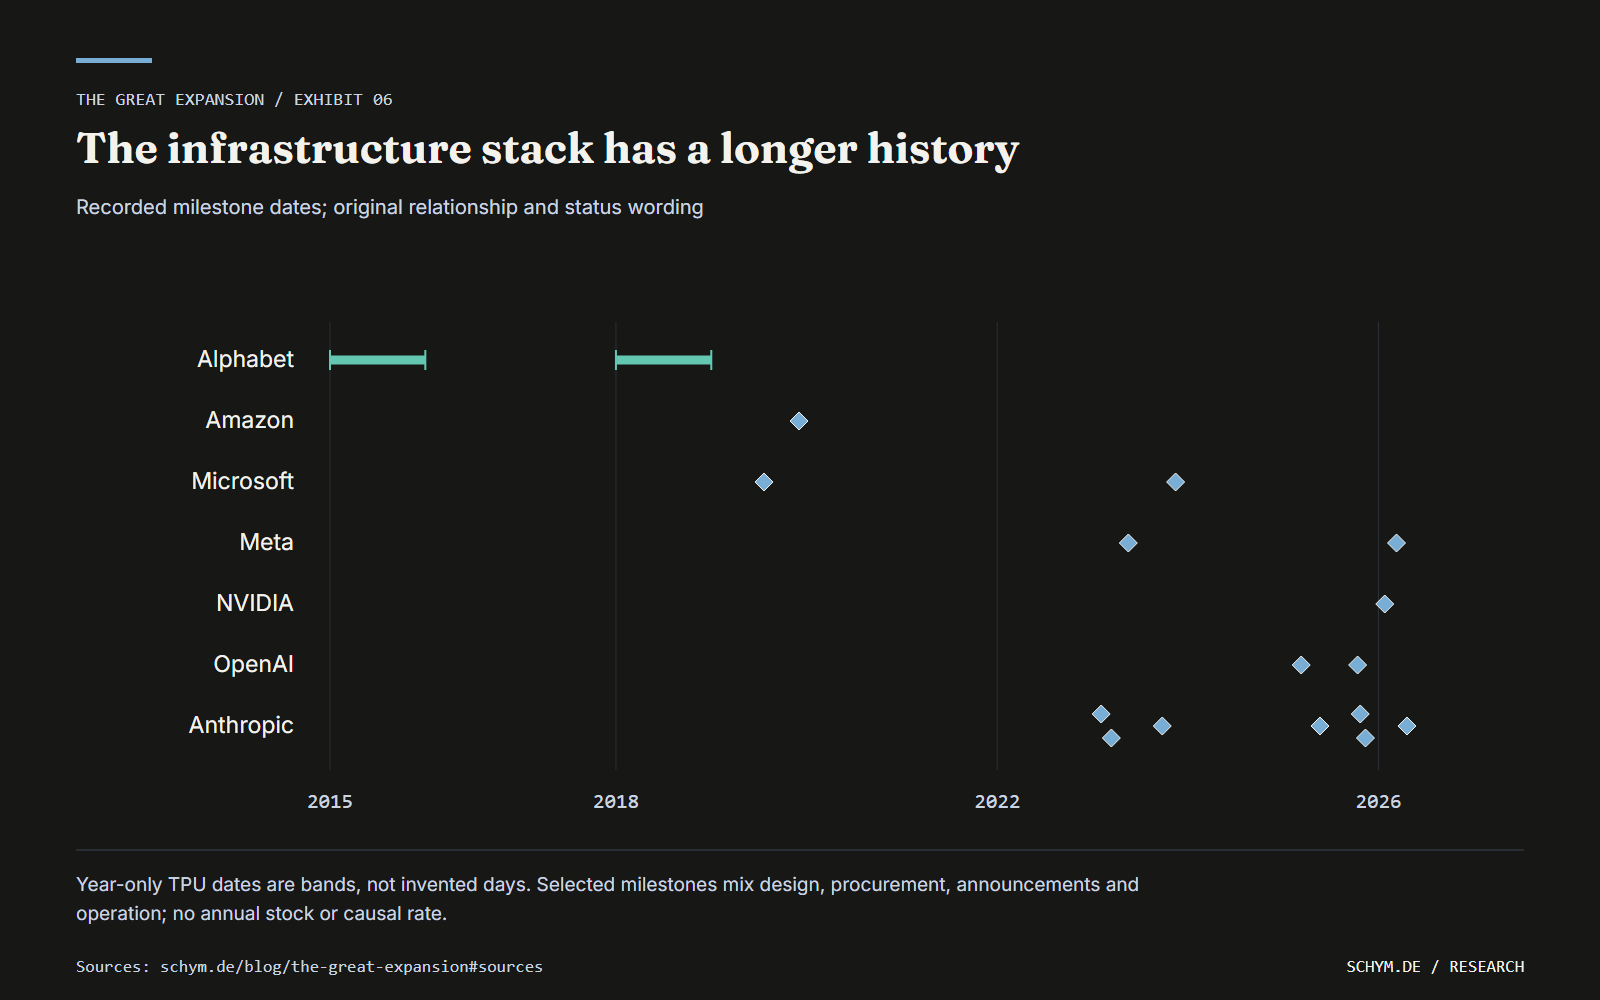
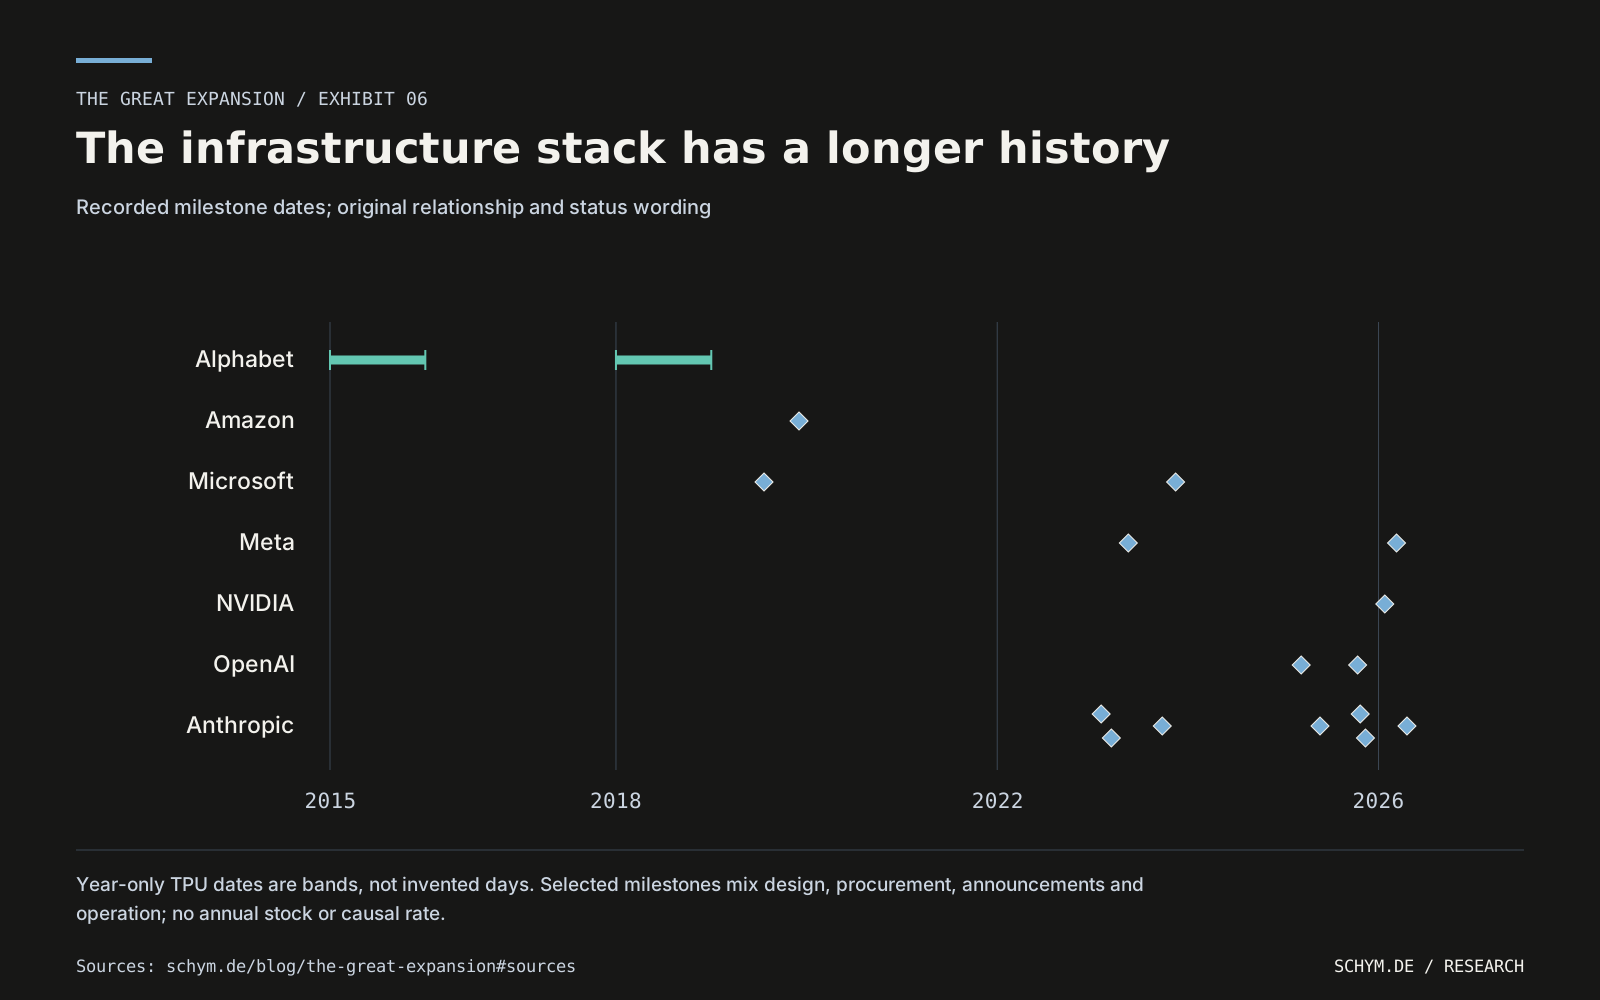
The 17 selected milestones also prevent the stack from appearing to begin with generative AI. Earlier capabilities and operating relationships remain in the chronology. Their presence is evidence of precedents, not an estimate of the rate at which firms integrated before or after a particular launch.
History supplies a useful restraint. The Henry Ford's account says that the Rouge complex never had fewer than 6,000 suppliers, despite its reputation as a monument to integration. It also records the separation of steelmaking in 1981 and its sale in 1989. The example does not establish that AI resembles steel production. It shows why extensive integration and extensive external supply can coexist, and why a boundary can change again when the economic comparison changes.
Sources The Henry Ford; University of Connecticut / Oxford University Press; Federal Trade Commission


06 / Test the counterexample
06A narrow bottleneck can support a very large business.
Economic influence need not come from operating every industry a technology reaches. A supplier can provide a difficult-to-replace complement to many independent producers. The relevant questions then concern substitutability, access terms, switching costs and the distribution of bargaining power, rather than the number of customer businesses under common ownership.
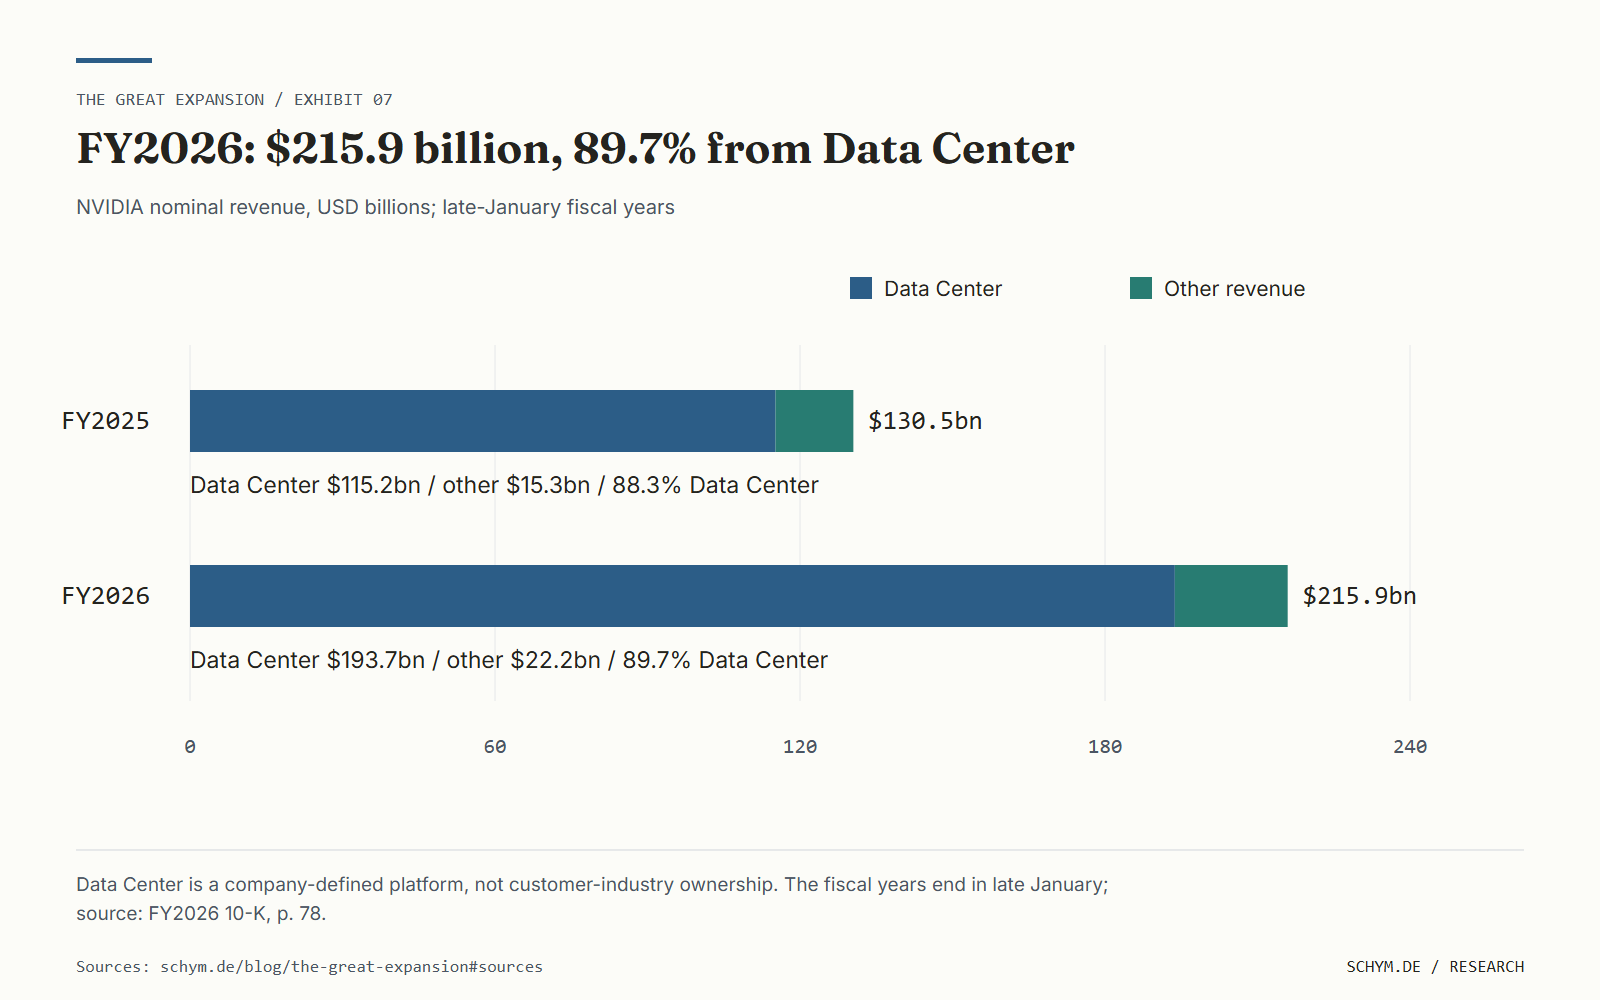
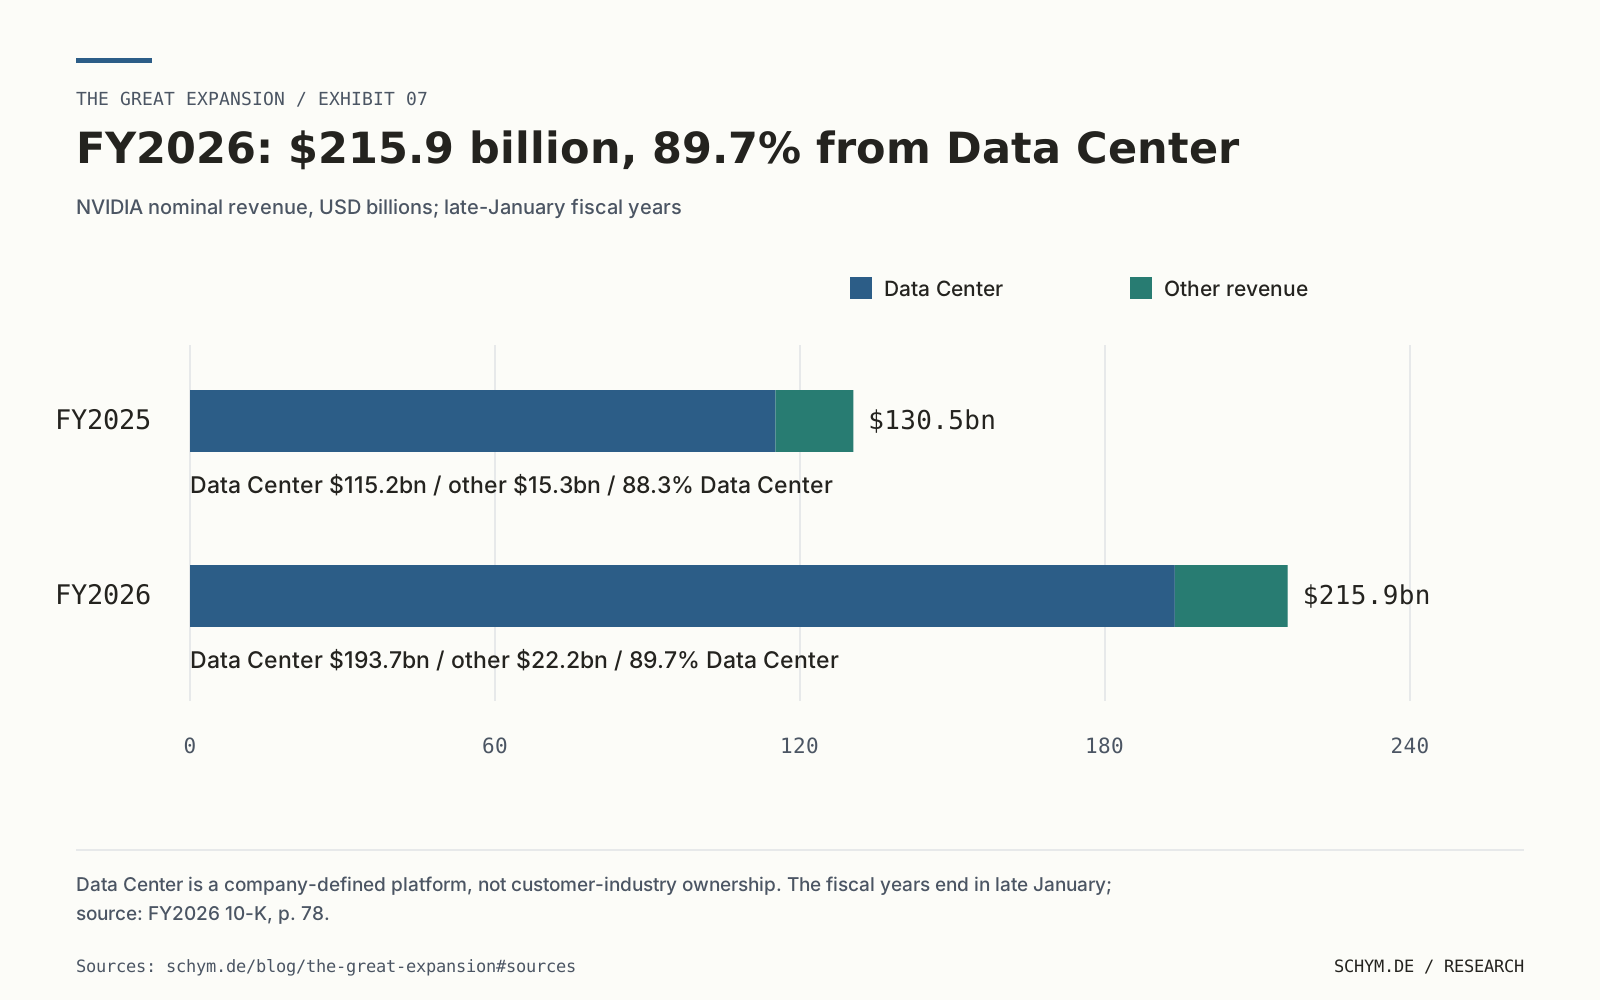
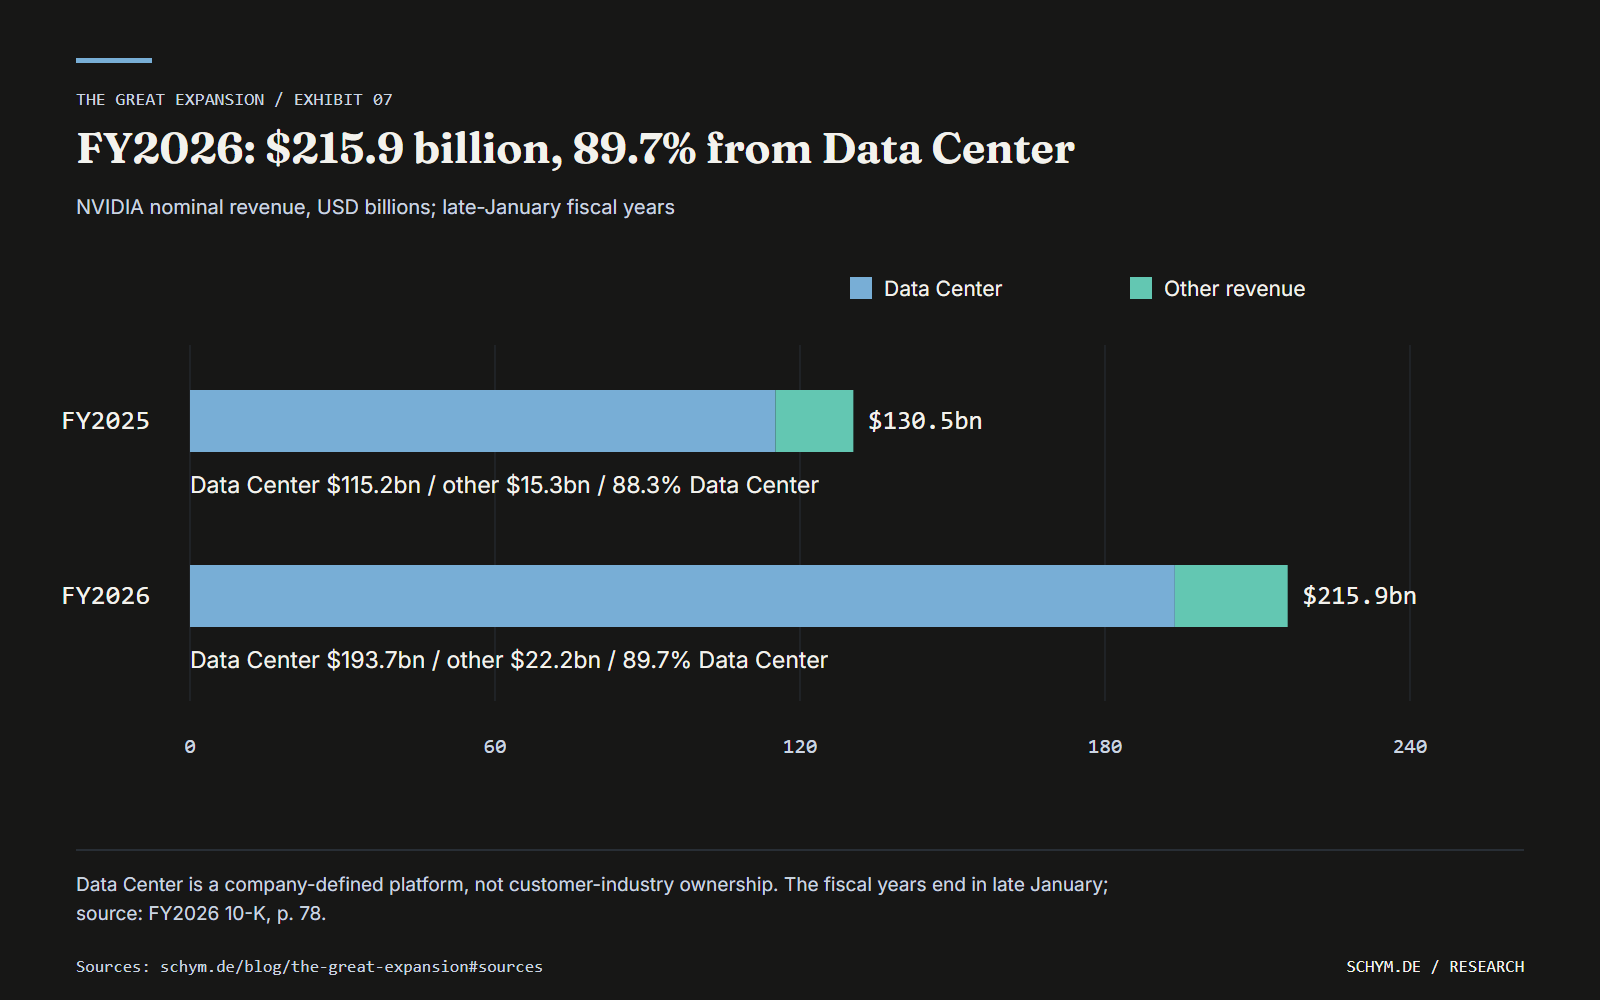
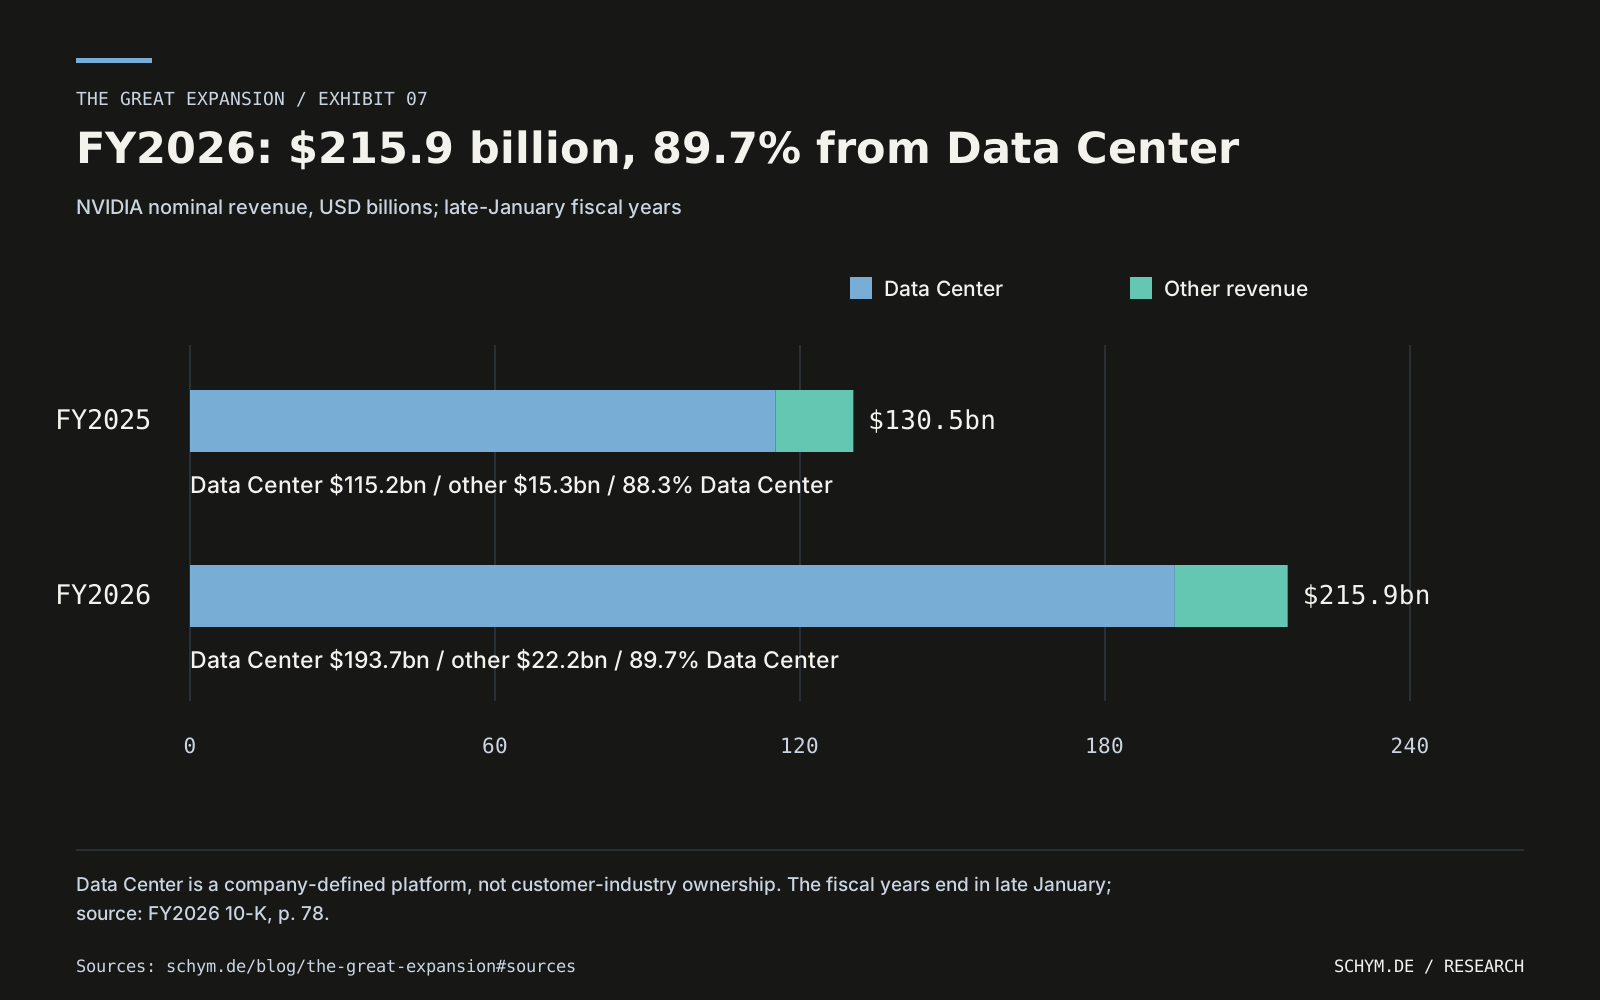
NVIDIA offers a concrete organizational possibility. Its FY2026 filing reports $193.737 billion of Data Center revenue out of $215.938 billion in total, about 89.7%. The filing also describes a fabless, contracted-manufacturing strategy. A tightly integrated design, systems and software offering can therefore coexist with external fabrication and independent customers.
Sources SEC EDGAR / NVIDIA; University of Connecticut / Oxford University Press
NVIDIA’s company-defined Data Center revenue rose from $115.186bn in FY2025 to $193.737bn in FY2026 as total revenue reached $215.938bn.
Hover or tap a segment to inspect it. With the chart focused, use arrow keys, Home or End to move through the four components.
- FY2025 · $130.497bn totalData Center $115.186bnOther platforms $15.311bn
- FY2026 · $215.938bn totalData Center $193.737bnOther platforms $22.201bn
Absolute nominal dollars on one zero-based 0–240bn scale, not 100% shares. “Data Center” is NVIDIA’s company-defined platform revenue, not market share or industry ownership.
Inspect exact values and sources
| Fiscal year | Period end | Total, $bn | Data Center, $bn | Other, $bn | Data Center share | Source |
|---|---|---|---|---|---|---|
| 2025 | 2025-01-26 | 130.497 | 115.186 | 15.311 | 88.267% | fin-nvidia-2026, fin-nvidia-release-2025 |
| 2026 | 2026-01-25 | 215.938 | 193.737 | 22.201 | 89.719% | fin-nvidia-2026, fin-nvidia-release-2026 |
InterpretationThe composition describes NVIDIA's own reported revenue, using its company-defined platform categories and late-January fiscal-year ends. It is neither the share of customer industries NVIDIA owns nor a measure of market concentration.
- Unit
- NVIDIA nominal revenue, USD billions; late-January fiscal years
- Sources
- Exact values
- CSV
This evidence does not, by itself, establish market power. It establishes why broad downstream ownership is an inadequate prerequisite for economic scale. A narrow position in an important complement may matter more than a wide portfolio of operating subsidiaries, while technological integration can be much greater than ownership of physical production stages.
The welfare implications remain conditional. Integration can improve reliability, protect specific investment or remove duplicated markups. It can also weaken access for rivals, discourage independent innovation or concentrate operational risk. Contractual networks preserve incentives and permit specialization, but can conceal dependence in exclusivity, switching costs or control of customer access. The relevant outcomes are prices, quality, innovation, reliability and entry. Ownership breadth alone settles none of them.
Sources SEC EDGAR / NVIDIA; American Economic Association; University of Chicago Press / Harvard DASH; Federal Trade Commission
07 / Keep the reverse movement
07A launch archive can only grow. An operating boundary can shrink.
Counting announcements accumulates activity by construction. A measure of active operations must also record closures, sales, suspensions and changes of scope. The difference is the familiar distinction between a flow of events and a stock at a date: new entries can be positive while exits prevent the active stock from growing.
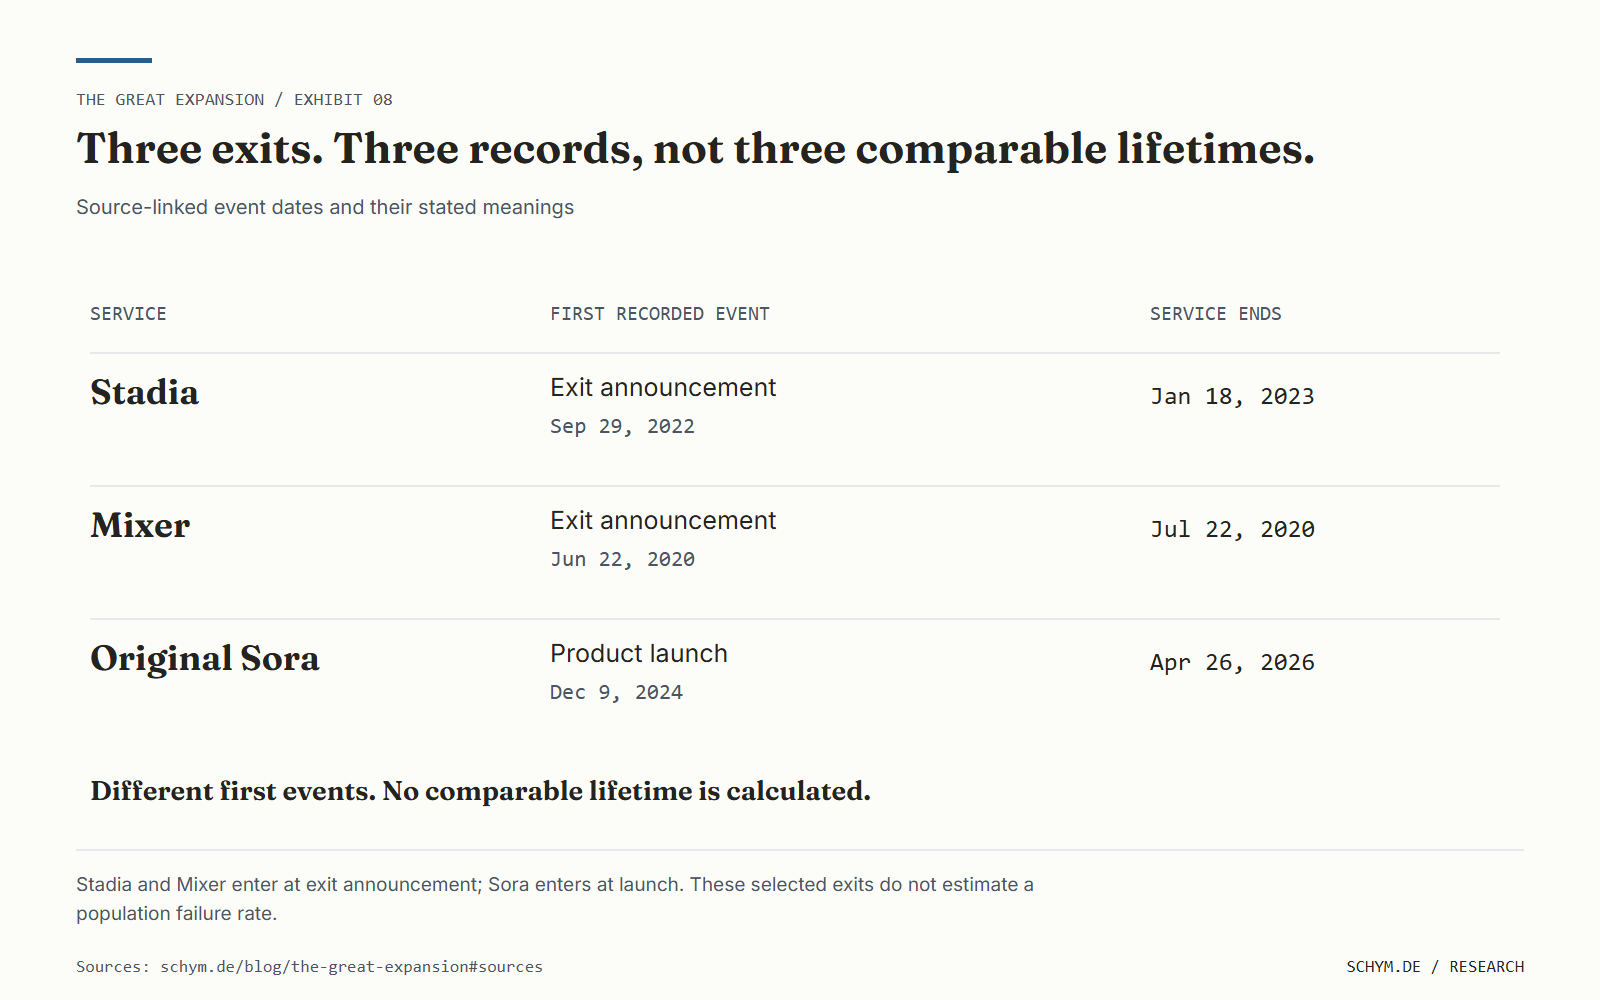
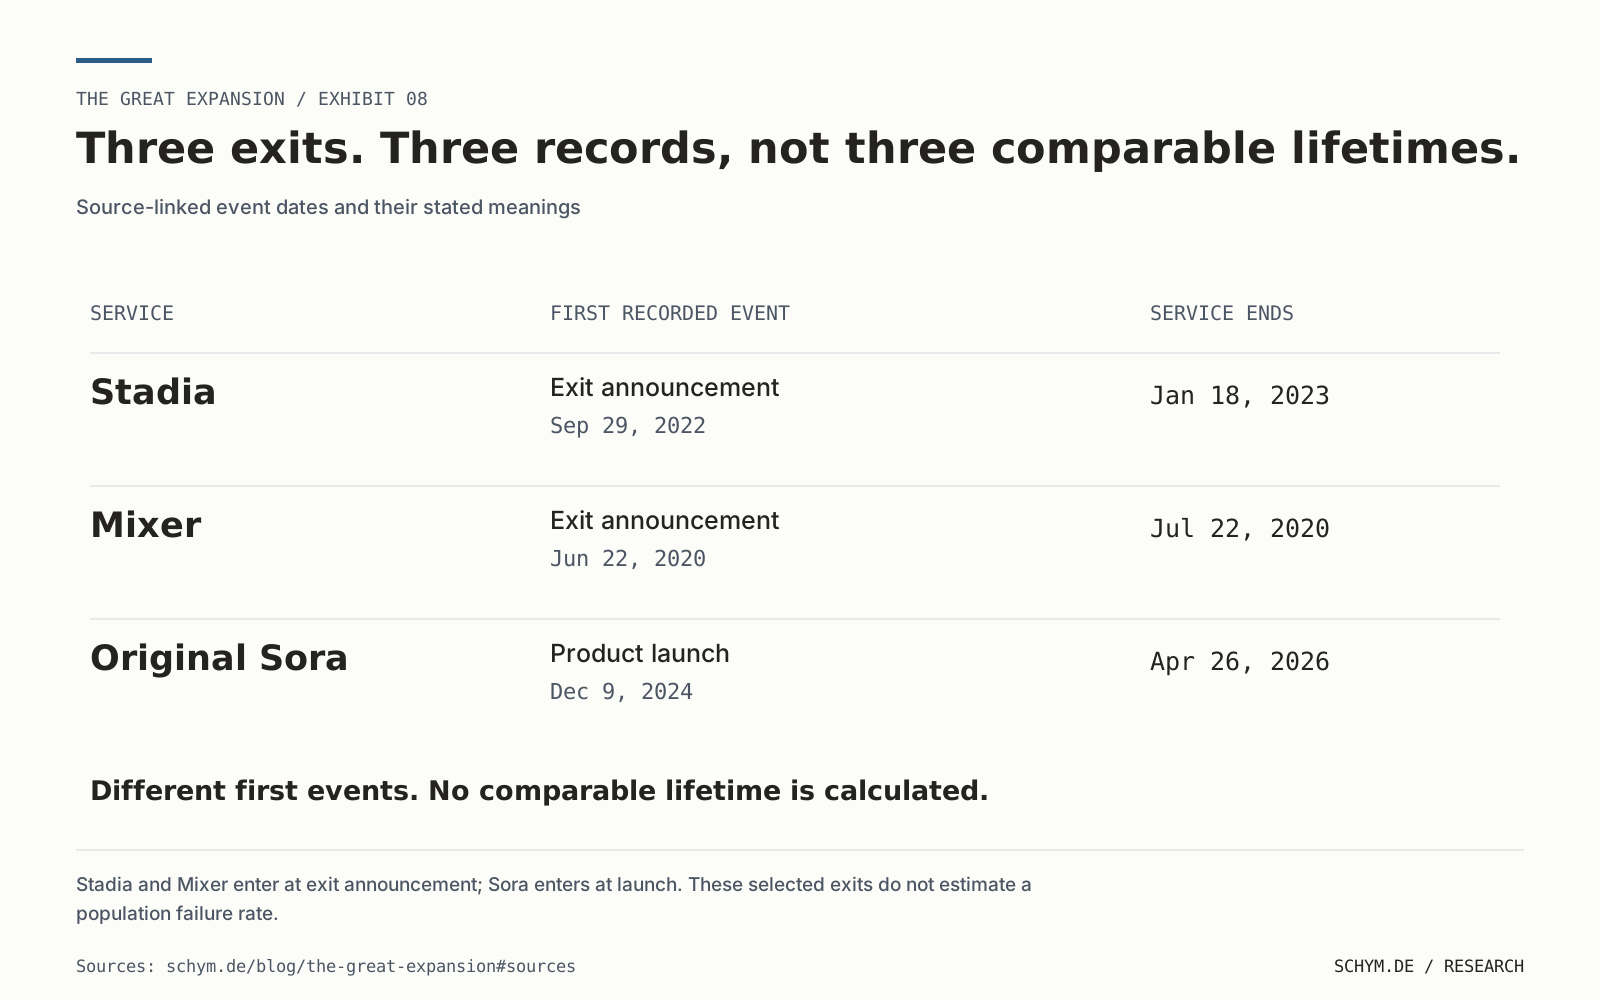
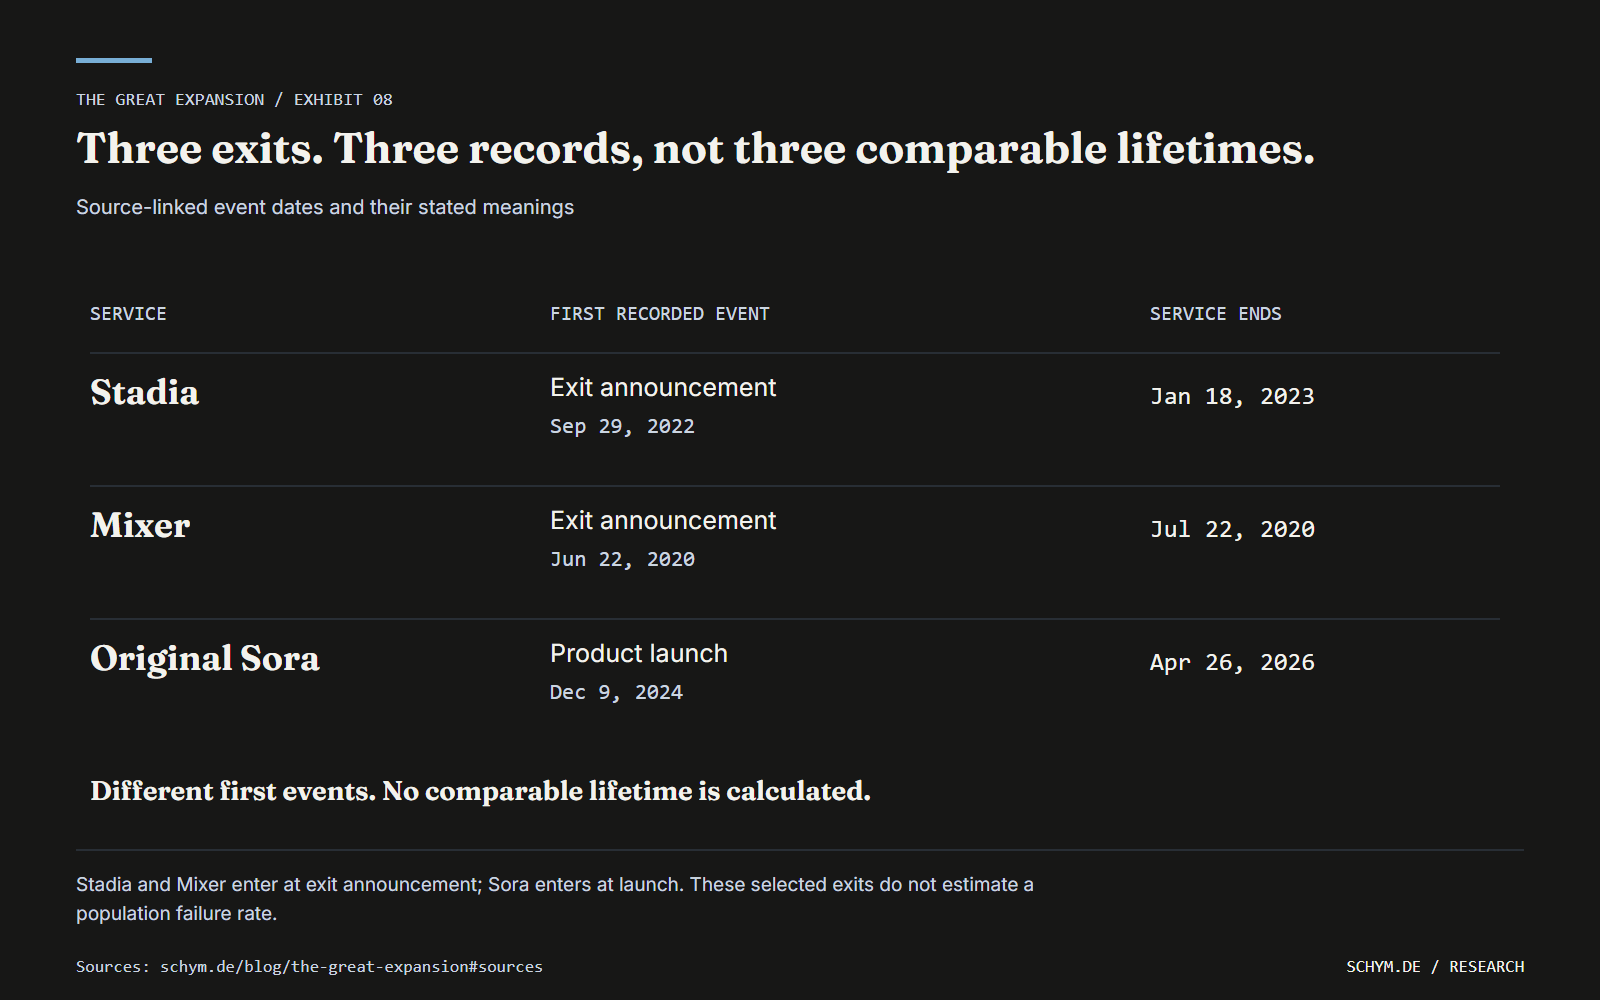
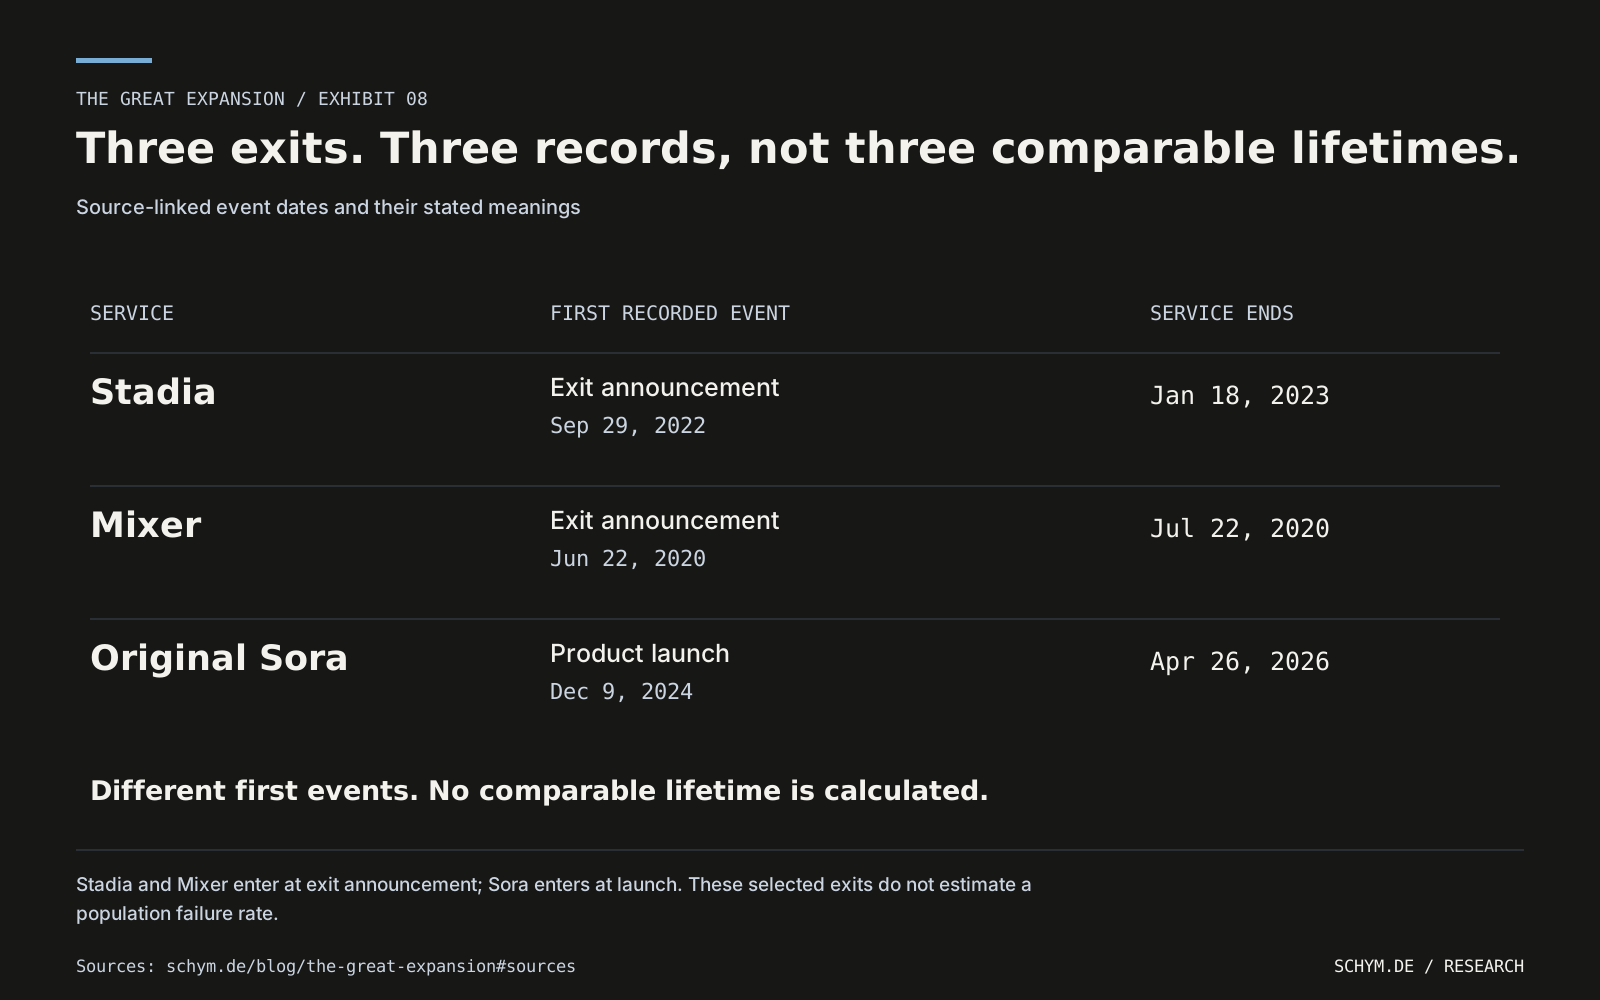
This audit retains Stadia, Mixer and the original standalone Sora product rather than erasing their withdrawals. But their event clocks are not interchangeable. The first retained event for Stadia and Mixer is an exit announcement; for Sora, it is a launch. Drawing three equal-looking business-lifetime bars would turn different source meanings into a false comparison.
Sources Google; Xbox / Microsoft; OpenAI
Read the exact event record
| Named service | First retained event | Meaning of first event | Documented end | Source |
|---|---|---|---|---|
| Stadia | Sep 29, 2022 | Exit announcement | Jan 18, 2023 | gov-03 |
| Mixer | Jun 22, 2020 | Exit announcement | Jul 22, 2020 | gov-08 |
| Original standalone Sora product | Dec 9, 2024 | Product launch | Apr 26, 2026 | gov-16 |
InterpretationKeep the event label attached to each date. These three selected withdrawals demonstrate reversibility and a measurement requirement; they do not estimate a venture failure rate.
- Unit
- Source-linked event dates and their stated meanings
- Sources
- Exact values
- CSV
A product closure also has a scope. Ending Mixer did not mean that Microsoft withdrew from every activity in gaming or streaming. Conversely, a familiar product name does not establish uninterrupted operation through the cutoff. A defensible ownership or operating-stock panel needs stable entity identifiers, completion and operating dates, exits and a rule for renamed or successor products.
Those records are not supplied by this selected event audit. Keeping that absence visible is more useful than constructing a smooth historical expansion index from today's list of capabilities.
Sources Google; Xbox / Microsoft; OpenAI
08 / Identify the missing test
08Better task performance does not identify a change in ownership.
The productivity literature makes the organizational question plausible without resolving it. The published customer-support study by Brynjolfsson, Li and Raymond covers 5,172 agents and estimates a 15% average increase in issues resolved per hour. Its effects differ by experience and skill. That is evidence about performance in a particular organization, not an estimate of a 15% expansion in the boundary of the firm.
The Cybernetic Teammate experiment examines a different outcome. Its analysis covers 776 randomized professionals from 811 participants, while the main quality regressions use 550 experimental-unit observations because teams submit one solution. Relative to unaided individuals, the reported baseline quality point estimates rise by 0.373 standard deviations for individuals with AI and by 0.245 for teams without AI. These comparisons concern a one-day product-development exercise. They do not test whether AI replaces a legal organization.
Sources Quarterly Journal of Economics; arXiv; NBER; Harvard Business School AI Institute
The revised Danish study, Still Waters, Rapid Currents, follows another margin again. Its latest wave covers 25,000 workers across 7,000 workplaces in 11 highly exposed occupations. The authors report near-zero average effects on earnings and recorded hours, with intervals ruling out effects larger than 2% two years after ChatGPT's launch, despite changes in tasks and AI-related work. Task reorganization, measured productivity and earnings are distinct outcomes.
At the firm level, Babina and coauthors associate AI-skilled employment with innovation and growth in a principally 2010-2018 US panel. Their university-exposure instrumental-variable strategy has its own identifying assumption. It does not identify a post-2022 effect of owning the AI stack on legal entry into new industries. Nor should percentages, standard deviations and earnings estimates from these settings be averaged into an organizational effect.
Sources NBER; Journal of Financial Economics / author repository
The older integration literature reinforces the conditional answer. Acemoglu and coauthors find different associations for upstream and downstream technology intensity in UK manufacturing; whose investment matters changes the prediction. Lafontaine and Slade's review does not support a context-free presumption that integration is efficient or harmful. Ide and Talamas model knowledge hierarchies, including differences between autonomous AI and copilots, but a modeled hierarchy is not an observed acquisition or outsourcing contract.
A stronger empirical test would first construct consistent firm-sector histories. It would distinguish owned from contracted capabilities, inherited core activities from new participation, and active operations from cumulative announcements. Then it would ask whether control of a particular capability precedes operating entry where that capability matters, using a credible comparison group and preserving exits.
Timing alone is not enough. A firm may invest upstream because it already plans to enter downstream; cash, distribution and expected demand can drive both decisions. Moving the integration variable one year earlier does not remove that anticipation. An elaborate event-study chart cannot supply the missing counterfactual.
A smaller comparison may be more informative: assign comparable projects to AI-assisted internal teams and AI-assisted external suppliers, then measure full quality-adjusted delivery cost, verification, adaptation and failure. That would not answer every question about conglomerates. It would answer the relative-cost question that the broader organizational claim often assumes away.
Sources Journal of the European Economic Association; American Economic Association; Journal of Political Economy; Wiley / Economica
InterpretationThe reviewed record establishes a large investment build-out and varied governance arrangements. It does not identify a general causal movement from AI capability to ownership of downstream industries.