

Who arrives
is changing.
A country can experience little change in total immigration while undergoing a profound change in who arrives.
179 comparable destinations. Flow-weighted, modeled estimates. Tertiary is a source-category proxy.
Map: tertiary-share change; −15 to +15 pp. Gray: not compared. At least 100,000 estimated arrivals in both periods.
Portugal received almost the same estimated number of immigrants in 2015–20 as it had in 1990–95: 474,000 against 482,000. Yet the estimated share arriving with tertiary education increased by 8.3 percentage points. A nearly flat total concealed a substantially different arriving population.
The United States offers a larger example. Its estimated five-year inflow increased by 9.9%, while the tertiary-educated share rose from 17.3% to 28.5%. Neither comparison says why the composition changed. Both show why the number of arrivals alone is an incomplete description of immigration.
A new dataset by Dilek Yildiz and Guy Abel estimates the age and education composition of immigration for 199 countries, separately for women and men, over six five-year periods. Combined with independent estimates of migration flows, it allows a more specific question: how did the people arriving change?
A stable total.
A different arriving population.
Portugal exposes what the total conceals. The global comparison tests whether the same change reaches beyond one destination.
PORTUGAL / ESTIMATED FIVE-YEAR ARRIVALS
−1.7%
Change in immigration volume
Yildiz & Abel (2026); independent Abel–Cohen flows, authors’ 2023 mirror. Modeled estimates. Tertiary is a source-category proxy.
The total barely moved.
Portugal received an estimated 482,392 immigrants in 1990–95 and 474,142 in 2015–20. Looking only at these totals, the arriving population appears almost unchanged.
The arriving population did.
The estimated tertiary-educated share rose by 8.3 percentage points. The bars now show composition, with all arrivals as the denominator. Similar volumes can contain very different education profiles.
The education shift was global.
Across 179 comparable destinations, the flow-weighted tertiary proxy rose from 12.5% to 20.5%. Among arrivals aged 25 and older, it rose from 21.1% to 30.5%, so the increase survives an adult-only comparison.
Most of the rise happened within destinations.
An exact accounting decomposition attributes 6.65 percentage points to changing profiles within destinations and 1.40 points to a change in destinations’ relative flow weights. About 83% of the increase came from the first component.
Take the question to another country.
Education does not determine a single age profile. Canada, Japan and Germany all saw higher tertiary shares, while their prime-age shares moved differently. Carry a destination into the atlas to compare both dimensions.
Explore Portugal in the atlas →Read the sequence and exact values
The total barely moved. Portugal received an estimated 482,392 immigrants in 1990–95 and 474,142 in 2015–20. Looking only at these totals, the arriving population appears almost unchanged.
The arriving population did. The estimated tertiary-educated share rose by 8.3 percentage points. The bars now show composition, with all arrivals as the denominator. Similar volumes can contain very different education profiles.
The education shift was global. Across 179 comparable destinations, the flow-weighted tertiary proxy rose from 12.5% to 20.5%. Among arrivals aged 25 and older, it rose from 21.1% to 30.5%, so the increase survives an adult-only comparison.
Most of the rise happened within destinations. An exact accounting decomposition attributes 6.65 percentage points to changing profiles within destinations and 1.40 points to a change in destinations’ relative flow weights. About 83% of the increase came from the first component.
Take the question to another country. Education does not determine a single age profile. Canada, Japan and Germany all saw higher tertiary shares, while their prime-age shares moved differently. Carry a destination into the atlas to compare both dimensions.
Download the education evidenceOne destination.
Many possible arrivals.
Six periods, 199 destination profiles, and an independent account of the flows between them. A country’s total is only the beginning of its story.
YOUR DESTINATION / 2015–20
United States
5 census samples listed; latest 2015. The displayed profiles are modeled estimates.
Decrease Increase Outside comparison. Country color: change since 1990–95, −15 to +15 pp; extremes saturated. Corridor widths encode independent flow totals. Demographic profiles belong to destinations.
A destination has both a volume and a composition
Independent five-year flows; destination shading shows composition change.
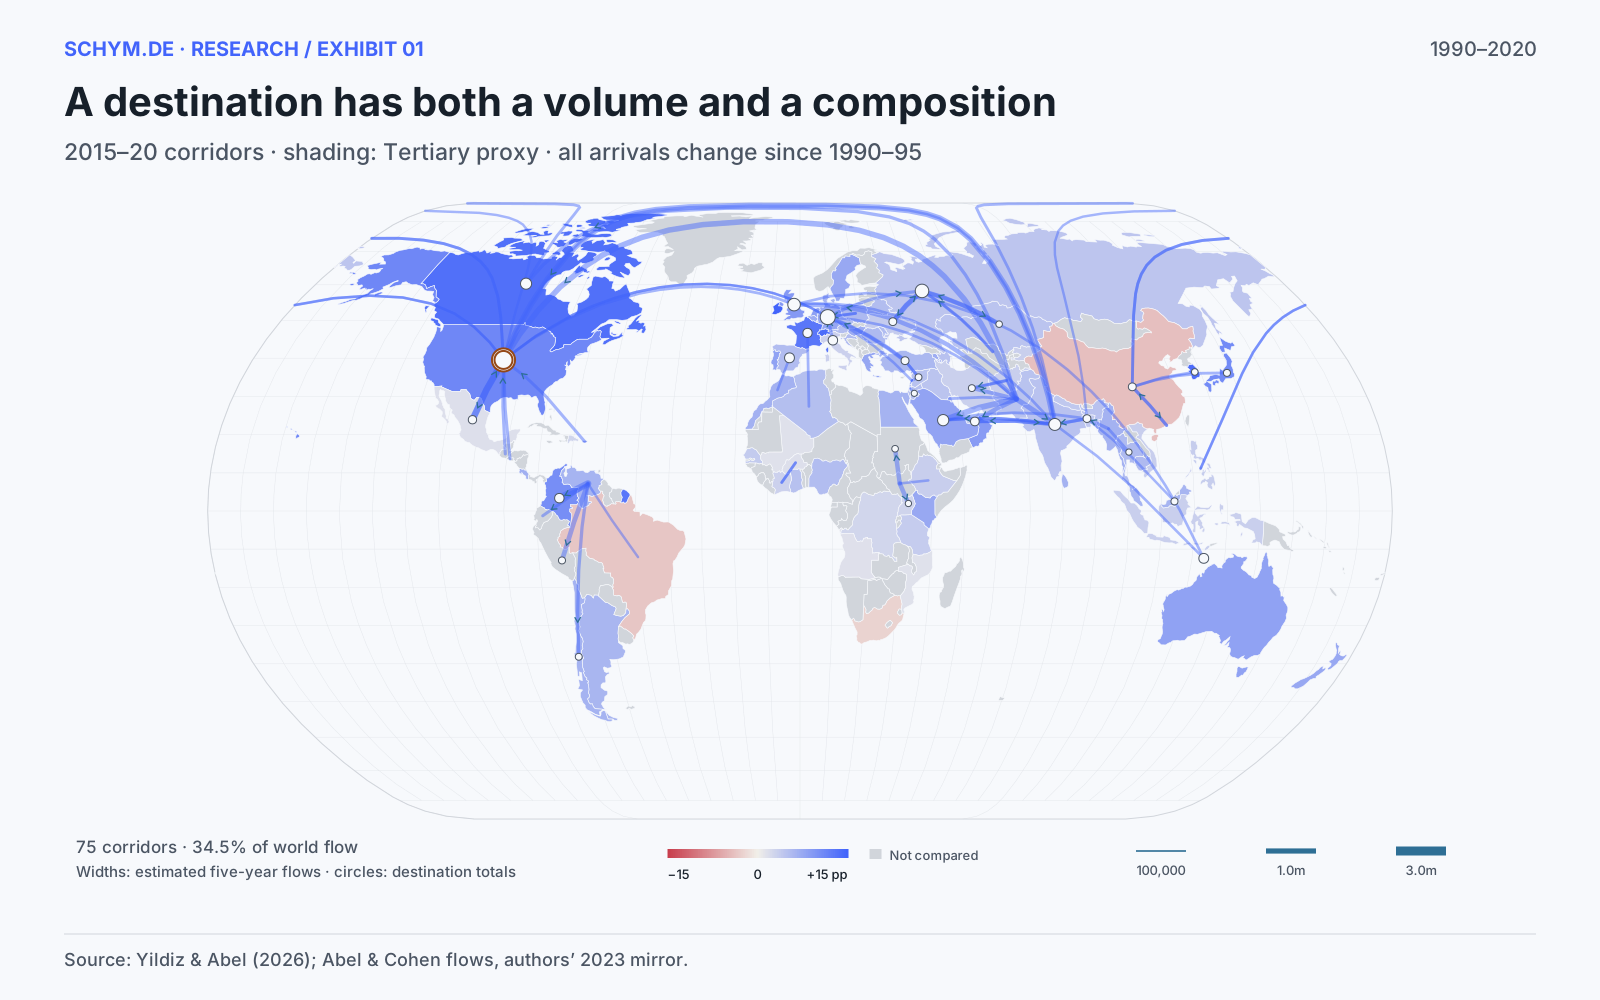
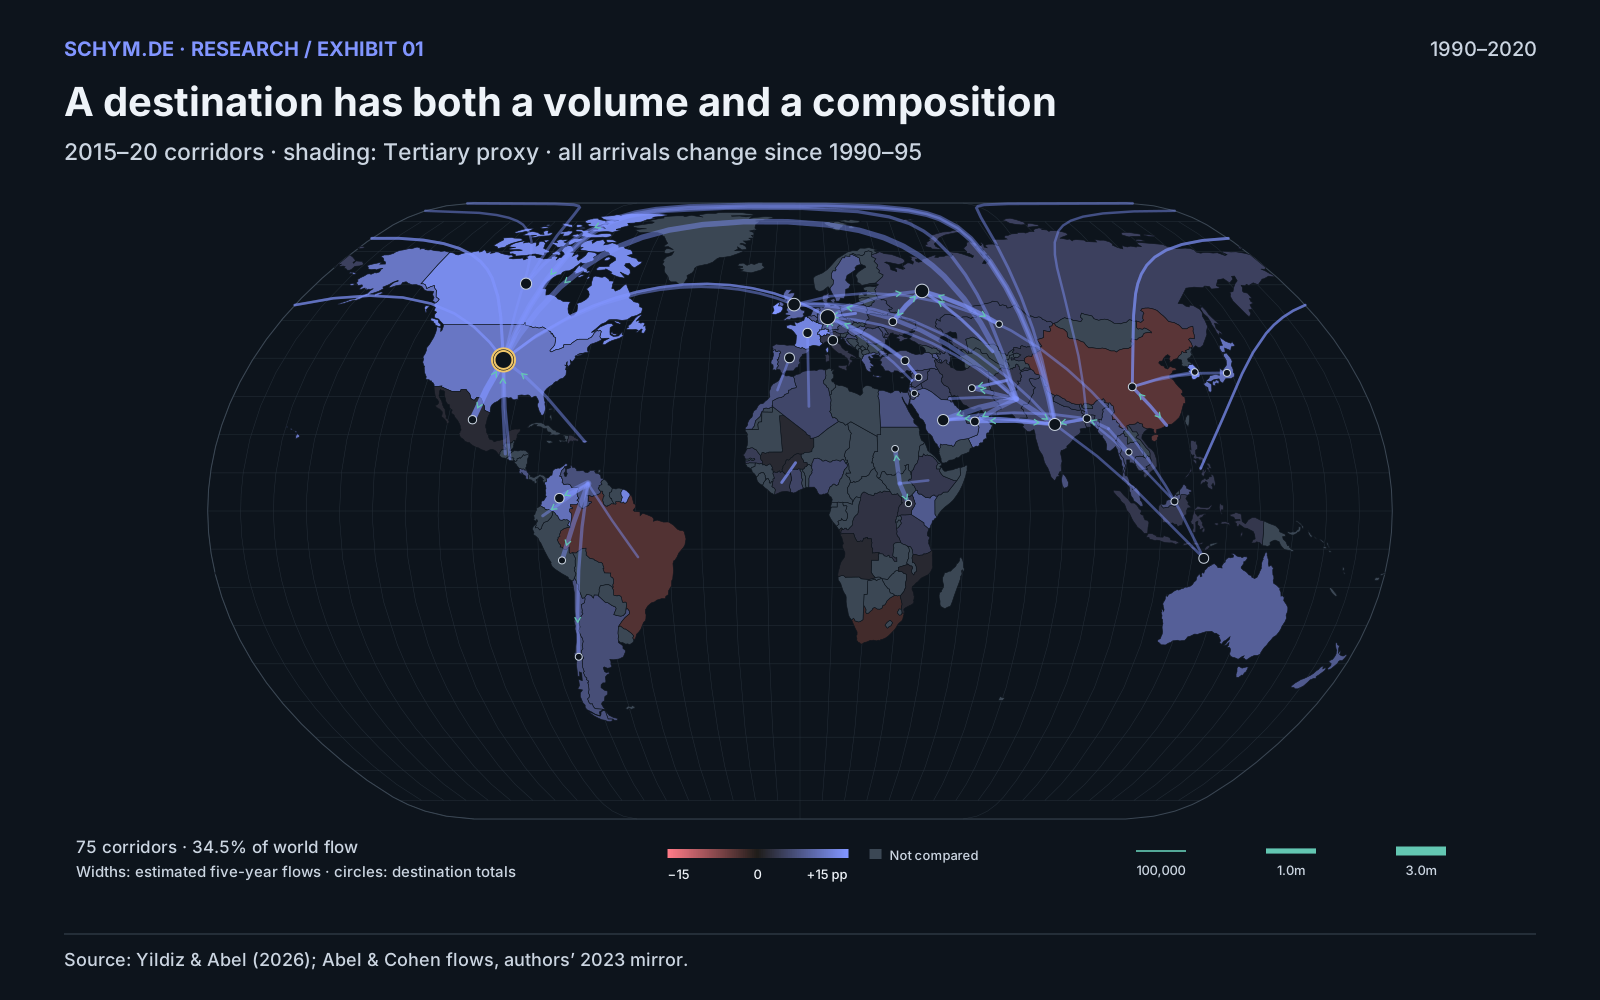
Corridors identify estimated moves, not the age or education of people on individual routes.
Source, exact values and downloads
Source: Yildiz & Abel (2026); Abel & Cohen flows, authors’ 2023 mirror. The chart is descriptive; source definitions and coverage are explained in the methods.
Download exact values (CSV, gzip)Rank countries by absolute composition change
Rankings load with the atlas · at least 100,000 estimated arrivals in both periods. 1990–95 → 2015–20. Tertiary proxy · all arrivals.
The threshold prevents rankings driven by tiny estimated flows. Census coverage is an evidence indicator, not a confidence interval.
Fewer children, more prime-age and tertiary-educated arrivals
Across 179 destinations with comparable composition estimates and usable flow weights at both endpoints, the tertiary proxy rose from 12.5% to 20.5% of all arrivals. The share aged 25–54 increased from 42.7% to 47.4%. The child share fell from 25.4% to 20.3%, while the share aged 55 or older increased from 8.0% to 9.9%.
These are flow-weighted estimates for a balanced set of destinations, covering about 97% of the independent estimated world flow in each endpoint period. They are not simple averages of national proportions. Larger destinations receive larger weights, using a separate total-flow series.
The estimated female share declined from 49.0% to 47.2%. That result comes from the external sex-specific flow estimates. It cannot be calculated from the composition CSV alone, because every female profile and every male profile separately sums to one.
The terminology also matters. “Prime working age” identifies ages 25–54; it does not establish employment. The 55+ group includes people who may still work. “Tertiary” is shorthand here for the source’s post-secondary category at ages 20+, mapped in the underlying work from completed university education. It is a proxy, not a freshly harmonized OECD qualification measure. Among arrivals aged 25+, the corresponding share rose from 21.1% to 30.5%.
The education shift is more widespread than the age shift
1990–95 → selected period · countries above the chosen flow threshold.
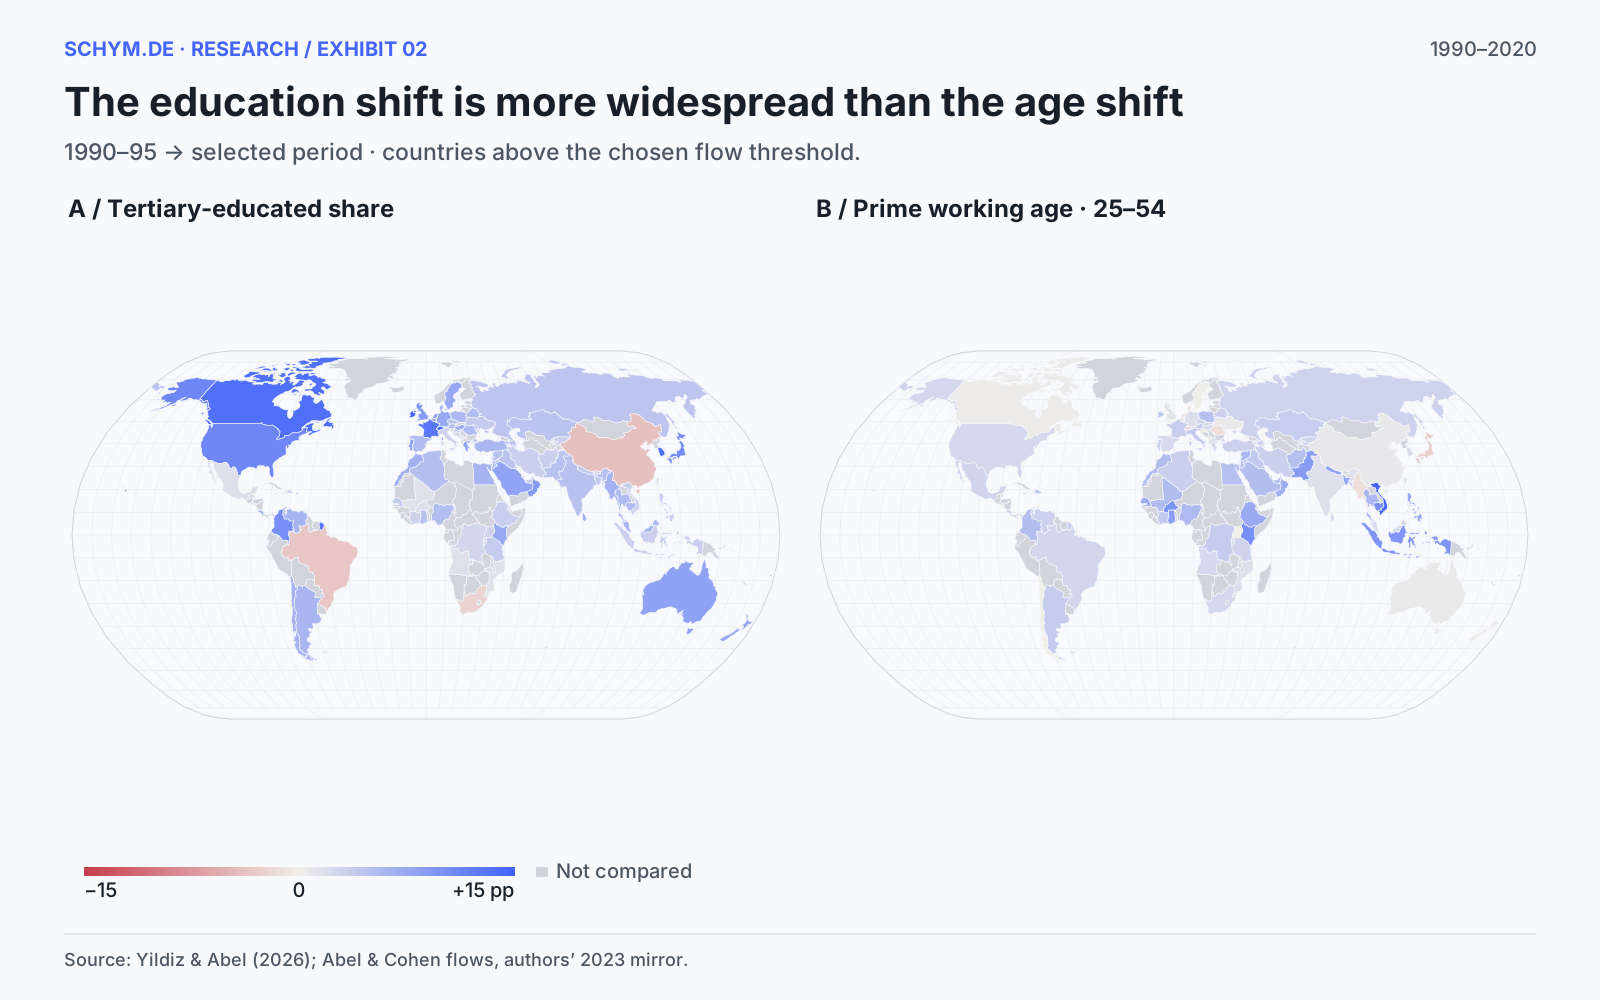
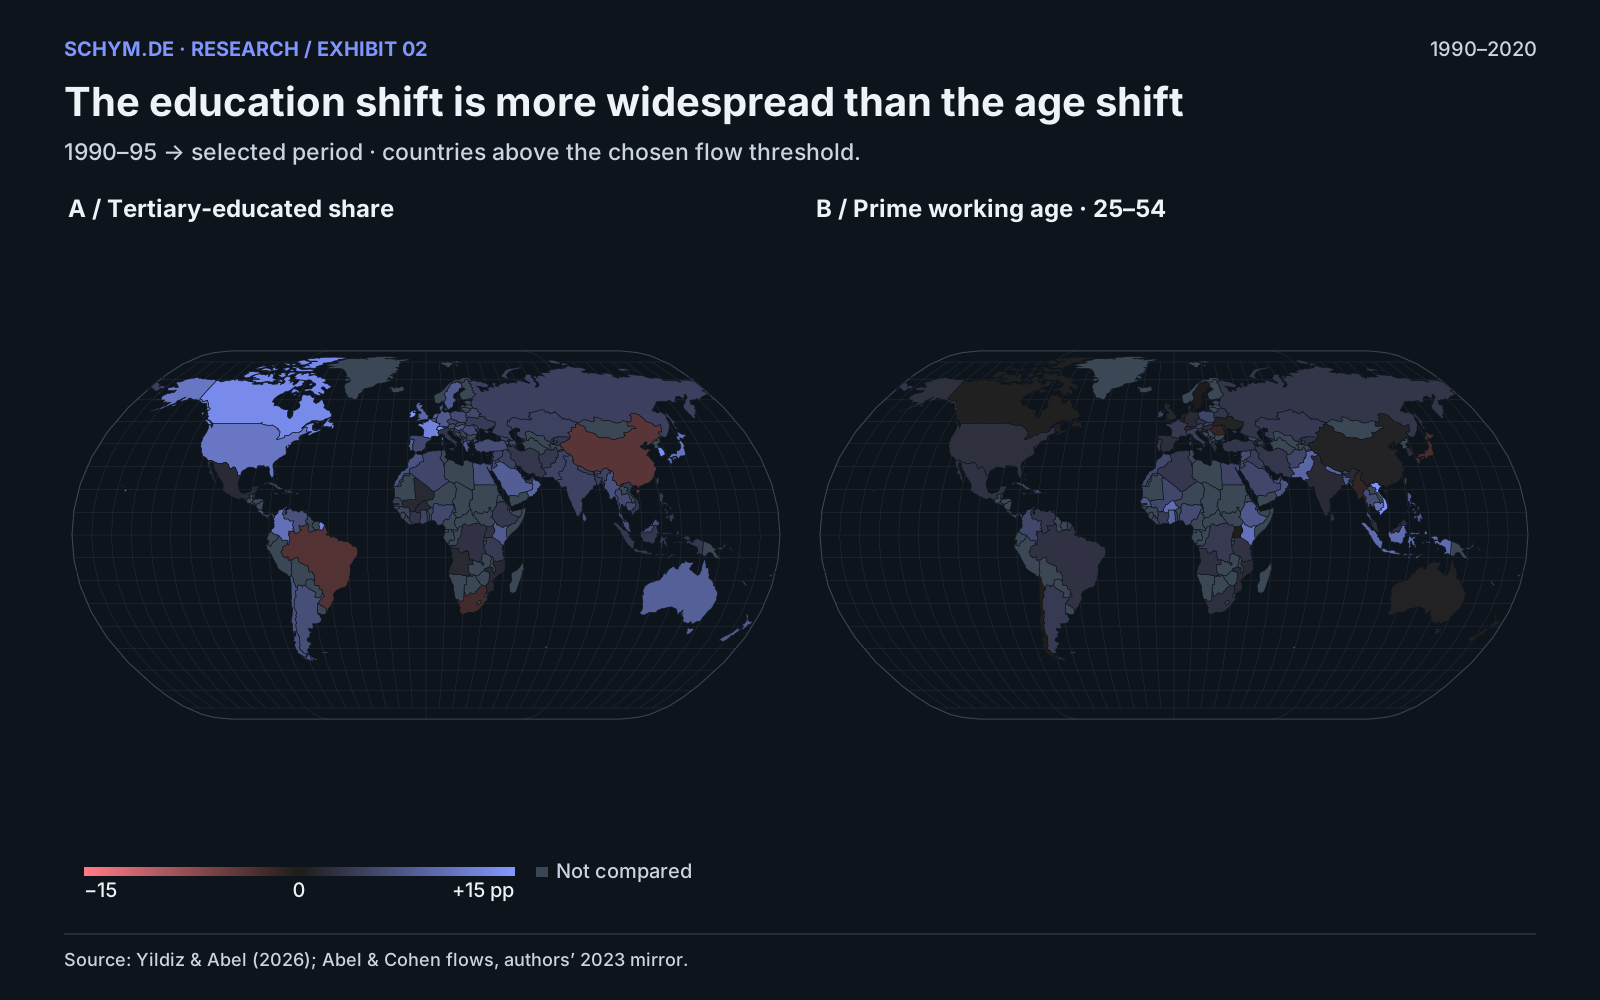
Tertiary means the source post-secondary category at age 20+, divided by all arrivals. Prime age is 25–54.
Source, exact values and downloads
Source: Yildiz & Abel (2026); Abel & Cohen flows, authors’ 2023 mirror. The chart is descriptive; source definitions and coverage are explained in the methods.
Download exact values (CSV, gzip)The educational direction is shared; the age pattern is less uniform
Canada’s tertiary share increased by 13.7 percentage points, Germany’s by 7.7 points and Japan’s by 10.8 points. Yet Canada’s share aged 25–54 changed by only 0.5 points, Germany’s rose by 1.8 points and Japan’s fell by 2.8 points. “More educated immigration” does not imply a single age trajectory.
The pyramids make those differences visible. Each side is normalized within sex, allowing the shapes of women’s and men’s arriving age distributions to be compared without confusing composition with the number of arrivals. The outline shows 1990–95 and the solid bars show the selected endpoint. These are immigration profiles, not pyramids of the entire foreign-born resident population.
The two regional panels pool country profiles with independent flow weights. The Gulf panel covers the six GCC states. The Southern European panel covers Italy, Spain, Greece and Portugal; it is deliberately not presented as the whole statistical region. Select any other destination in the atlas to append its own pyramid, including individual Gulf and Southern European states. All pyramids in that view share a common horizontal scale.
Similar education shifts can accompany different age profiles
Male and female age distributions each sum to 100%.
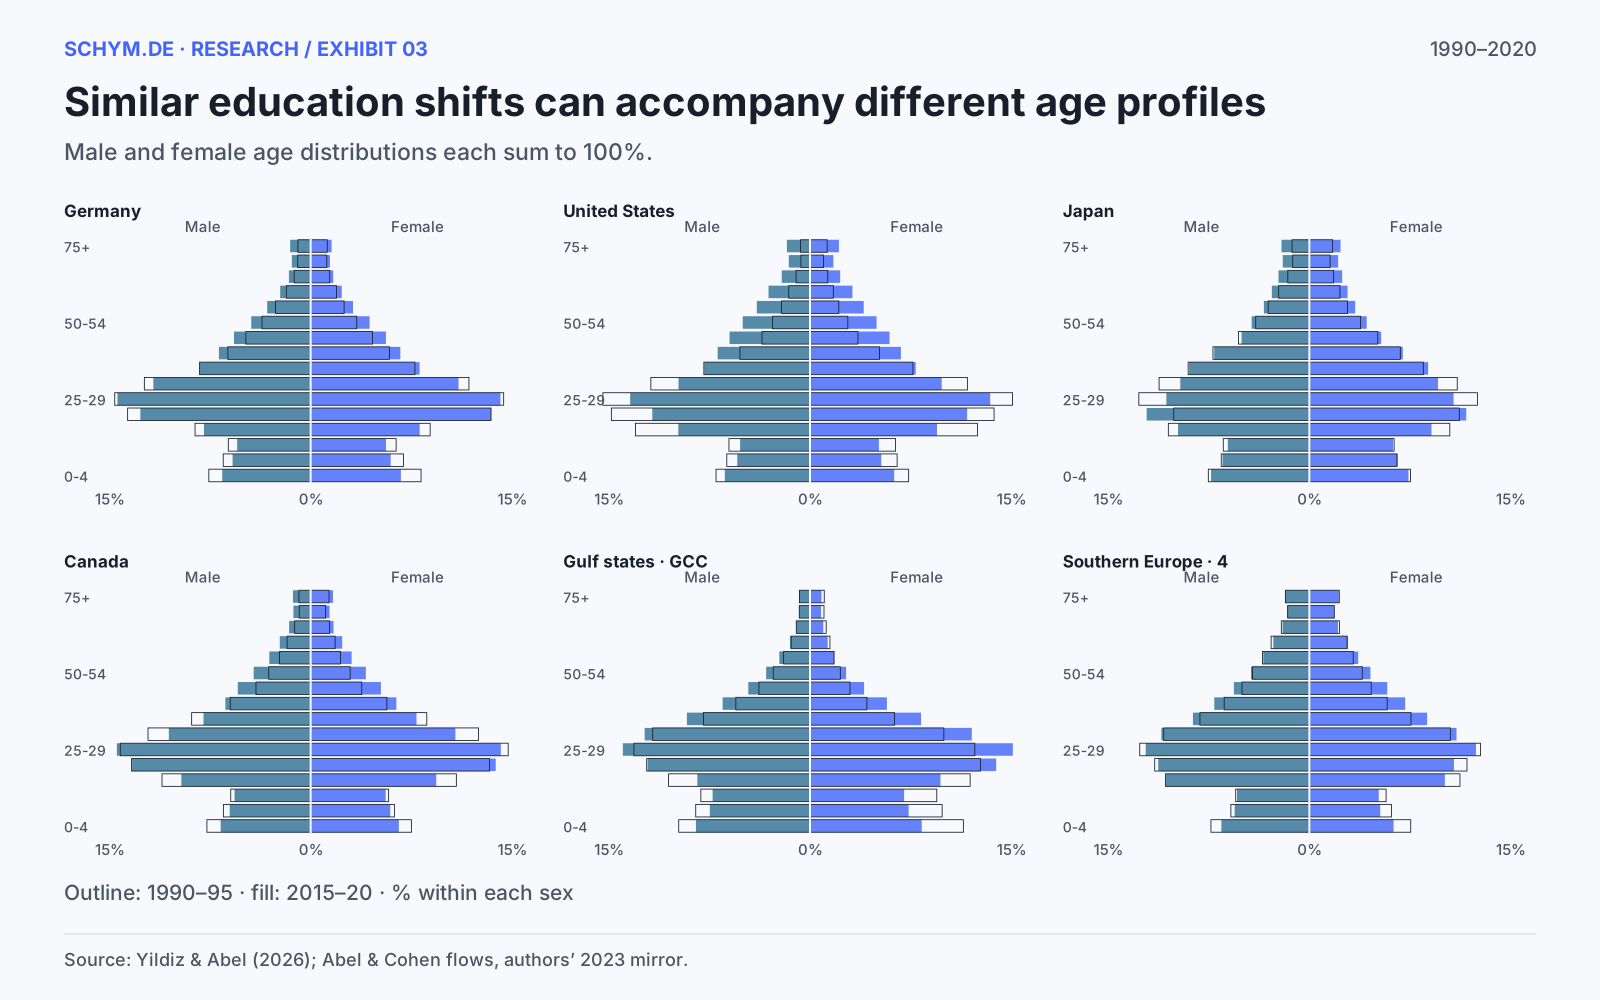
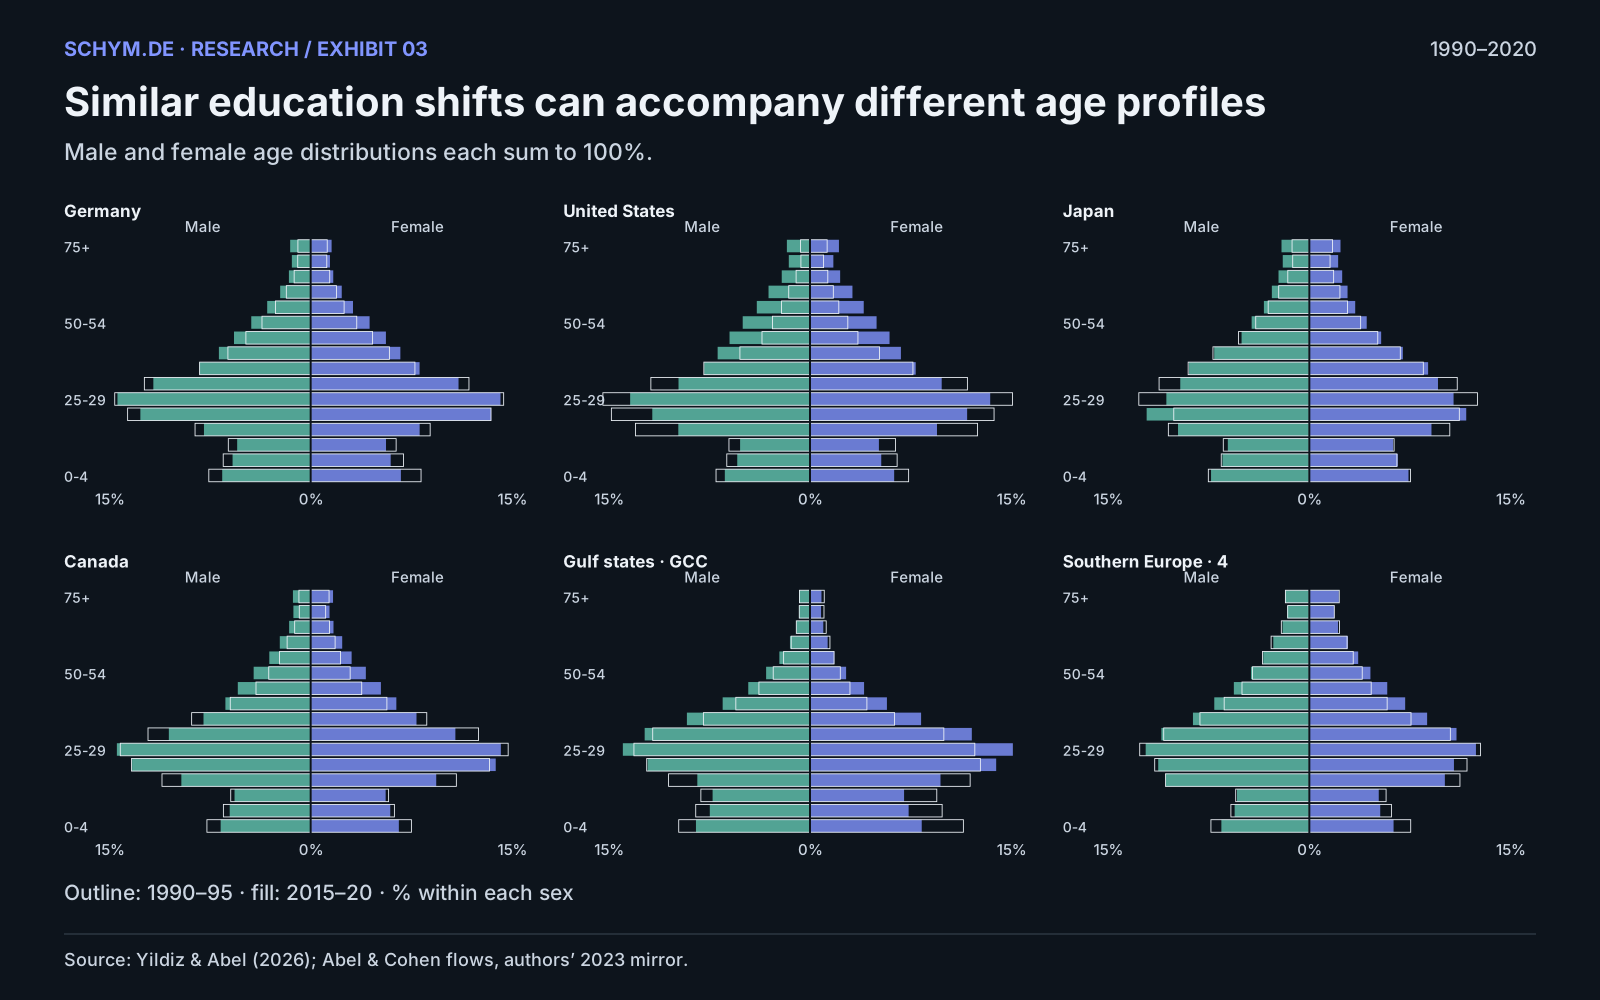
GCC: Bahrain, Kuwait, Oman, Qatar, Saudi Arabia and UAE. Southern Europe here: Italy, Spain, Greece and Portugal.
Source, exact values and downloads
Source: Yildiz & Abel (2026); Abel & Cohen flows, authors’ 2023 mirror. The chart is descriptive; source definitions and coverage are explained in the methods.
Download exact values (CSV, gzip)Large destinations differ in more than one dimension
A country can become more educated, younger in one part of its age distribution and older in another. The heatmap therefore preserves separate measures. It orders the 30 largest destinations by independently estimated immigration in 2015–20, then shows how their composition changed from 1990–95.
The ordering does not use the composition proportions. A country with a 30% tertiary share is not necessarily a larger immigration destination than a country with a 10% share. Sudan’s missing baseline remains blank: a geographical mismatch between current and former states is not repaired by inventing an early-period composition.
The 30 largest destinations do not share one trajectory
1990–95 → 2015–20 · ordered by independent final-period immigration totals.
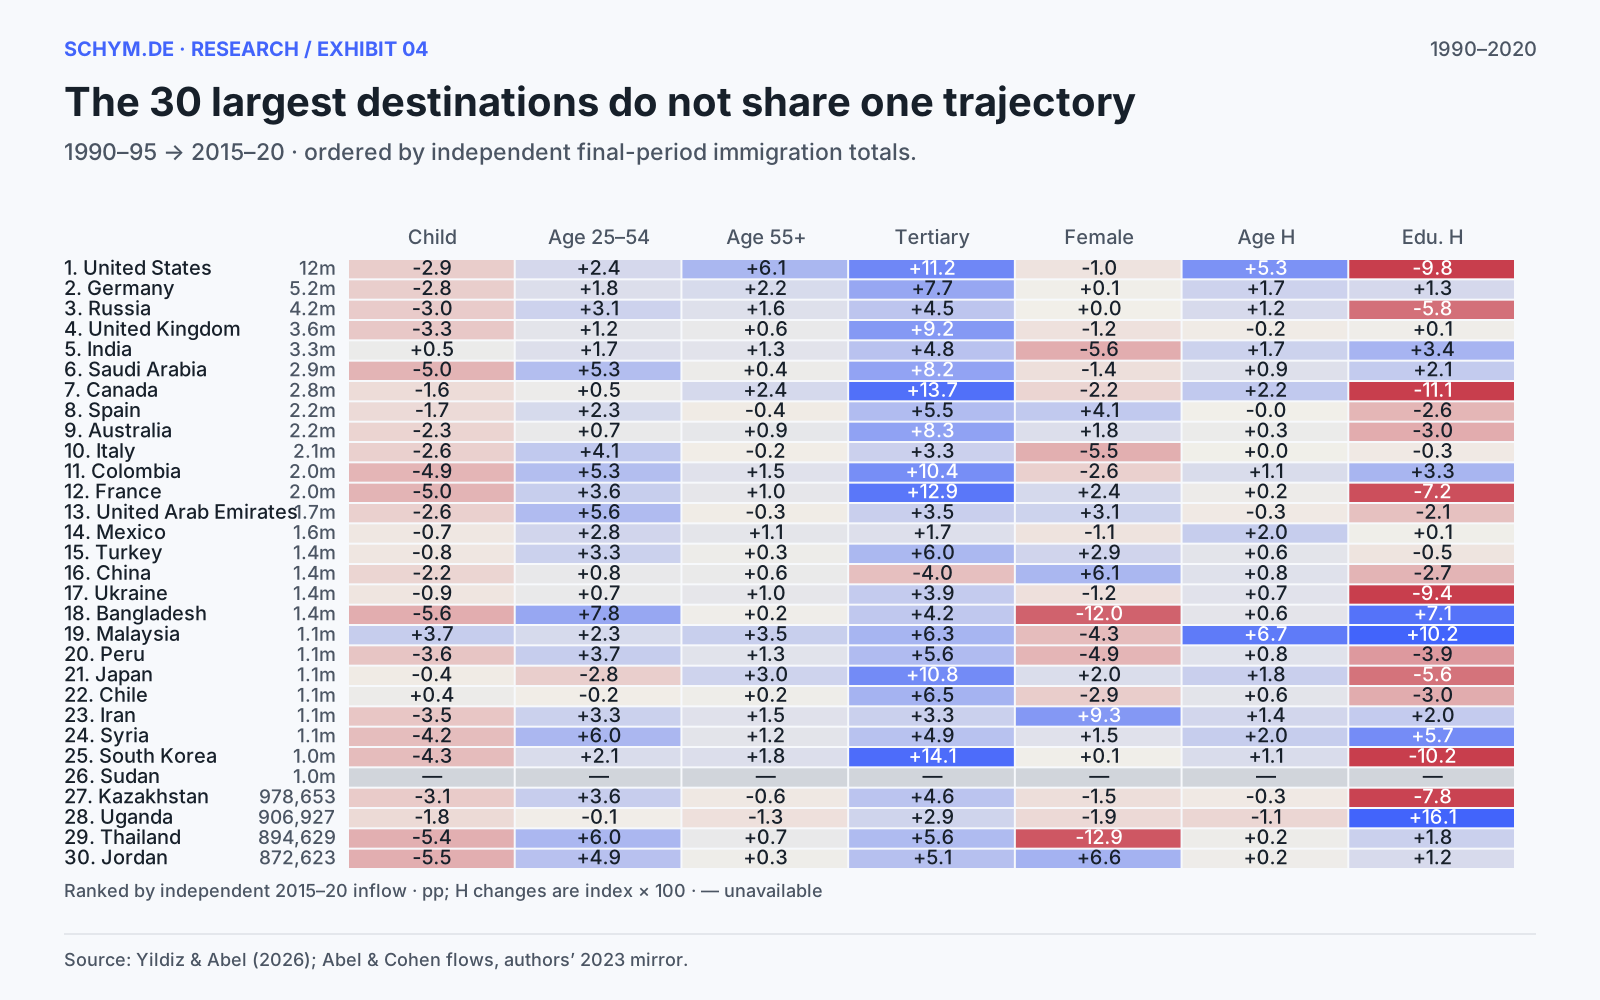
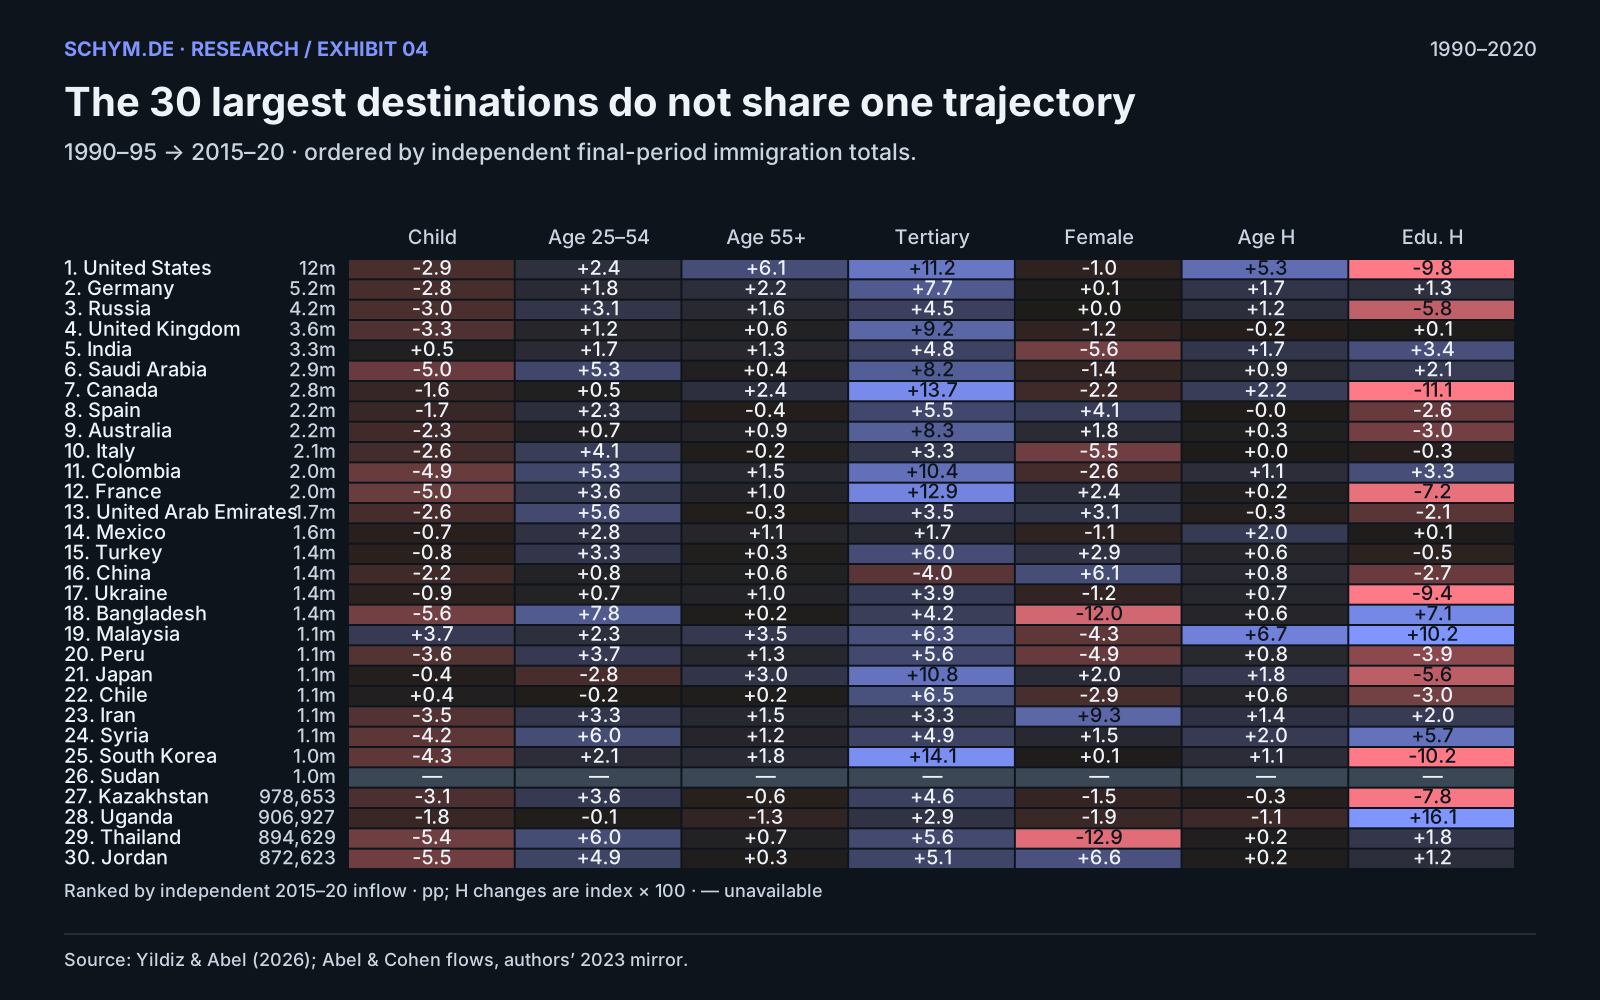
Each cell is a change, not a level. Grey is unavailable. Diversity changes are normalized entropy multiplied by 100.
Source, exact values and downloads
Source: Yildiz & Abel (2026); Abel & Cohen flows, authors’ 2023 mirror. The chart is descriptive; source definitions and coverage are explained in the methods.
Download exact values (CSV, gzip)At the default threshold, 87 destinations had at least 100,000 estimated arrivals in both endpoint periods. Smaller destinations remain in the data, but do not enter this default ranking. The controls allow thresholds of 50,000, 250,000 and 500,000. This is a scale safeguard, not a confidence interval: a large modeled flow can still have an uncertain demographic composition.
Read a Sankey as a partition, not a life history
The first Sankey organizes one destination’s arrivals by sex, then by age, then by education. Its ribbons conserve the estimated share of that single cohort. Children form their own structural education category; they are not coded as adults with no schooling. The source label “No Education” refers to less than completed primary education, which is more precise than taking the label literally.
A ribbon running through two columns does not establish that the same identified people changed educational attainment. It is an aggregate accounting view. The dataset also does not supply an origin-by-age-by-education breakdown, so no destination profile has been assigned to individual migration corridors.
One cohort, three demographic partitions
Selected destination and period · all arrivals sum to 100%.
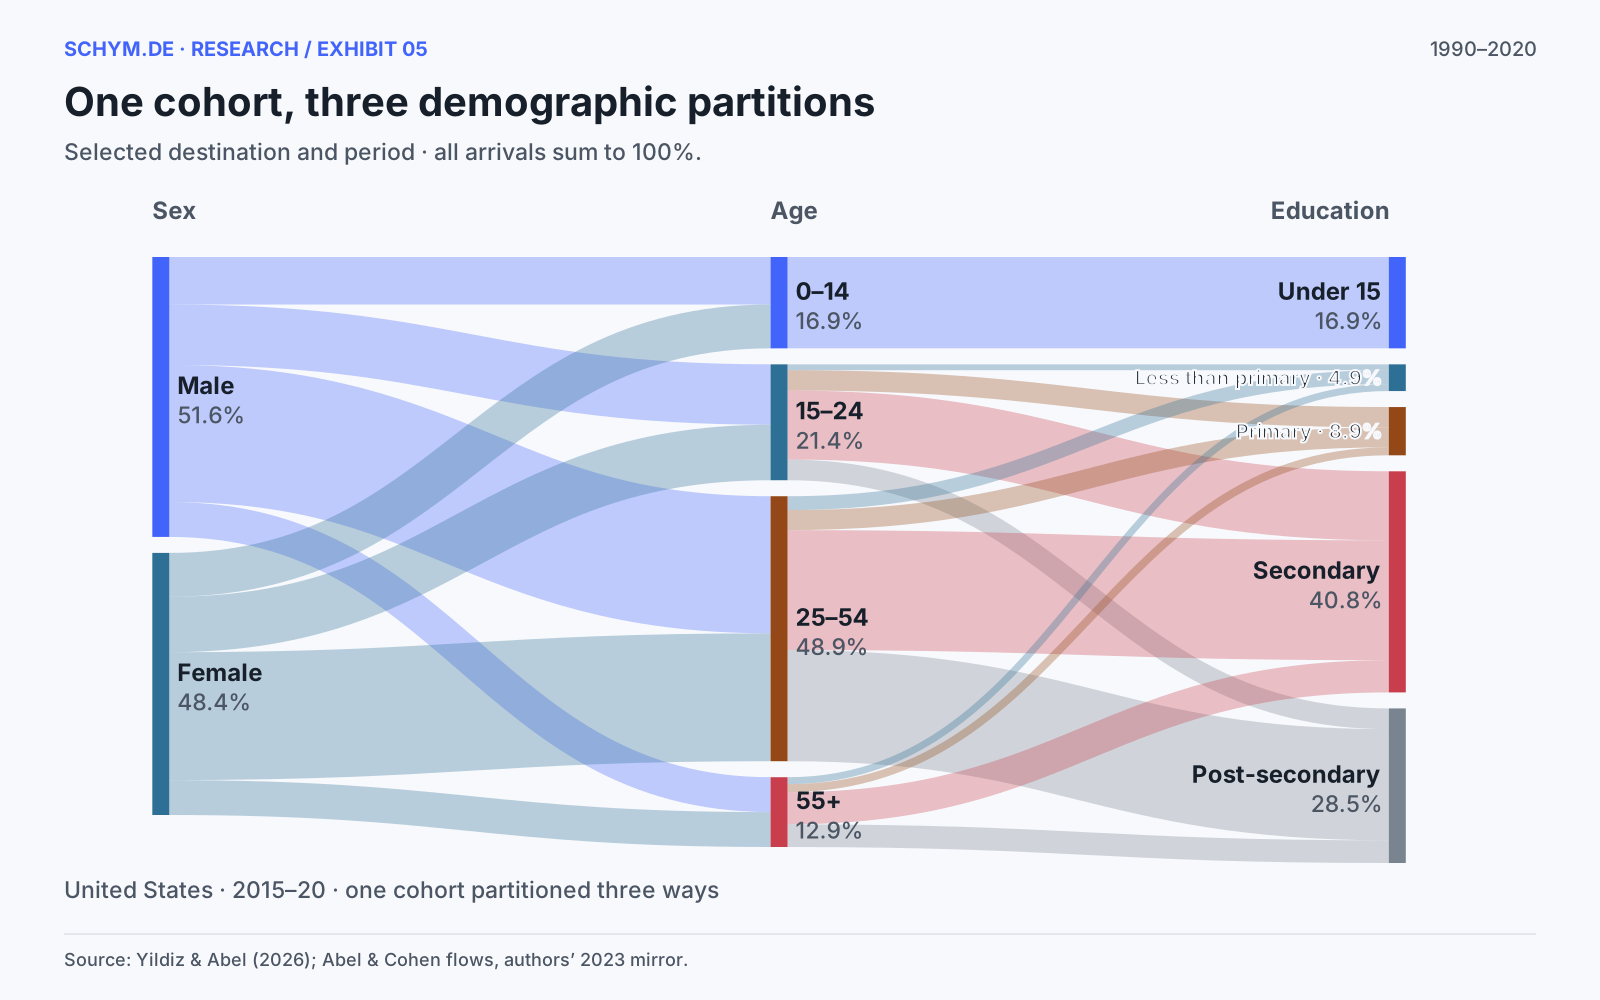
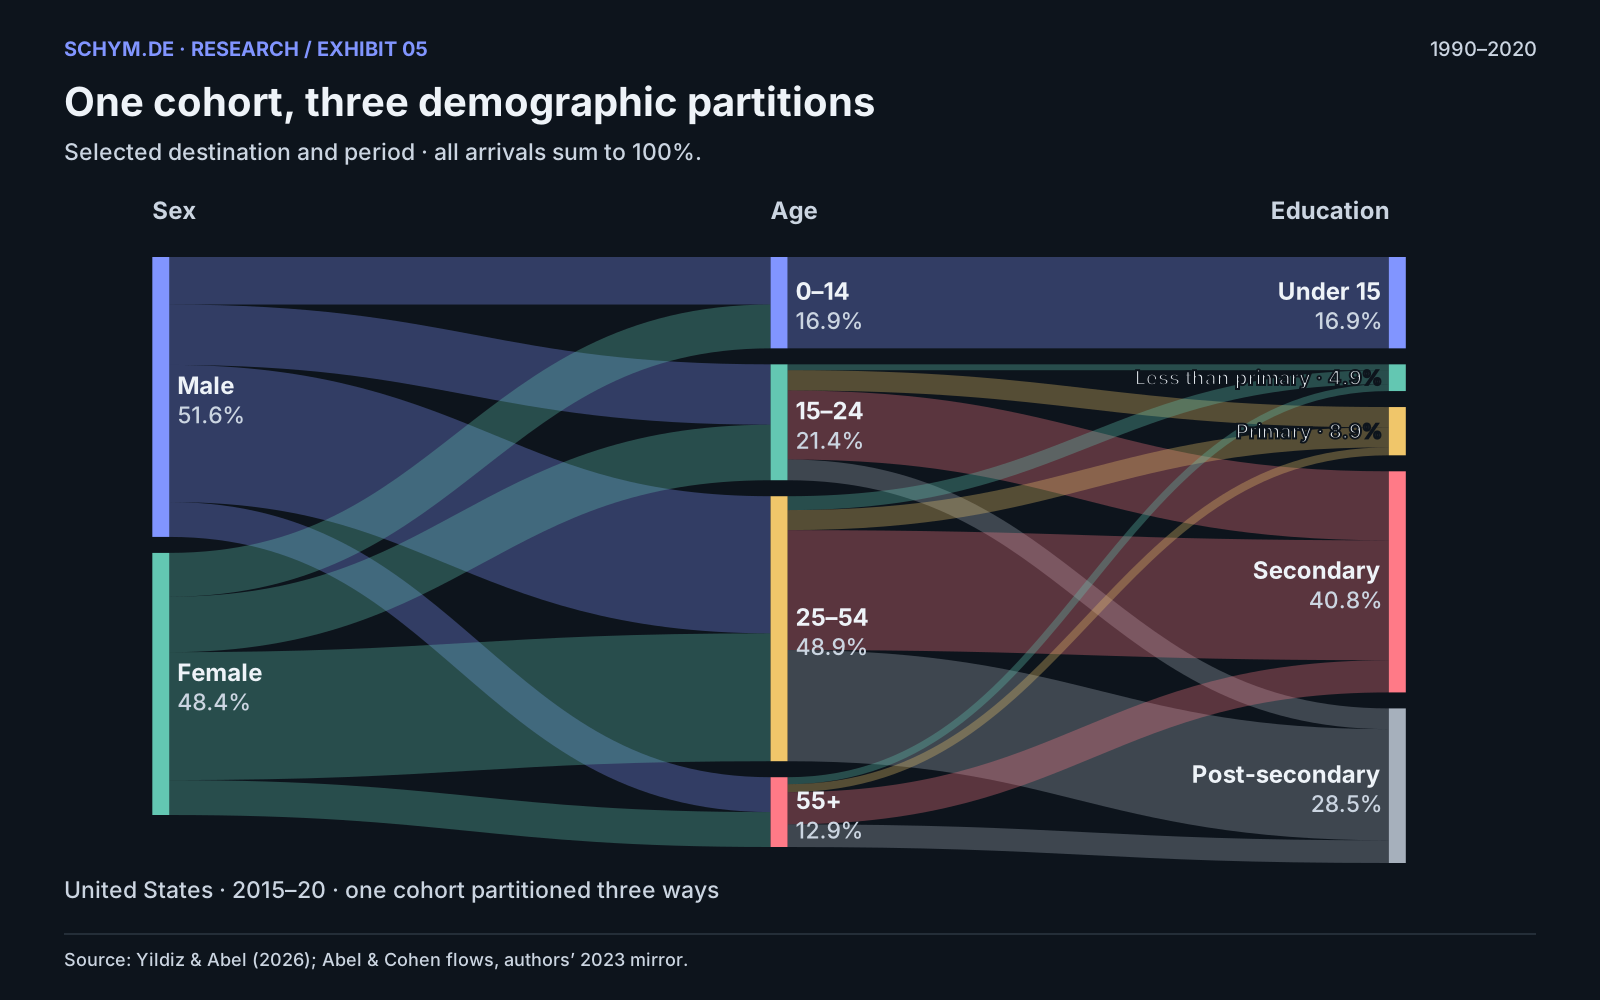
Sex → age → education describes one estimated cohort. It is not evidence that people changed education or migrated between periods.
Source, exact values and downloads
Source: Yildiz & Abel (2026); Abel & Cohen flows, authors’ 2023 mirror. The chart is descriptive; source definitions and coverage are explained in the methods.
Exact values · 2015-2020 (CSV, gzip)Two circular views answer a different question
The circular Sankey separates departure and arrival roles for six broad regions. A region may appear on both sides because it both sends and receives migrants. Each ribbon conserves the independently estimated number of moves from an origin region to a destination region. The two copies are not a claim that regional immigration equals regional emigration.
The directed chord chart retains the source’s 11 regions. It exposes reciprocity and connections within regions, using arrowheads to identify destinations. Internal regional ribbons are still international: they aggregate moves between countries in the same region. The smaller number of sectors makes the main connections readable; the exact matrix remains available for values hidden by overlapping ribbons.
The same region can send and receive migrants
Circular Sankey · six macroregions · independent total-flow estimates.
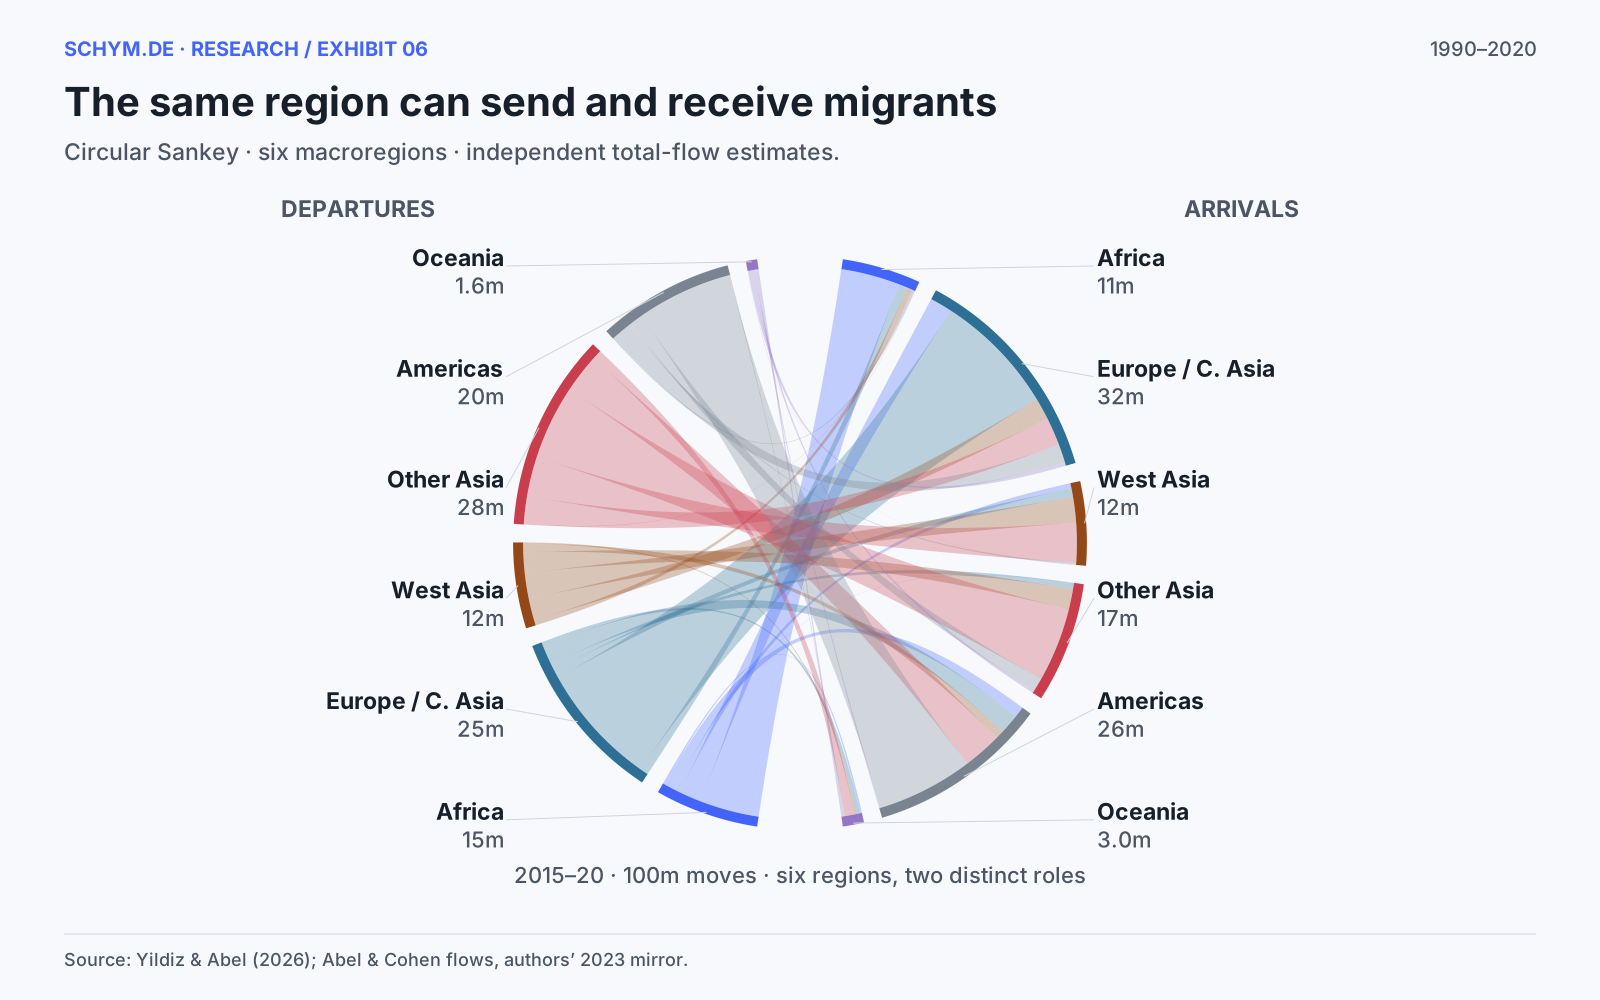
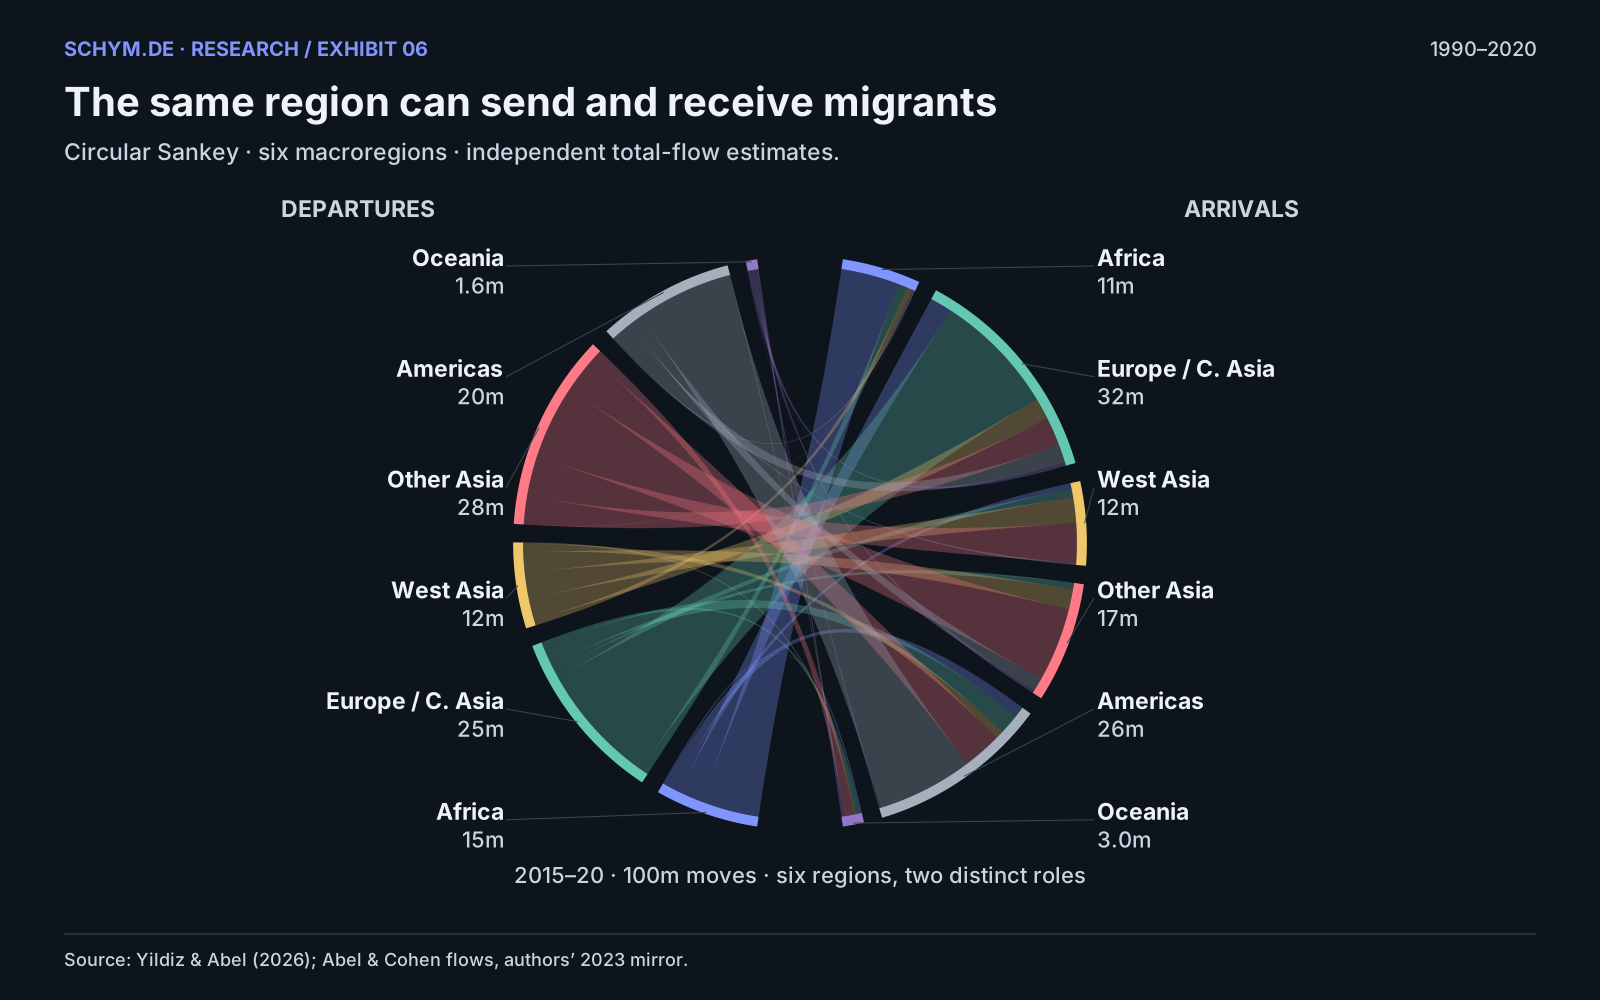
Departure and arrival nodes are separate roles. A returning ribbon does not identify a return migrant or a repeated journey.
Source, exact values and downloads
Source: Yildiz & Abel (2026); Abel & Cohen flows, authors’ 2023 mirror. The chart is descriptive; source definitions and coverage are explained in the methods.
Download exact values (CSV, gzip)Regional migration has direction and reciprocity
Directed chord · 11 source regions · independent total-flow estimates.
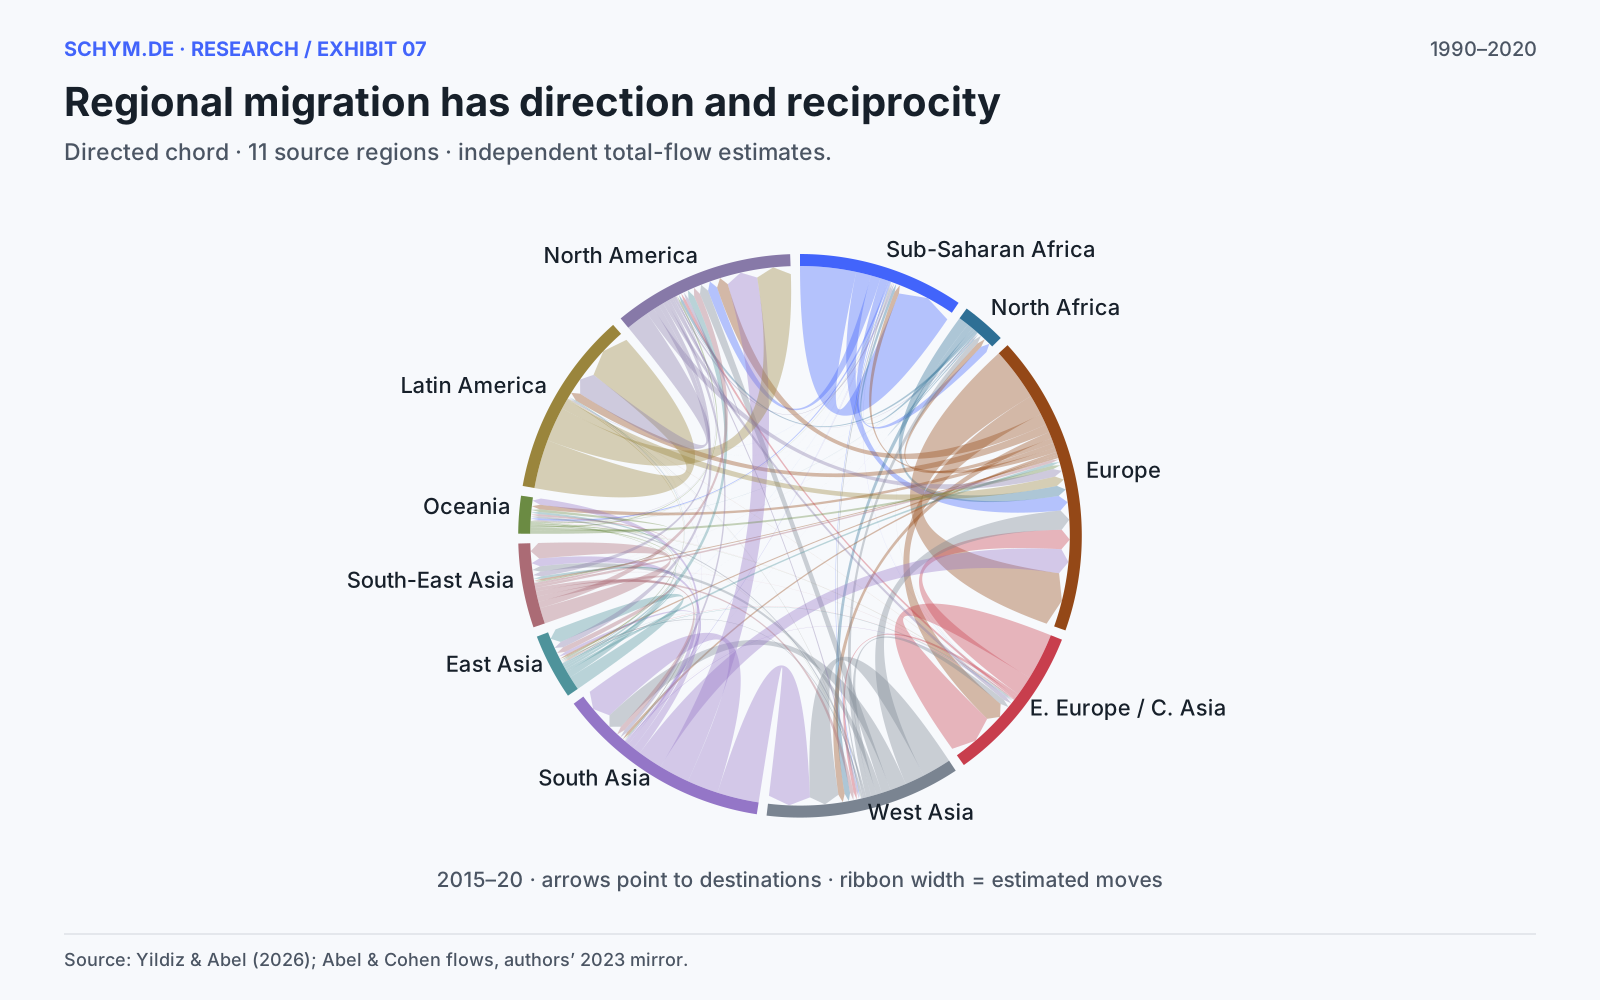
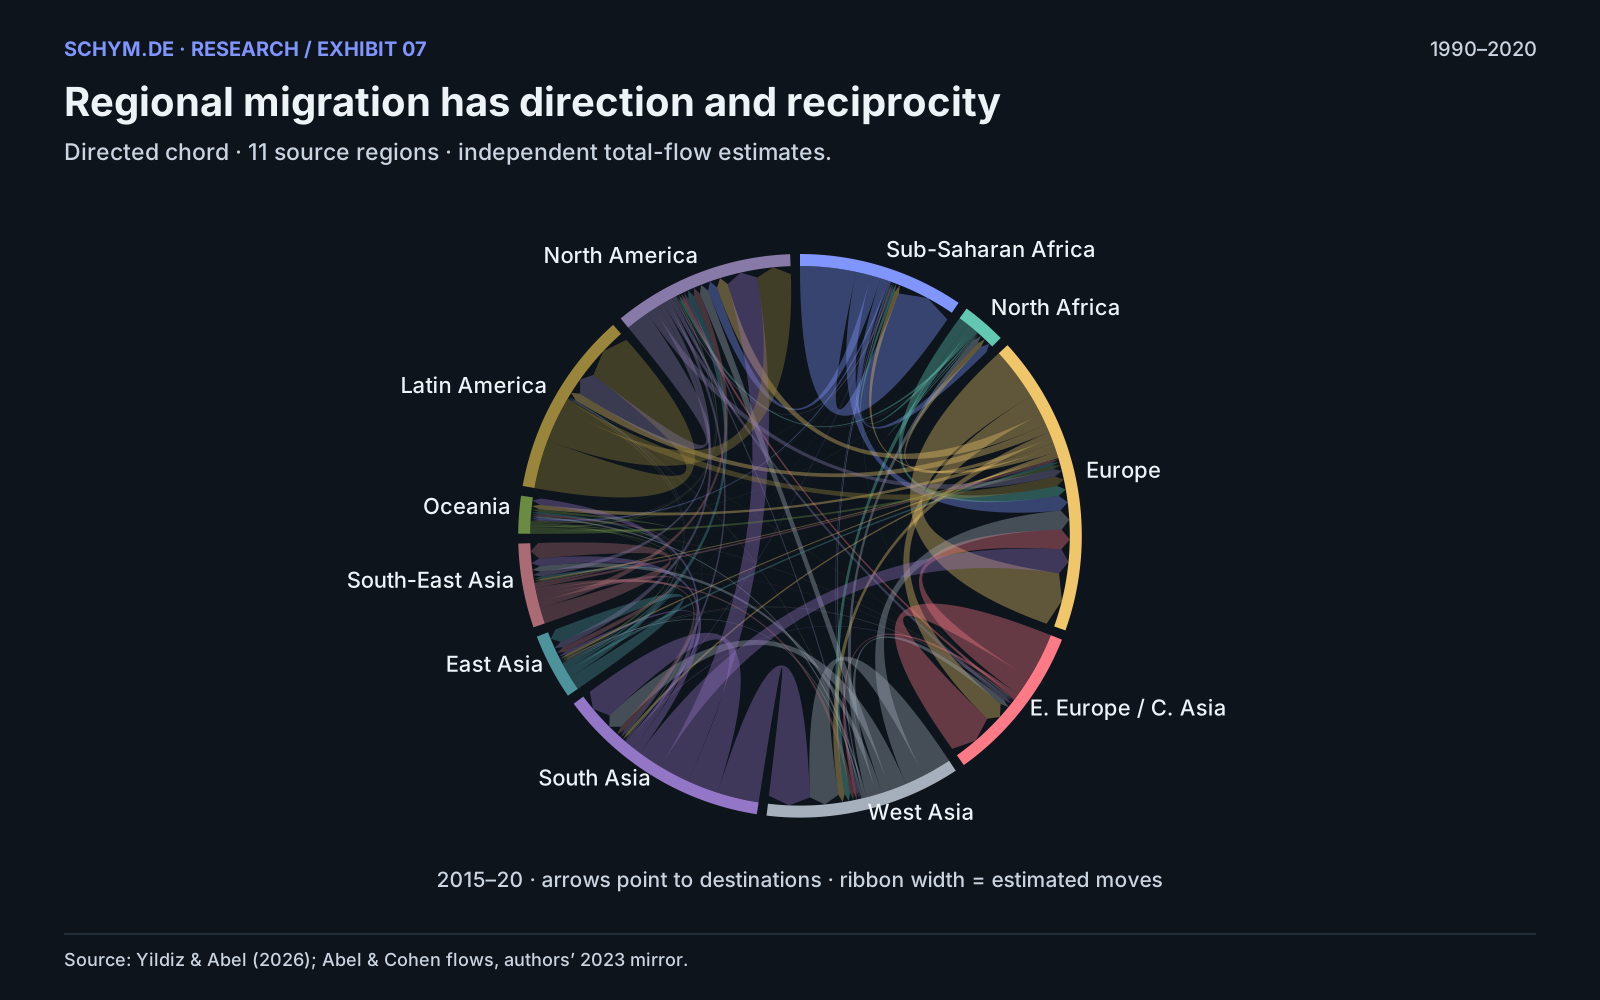
Ribbon colour identifies origin; arrowheads identify destination. Within-region ribbons represent international moves between countries in that region.
Source, exact values and downloads
Source: Yildiz & Abel (2026); Abel & Cohen flows, authors’ 2023 mirror. The chart is descriptive; source definitions and coverage are explained in the methods.
Download exact values (CSV, gzip)A modest volume change can accompany a large composition change
Portugal’s estimated immigration total fell by 1.7% between the endpoint periods. Its tertiary proxy nevertheless rose by 8.3 percentage points. In the United States, the corresponding changes were +9.9% and +11.2 points. These two quantities have different denominators: the first measures a change in the number of arrivals, the second a change in their composition.
A country can experience little change in total immigration while undergoing a profound change in who arrives.
The scatterplot makes the distinction explicit. Its horizontal axis uses a logarithmic ratio so that proportional increases and decreases can be compared without allowing a few fast-growing flows to compress the rest. Its vertical axis remains in ordinary percentage points. It is descriptive evidence; it does not isolate immigration policy, destination demand or changing educational attainment in origin countries.
Stable totals can conceal a different arriving population
Tertiary-share change versus the ratio of five-year immigration totals.
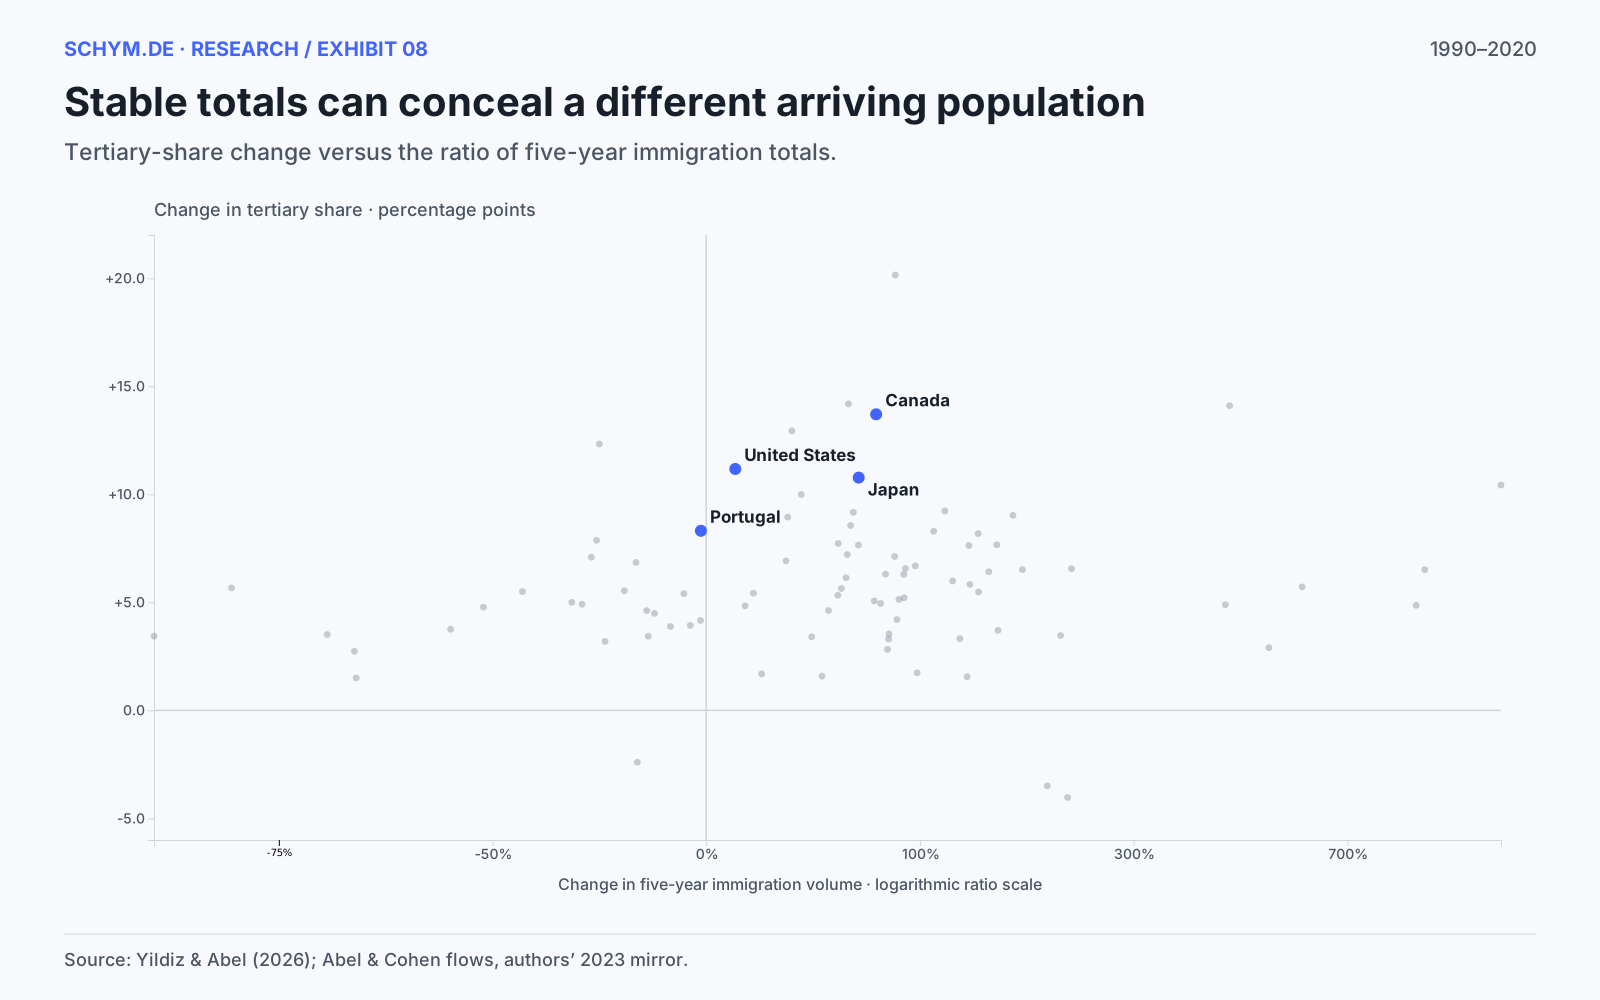
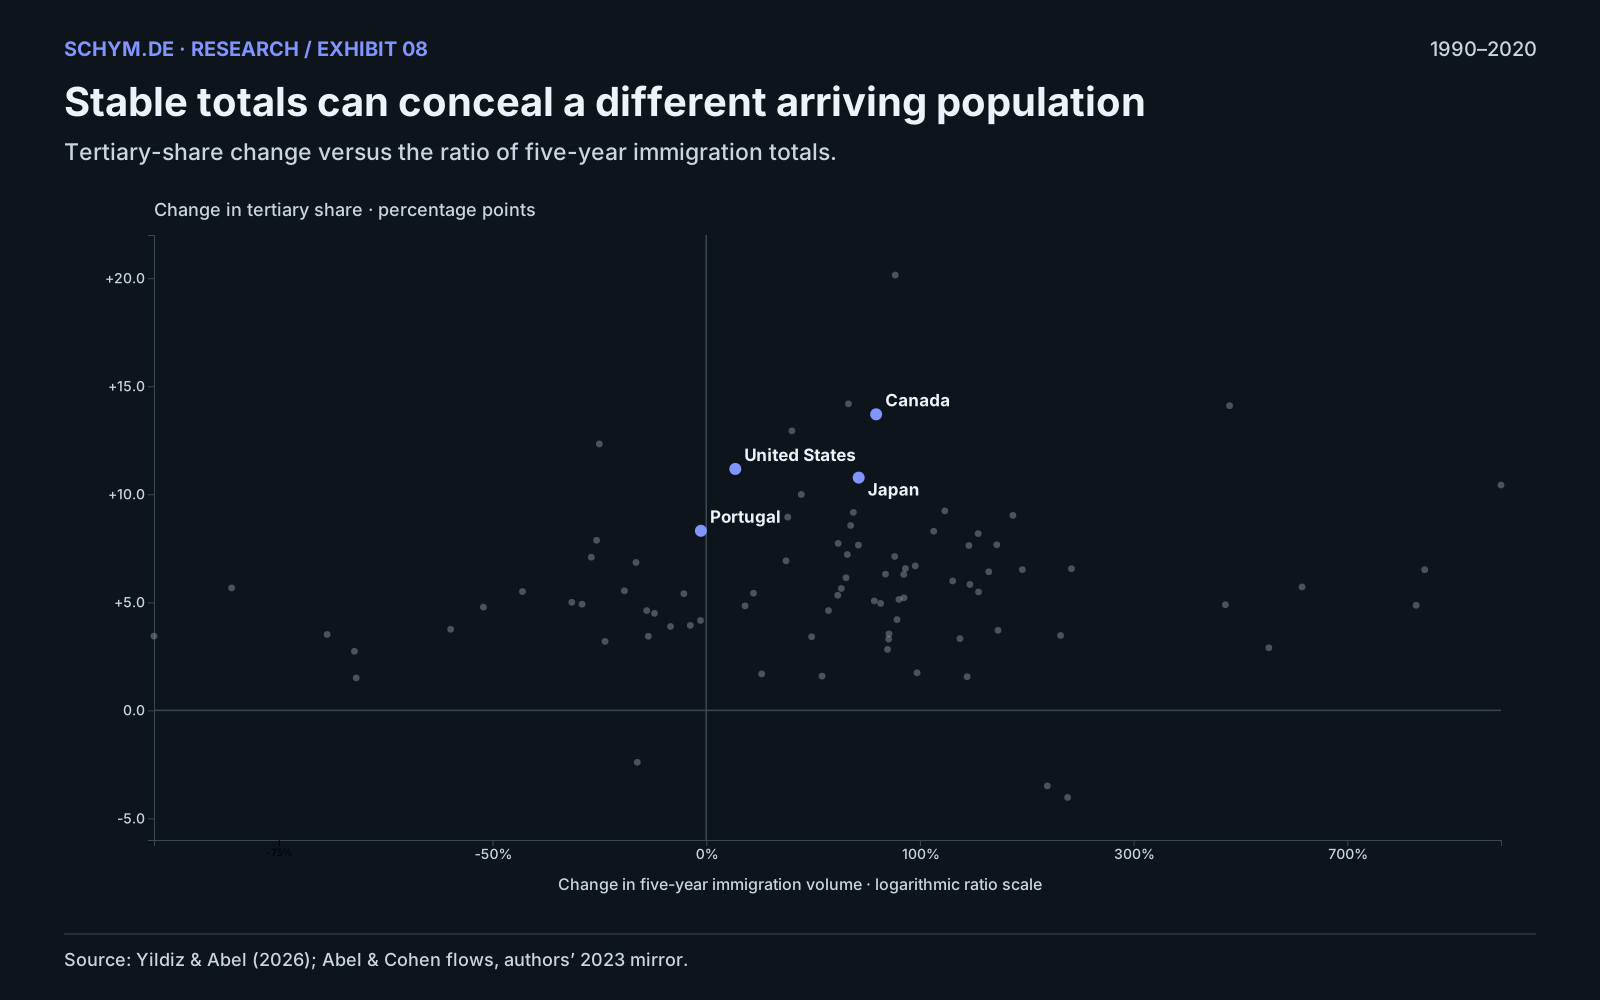
Portugal: −1.7% in volume, +8.3 percentage points in tertiary share. United States: +9.9% in volume, +11.2 points.
Source, exact values and downloads
Source: Yildiz & Abel (2026); Abel & Cohen flows, authors’ 2023 mirror. The chart is descriptive; source definitions and coverage are explained in the methods.
Download exact values (CSV, gzip)More education can reduce educational diversity
The normalized age-diversity index for the pooled balanced sample increased from 0.916 to 0.932. Educational diversity among arrivals aged 25+ fell from 0.983 to 0.948, even as the tertiary share rose. There is no contradiction. Entropy measures the evenness of category shares. If arrivals become more concentrated in secondary and tertiary categories, their educational distribution can become less even while average attainment rises.
The index runs from zero, when everyone occupies one category, to one, when the categories have equal shares. Education uses four attainment groups after restricting the population to age 25+. Age uses all 16 published groups, including the open-ended 75+ category. The level therefore depends on those bins. It should not be interpreted as diversity of origin, a measure of integration or an evaluation of migrants’ contributions.
More education need not mean more educational diversity
Normalized Shannon entropy · open: 1990–95 · filled: selected period.
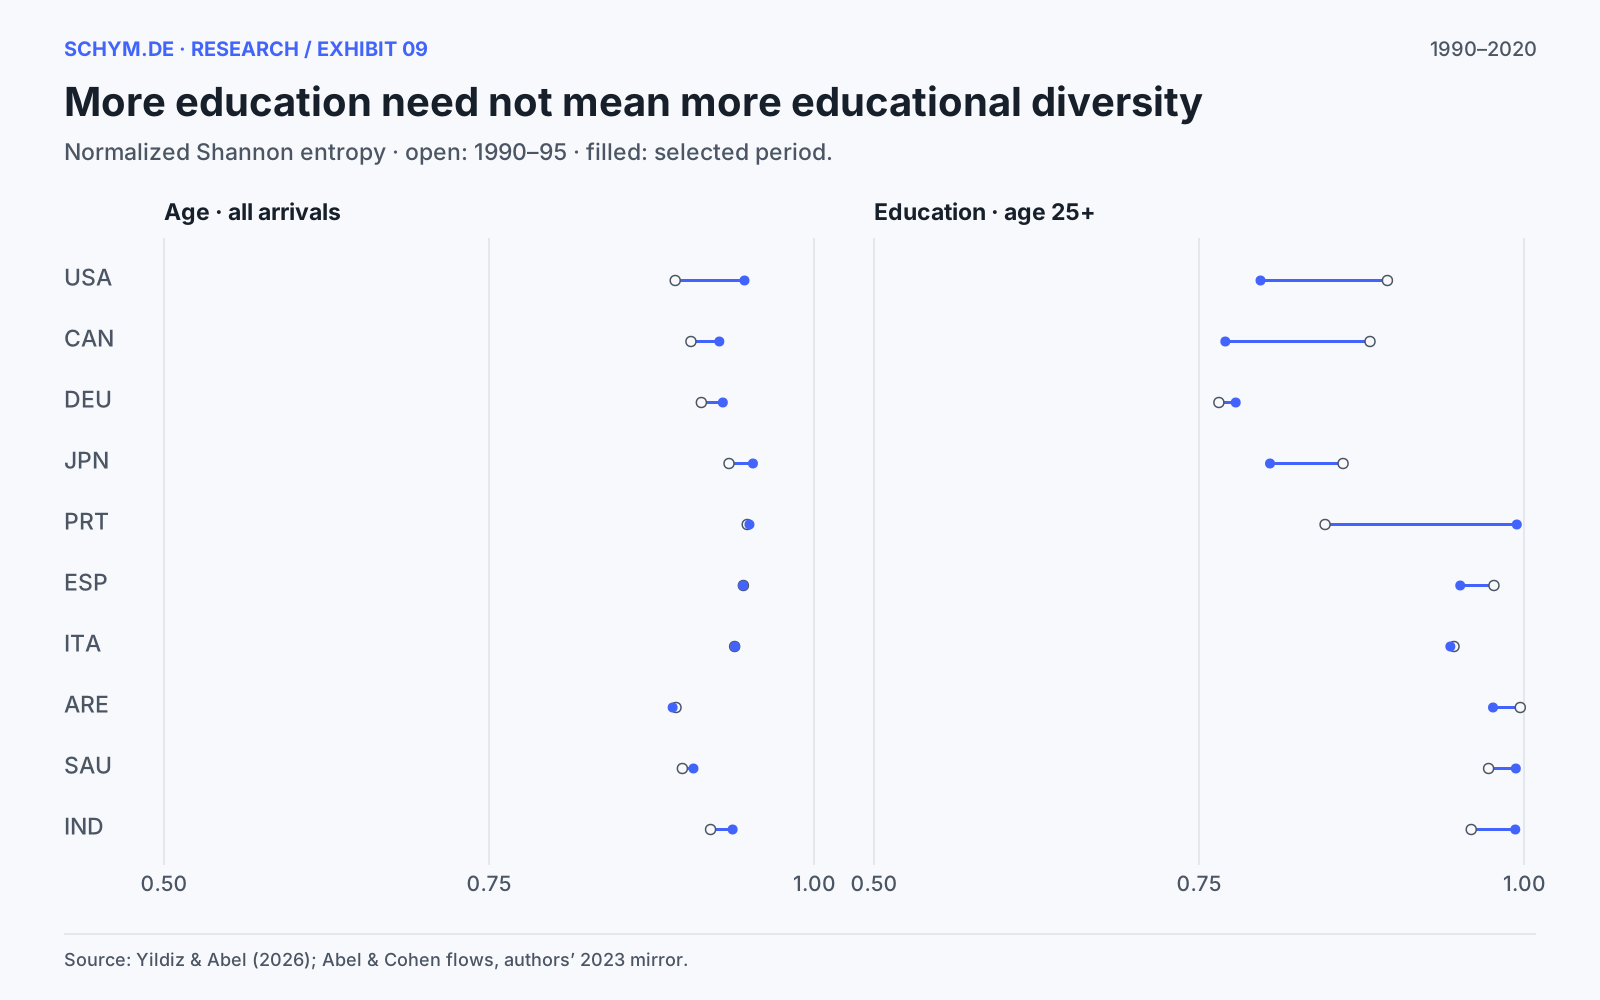
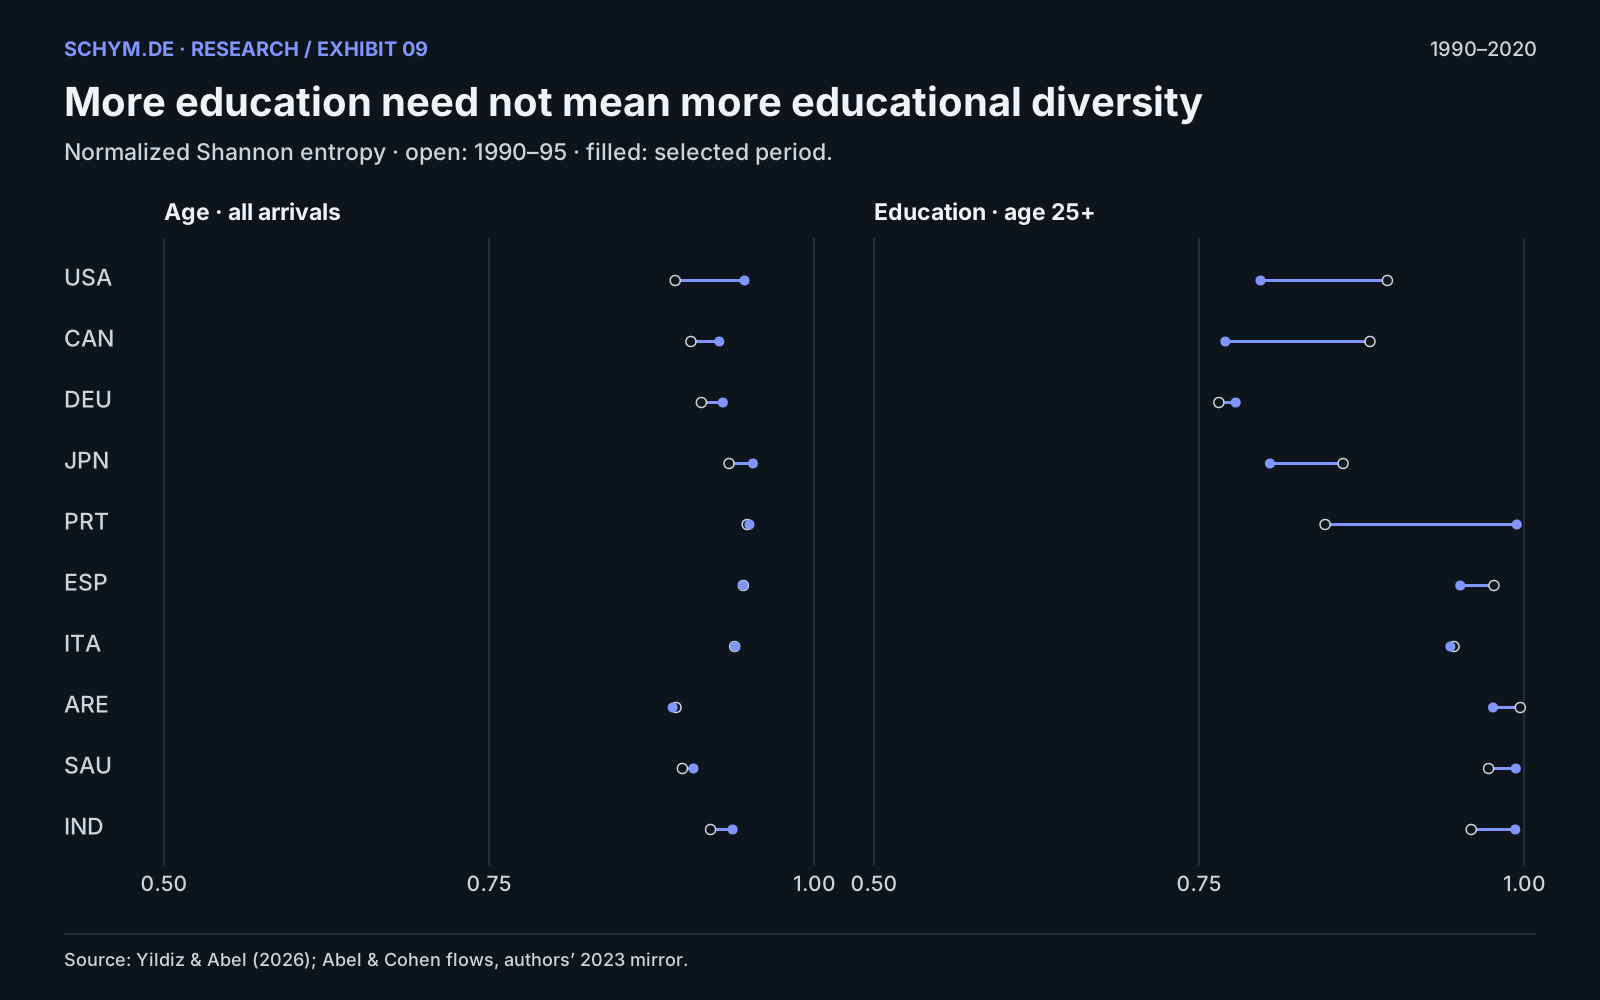
Age uses 16 groups. Education uses four attainment groups among arrivals aged 25+. A value of one means equal shares, not a better outcome.
Source, exact values and downloads
Source: Yildiz & Abel (2026); Abel & Cohen flows, authors’ 2023 mirror. The chart is descriptive; source definitions and coverage are explained in the methods.
Download exact values (CSV, gzip)A multivariate view preserves the composition constraint
Age and education shares cannot vary independently: together they exhaust an arriving population. For the optional multivariate view, the analysis retains 48 cells formed by 12 adult age groups, starting at age 20, and four education categories. Each adult composition is closed to one and transformed using the centered log ratio: the logarithm of each share relative to the geometric mean of the 48 shares.
Principal-component analysis then summarizes the transformed profiles, giving every country-period the same weight. The first two components account for 81.9% and 7.8% of the variance. No artificial positive constant is needed: all retained adult cells are strictly positive after the negligible floating-point corrections elsewhere in the source.
Distances in this view describe relative age–education compositions. They do not measure migration volume, a policy score or progress toward a desirable destination. The component loadings and all scores are supplied with the data so that the statistical summary can be inspected rather than accepted as a label.
Countries move through a common composition space
CLR–PCA · 48 adult age–education cells · equally weighted country-periods.
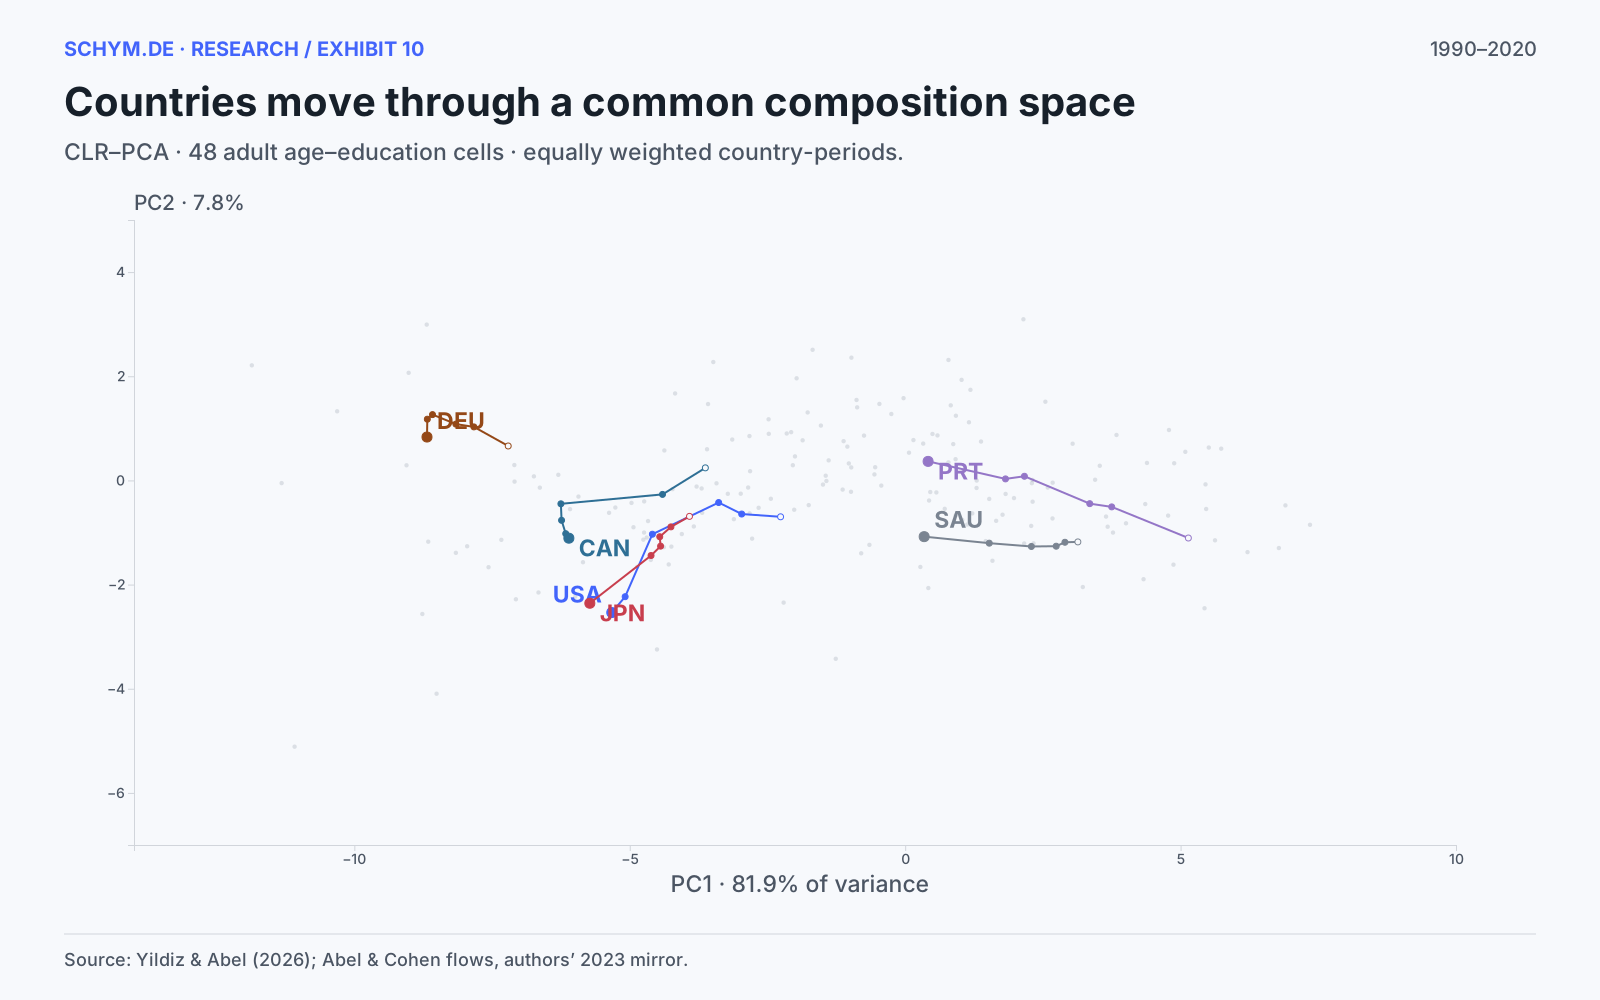
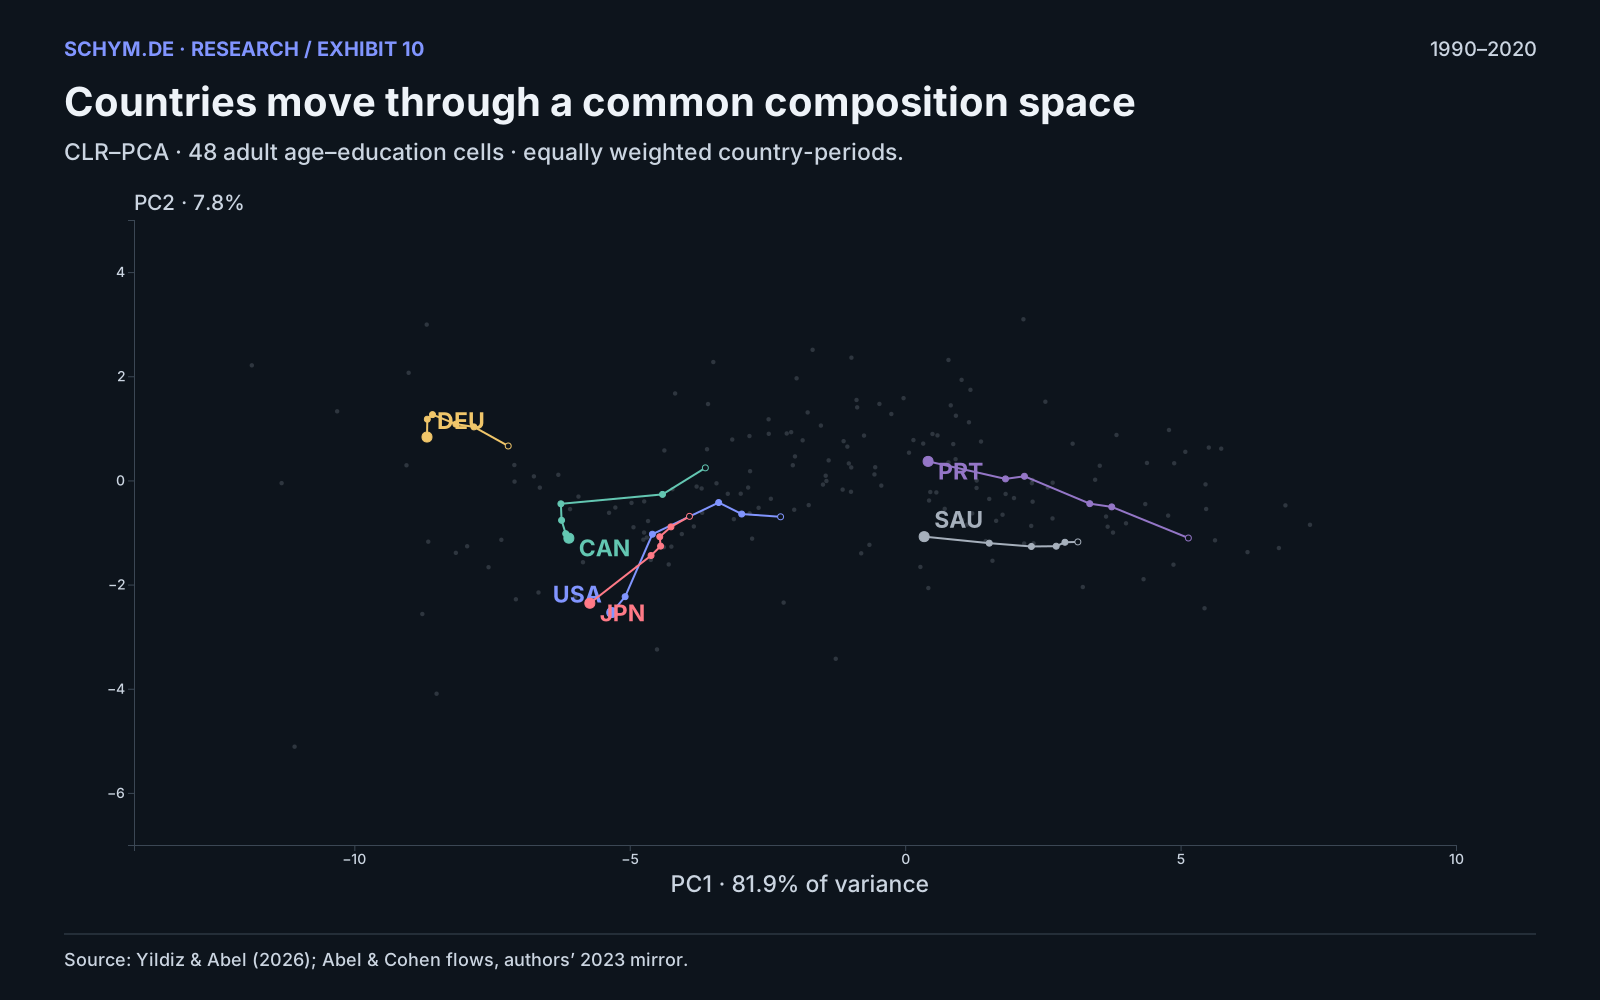
Open dots identify 1990–95; filled endpoints identify the selected period. Trails connect estimates at equal five-year intervals, not individual lives.
Source, exact values and downloads
Source: Yildiz & Abel (2026); Abel & Cohen flows, authors’ 2023 mirror. The chart is descriptive; source definitions and coverage are explained in the methods.
Download exact values (CSV, gzip)Most of the global education shift happens within destinations
A rising global tertiary share could reflect changing profiles within countries, a shift of migration toward more highly educated destinations, or both. An exact symmetric decomposition separates these contributions. It attributes each destination’s change in share using its average endpoint flow weight, and each change in destination weight using its average endpoint share.
Of the 8.05-percentage-point increase in the pooled tertiary proxy, 6.65 points come from changes within destinations and 1.40 points from changes in their relative immigration weights. The within-destination component accounts for about 83% of the increase. This is an accounting result. It does not establish the causal mechanism behind either term.
Most of the global education shift occurs within destinations
Exact symmetric decomposition · 179 balanced destinations · 1990–95 → 2015–20.
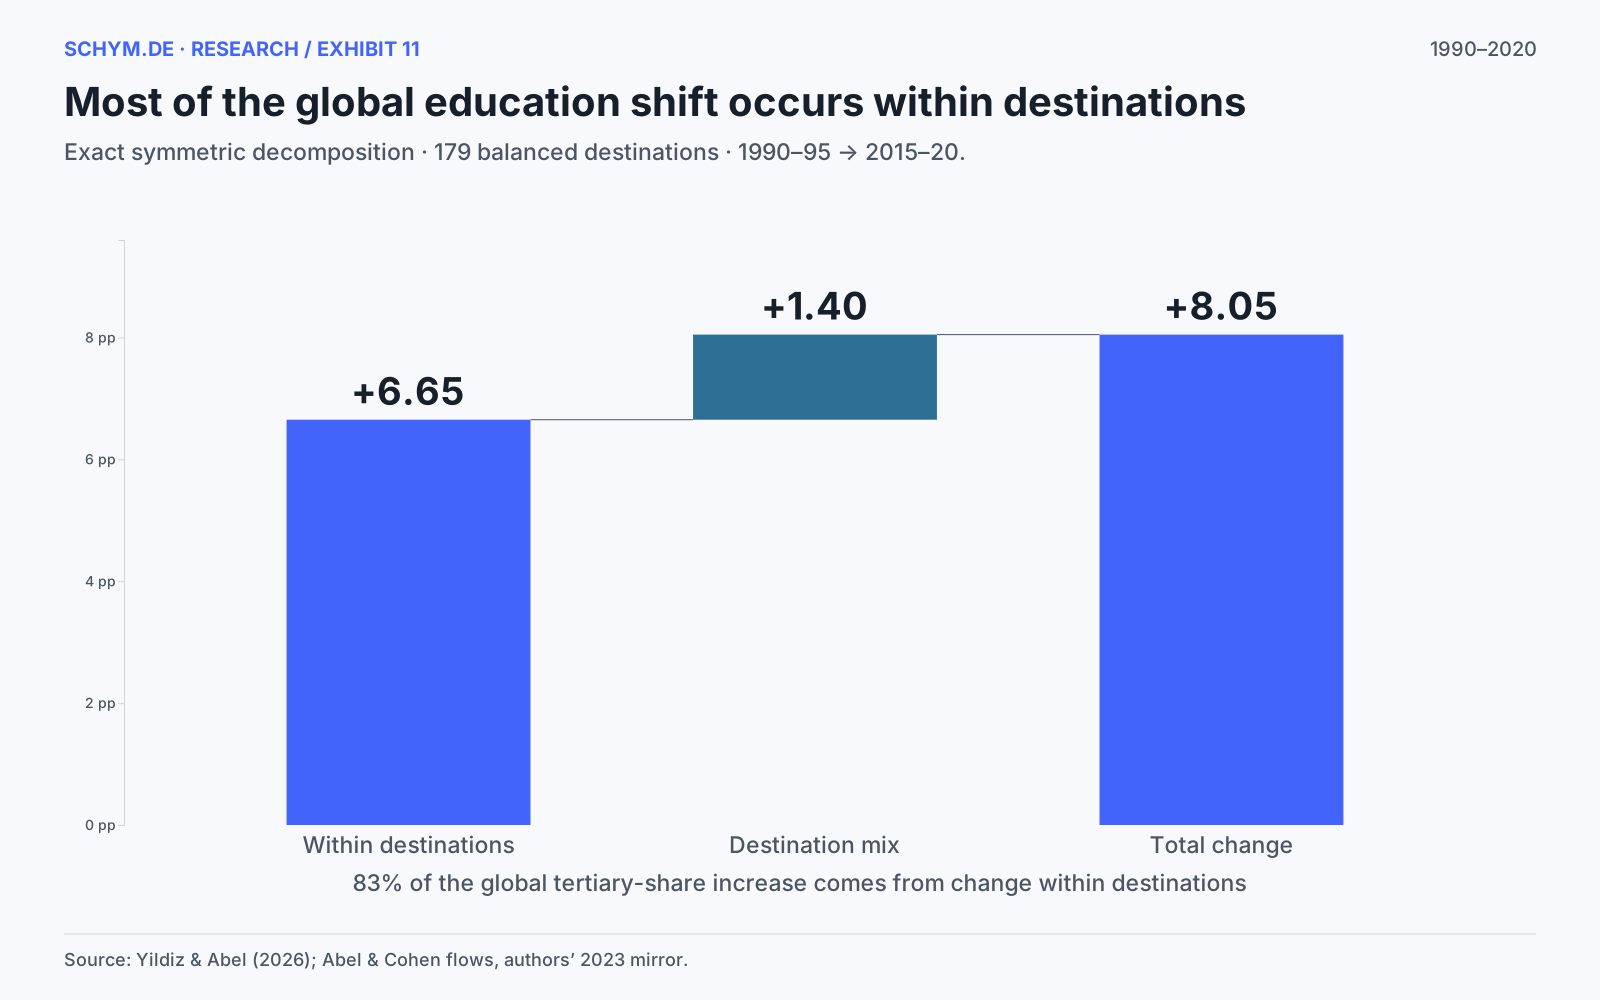
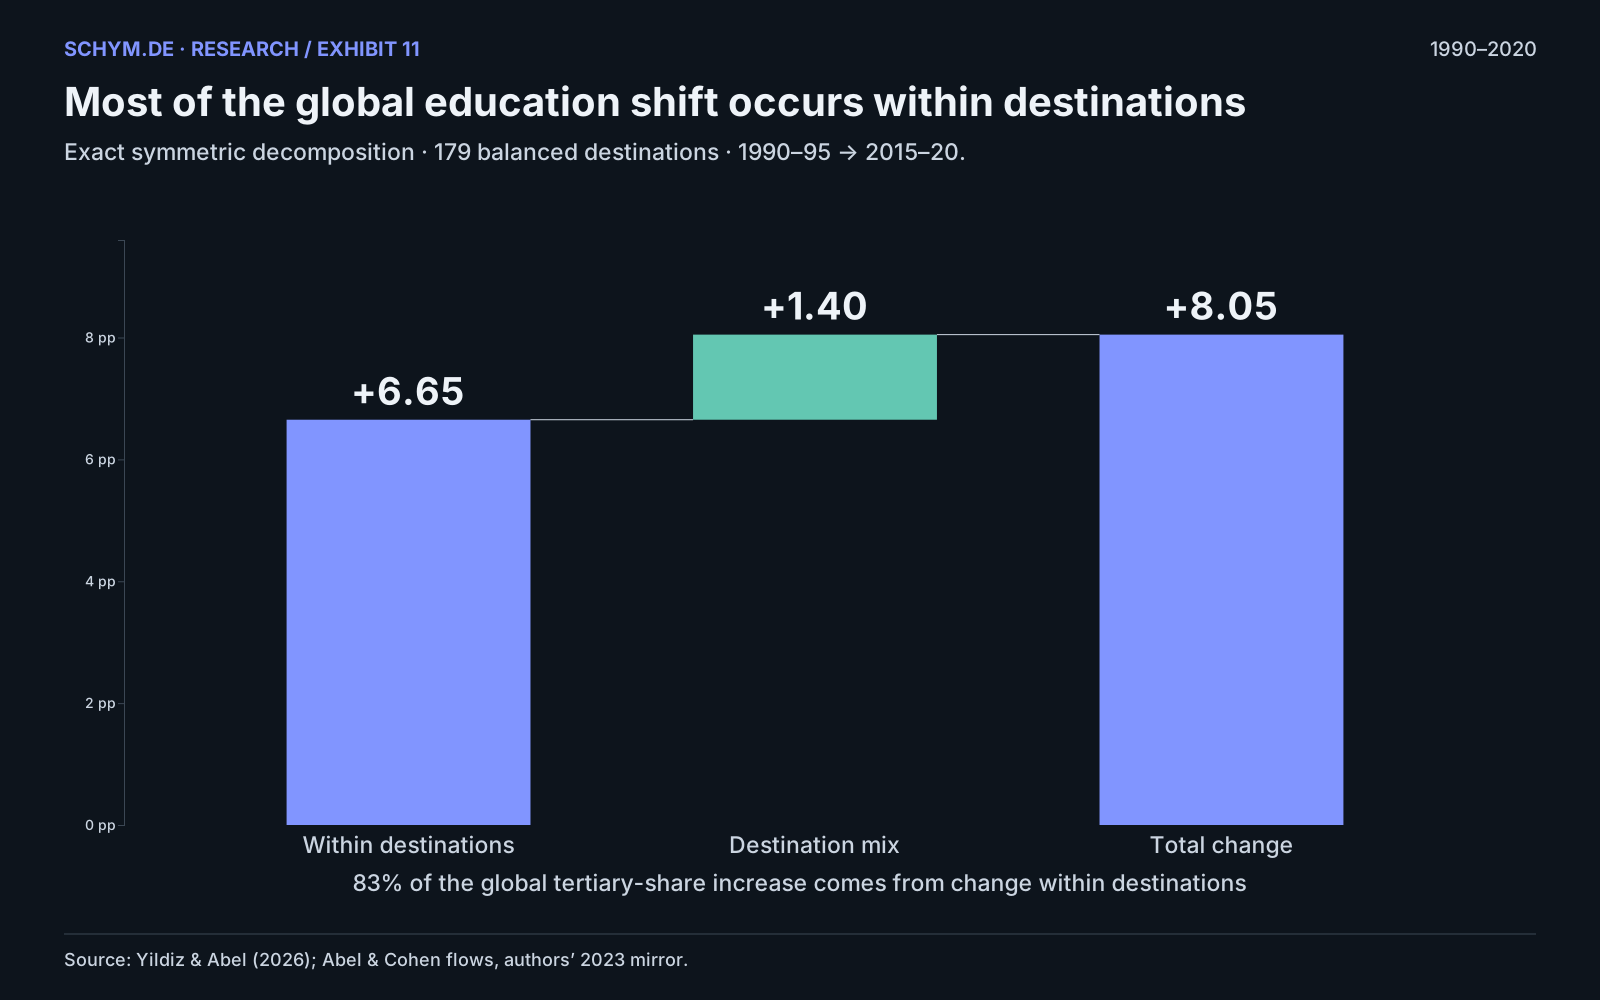
Within-destination change contributes 6.65 points; shifting destination weights contribute 1.40 points. This is accounting, not causation.
Source, exact values and downloads
Source: Yildiz & Abel (2026); Abel & Cohen flows, authors’ 2023 mirror. The chart is descriptive; source definitions and coverage are explained in the methods.
Download exact values (CSV, gzip)A complete grid of predictions is not a complete grid of observations
The source combines census information with a model designed to estimate countries and periods where direct information is sparse. The published supplement lists 143 census samples across 74 countries. The atlas distinguishes destinations represented in that list from destinations without a listed local sample. All displayed composition estimates remain modeled values, including those for census contributors.
The United States has five listed samples and Canada two. Germany, Japan and the six GCC states have none in this list. That is a meaningful warning about evidence coverage, but it is not a calibrated uncertainty measure. Country-level sample presence also does not guarantee direct observations in either endpoint period.
The source CSV contains 123,090 rows. Every present country-period-sex group has the expected 55 age–education cells, and its shares sum to one within a maximum error of 3.11 × 10⁻¹⁵. There are no missing values inside existing rows and no duplicate keys. The 274 tiny negative entries are floating-point residues, no lower than −7.14 × 10⁻¹⁷; clipping them to zero and renormalizing changes no substantive result.
Missing groups still matter. Fifteen destinations appear only in the final period, leaving 150 missing country-period-sex groups, equivalent to 8,250 missing joint cells. Five further destinations lack a usable matched early flow total under consistent geographical identifiers. These cases are excluded from the balanced comparison, not assigned zero composition.
The source includes a very small amount of post-secondary mass at ages 15–19. The main tertiary proxy excludes it to follow the paper’s age-20 interpretation. Its largest country-period effect is 0.0343 percentage points. The partition Sankey preserves the published categories, while the exact data retain both original and adjusted shares.
The late-period direction is steadier than the country ordering
Dropping 2015–20 and instead ending in 2010–15 leaves the sign of the tertiary-share change unchanged in 97.7% of the 87 default eligible destinations. The correlation between the two absolute-change rankings is 0.922. For the 55+ share, direction agreement is lower, at 81.6%, and the ranking correlation is 0.784. These are sensitivity checks, not validations against ground truth.
The exercise also substitutes a demographic-accounting minimum-flow sex series for the preferred pseudo-Bayesian sex weights. The largest effect on the measured tertiary-share change is 1.32 percentage points among eligible destinations. The female-share results are much more sensitive because the entire measure comes from those sex weights. A precise female-share league table would overstate what this exercise establishes.
External statistics show a specific model weakness
Eurostat’s recorded immigration composition offers a useful, incomplete benchmark. Pooling annual 2015–19 observations provides five years of immigration by age and sex for Germany, Italy, Spain and Denmark. Germany, Italy and Spain use completed age; Denmark’s available series uses age reached during the year. These definitions and the relationship between annual recorded moves and five-year modeled transitions prevent an exact like-for-like validation.
Even with that qualification, the discrepancies are informative. For women arriving in Germany, the modeled 55+ share is 10.2%, against 5.1% in the pooled Eurostat series. For women arriving in Denmark, it is 11.5% against 3.8%. The model therefore overstates older arrivals by about 5.0 and 7.7 percentage points in those comparisons. The direction of a broad modeled age shift should not be mistaken for precise knowledge of every destination’s age profile.
The model can overstate older arrivals
Eurostat 2015–19 pooled flows versus the modeled 2015–20 profile.
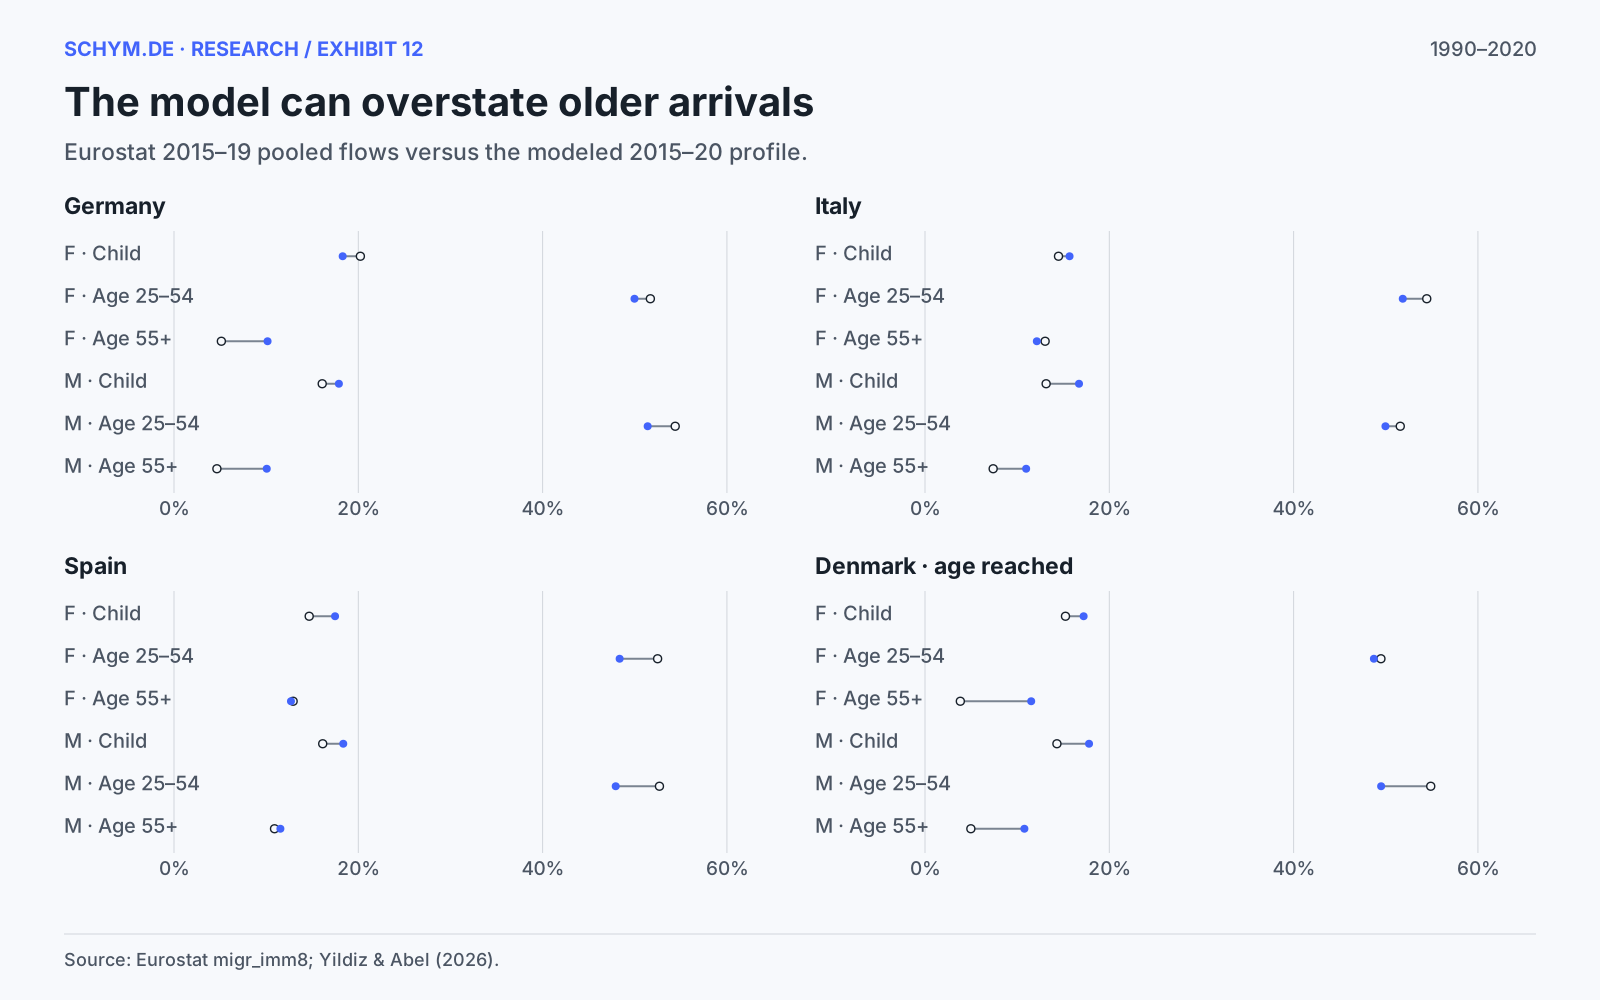
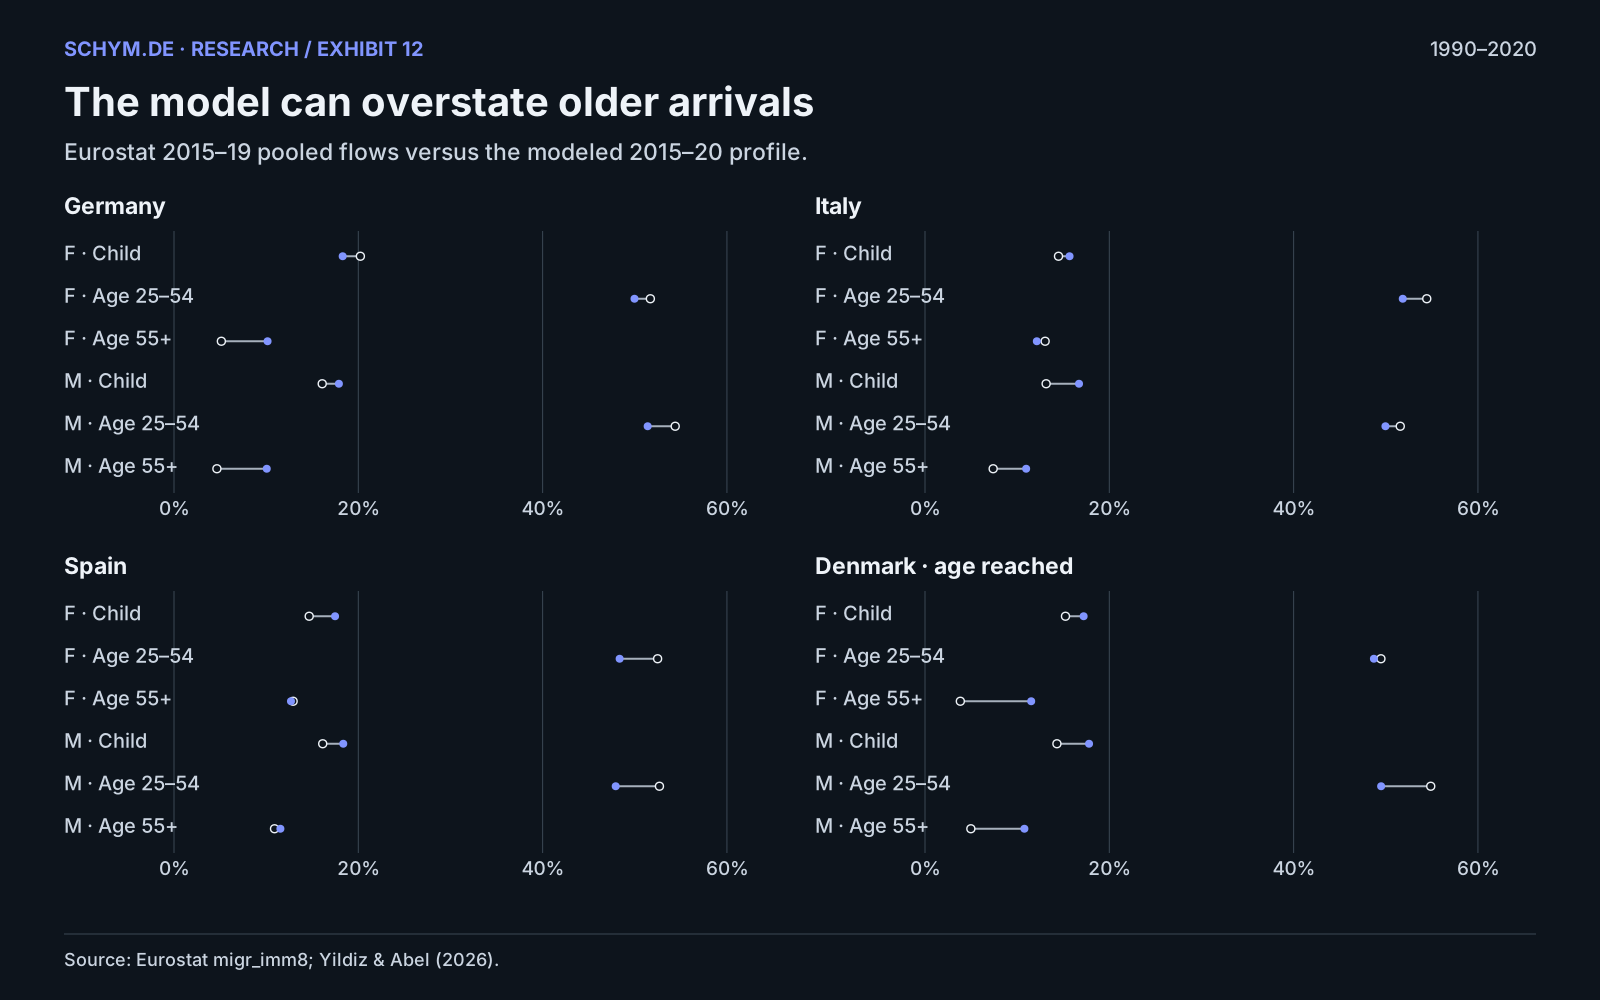
Open: Eurostat. Filled: model. Shares are within sex. Denmark uses age reached during the year; the other countries use completed age.
Source, exact values and downloads
Source: Eurostat migr_imm8; Yildiz & Abel (2026). The chart is descriptive; source definitions and coverage are explained in the methods.
Download exact values (CSV, gzip)The implication is a better question
An immigration total answers how many people are estimated to have arrived. It does not tell us their ages, qualifications or sex composition. Those characteristics can move considerably even where the total changes little.
The defensible reading of this exercise is that the modeled global arriving population became more educated and shifted away from childhood toward adult ages between 1990–95 and 2015–20. The national patterns differ, and their precision depends on uneven source evidence and external flow weights. A serious account of immigration needs to ask both how many arrive and who arrives.
Definitions that travel with the charts
Conditional denominators
For country c, period t and sex s, the published age–education cells sum to one. Combined shares multiply those cells by independent female or male flow fractions. Total-flow magnitudes come from a separately estimated total series.
Independent flow vintage
Abel–Cohen pseudo-Bayesian closed estimates, frozen from the authors’ IIASA explorer repository at commit 8ffca255dc15d149d1fc804963d519d29d47d693. The flow files were last committed on 28 April 2023. The newer Figshare download was inaccessible during this exercise; these are not advertised as the latest UN input vintage.
Global weights and ranks
Global results use 179 balanced destinations. Rankings require positive matched estimates and at least 100,000 arrivals in both endpoints by default. The heatmap uses the independently ranked 2015–20 top 30. Missing baselines remain unavailable.
Diversity and PCA
H = −Σp log(p) / log(K). Age: K=16. Education: K=4 among 25+. PCA uses CLR-transformed 20+ age–education profiles, 48 cells, all 1,074 balanced country-period profiles, equal weights and no extra variance scaling.
The source does not identify the age or education of migrants from each origin to each destination. The world map combines two independently sourced layers, joined only at destination and period. Curved map paths are geographic connectors, not observed travel itineraries. Boundaries are cartographic reference features, not territorial claims.
Downloads contain the full share audit, missing-cell report, country rankings for every measure, flow reconciliation, census coverage, sensitivity summaries, PCA loadings and exact chart tables. The supplied analysis rebuilds results from the published prediction file. It does not refit the source model, whose private census inputs are not redistributed.
Sources
-
Yildiz & Abel: immigration composition and R scripts, Zenodo record 20814220, version 2. Exact file: Immigration_composition_by_RCSL_20260520.csv. Retrieved 8 September 2026. CC BY 4.0.
-
Yildiz & Abel (2026), source methodology, Scientific Data. DOI: 10.1038/s41597-026-07969-8. Includes the published census-sample supplement.
-
Abel & Cohen (2019), Bilateral international migration flow estimates for 200 countries; Abel & Cohen (2022), updated and refined by sex. Independent flow methodology based on demographic accounting and UN migrant-stock inputs.
-
Authors’ IIASA migration explorer repository, frozen commit. Complete country matrices extracted once; aggregate region nodes excluded from country totals. Data files last changed 28 April 2023.
-
Eurostat migr_imm8: immigration by age and sex. Annual 2015–19; retrieved 8 September 2026. Definition differences retained in the benchmark table.
-
Natural Earth, public-domain cartographic geometry. D3.js 7.9.0, ISC licence, embedded for offline use. Inter font under the SIL Open Font License.
The precision has limits.
The distinction still matters.
Source support is uneven
The census inventory identifies 143 samples in 74 countries. A listed census improves the visibility of the evidence base; it does not turn a modeled country profile into a direct observation or provide a confidence interval.
The flow vintage is frozen
The independently estimated flow matrices come from the authors’ 2023 mirror. Newer Figshare downloads were inaccessible during the analysis. This article does not claim to use the latest UN input vintage.
Age estimates can differ materially
The modeled female 55+ share exceeded the pooled Eurostat benchmark by about 5.0 percentage points in Germany and 7.7 in Denmark. Differences in definitions prevent an exact validation, but the discrepancy deserves attention.
Reproduce and inspect
Reproduce the analysis (ZIP) · Validation results · Full methods · Source register · Reviewed data snapshot · Data version and checksums. Each exhibit supplies its exact-value table.
Keep the number.
Add the composition.
The total remains essential. The arriving population’s age, education and sex composition answer a different question. Understanding immigration requires both.
Explore more data stories →