ESS-01 / Institutions and trust / 2002-2024
Police and politicians
A trust gap in every country.
A different history in each.
Police receive higher trust ratings in all 30 latest-round countries. Where the difference widened depends on the country, the period, and the sample.
Read the evidenceCountries with a positive police–politician gap.
95% interval 2.63-2.68 on the 0-10 trust scale.
2002-2024, with explicit design and item boundaries.
The state receives more than one verdict
In every one of the 30 countries in the latest integrated European Social Survey, respondents give the police a higher average trust score than politicians. The difference is positive even at the lower end of each country's pointwise 95% confidence interval. That is a strong descriptive regularity. It is not evidence that every respondent prefers the police, that police performance is superior, or that one mechanism explains the result everywhere.
On the same 0-10 scale, the equally weighted average of the 30 national paired differences is 2.65 points, with a 95% interval of 2.63-2.68. Weighting respondents to reflect national population sizes instead produces 2.83 points, with an interval of 2.78-2.88. These answer different questions. The first gives each participating country an equal voice; the second gives larger national populations more influence. Neither represents all of Europe.
The distinction matters because the object called “trust in the state” contains several institutions. People may believe that the police will perform a recognizable task while doubting the motives, competence, or responsiveness of politicians. That is a possible interpretation of the gap, not a mechanism identified by these data. Institutions differ in their duties, visibility, political exposure, and relationships with citizens. A survey rating cannot hold those differences constant.
Loading the selected evidence...
The country in view
France
2023/24 / Round 11
- Police
- 6.35
- Politicians
- 3.74
- Paired difference
- +2.62
0-10 trust scale. Difference: 2.47 to 2.76 points, 95% confidence interval. 1,749 paired answers. All eligible interviews.
Figure 01
One country, two institutional judgments
2023/24. The same paired answers, seen as a landscape or aligned ratings. Both institutional scales run from 0 to 10; all whiskers are pointwise 95% intervals.
Higher trust in police than politicians. Distance between the two ratings is not the same as either rating alone.
Hover or use the arrow keys to inspect. Click or tap to pin; Escape releases. Every view retains pointwise 95% confidence intervals and an exact-value table.
Exact estimates, intervals and samples
| Country / group | Period | Measure | Estimate | 95% interval | n |
|---|---|---|---|---|---|
| Spain | 2023/24 | Police | 6.92 | 6.78 to 7.05 | 1,826 |
| Spain | 2023/24 | Politicians | 2.77 | 2.64 to 2.89 | 1,826 |
| Spain | 2023/24 | Paired difference | 4.15 | 4.00 to 4.30 | 1,826 |
| Estonia | 2023/24 | Police | 7.36 | 7.23 to 7.49 | 1,268 |
| Estonia | 2023/24 | Politicians | 3.44 | 3.31 to 3.57 | 1,268 |
| Estonia | 2023/24 | Paired difference | 3.92 | 3.78 to 4.06 | 1,268 |
| Portugal | 2023/24 | Police | 6.32 | 6.16 to 6.49 | 1,354 |
| Portugal | 2023/24 | Politicians | 2.88 | 2.73 to 3.03 | 1,354 |
| Portugal | 2023/24 | Paired difference | 3.44 | 3.26 to 3.63 | 1,354 |
| Croatia | 2023/24 | Police | 5.40 | 5.24 to 5.55 | 1,539 |
| Croatia | 2023/24 | Politicians | 1.99 | 1.87 to 2.10 | 1,539 |
| Croatia | 2023/24 | Paired difference | 3.41 | 3.28 to 3.54 | 1,539 |
| Lithuania | 2023/24 | Police | 6.84 | 6.68 to 7.00 | 1,338 |
| Lithuania | 2023/24 | Politicians | 3.51 | 3.37 to 3.66 | 1,338 |
| Lithuania | 2023/24 | Paired difference | 3.32 | 3.15 to 3.49 | 1,338 |
| Greece | 2023/24 | Police | 5.99 | 5.87 to 6.10 | 2,711 |
| Greece | 2023/24 | Politicians | 2.69 | 2.59 to 2.78 | 2,711 |
| Greece | 2023/24 | Paired difference | 3.30 | 3.18 to 3.42 | 2,711 |
| Germany | 2023/24 | Police | 6.99 | 6.84 to 7.13 | 2,399 |
| Germany | 2023/24 | Politicians | 3.73 | 3.55 to 3.91 | 2,399 |
| Germany | 2023/24 | Paired difference | 3.26 | 3.07 to 3.44 | 2,399 |
| Italy | 2023/24 | Police | 6.53 | 6.36 to 6.71 | 2,803 |
| Italy | 2023/24 | Politicians | 3.31 | 3.13 to 3.48 | 2,803 |
| Italy | 2023/24 | Paired difference | 3.23 | 3.04 to 3.42 | 2,803 |
| Slovenia | 2023/24 | Police | 6.37 | 6.23 to 6.50 | 1,216 |
| Slovenia | 2023/24 | Politicians | 3.17 | 3.04 to 3.30 | 1,216 |
| Slovenia | 2023/24 | Paired difference | 3.20 | 3.05 to 3.35 | 1,216 |
| Austria | 2023/24 | Police | 7.12 | 6.98 to 7.26 | 2,334 |
| Austria | 2023/24 | Politicians | 3.96 | 3.79 to 4.12 | 2,334 |
| Austria | 2023/24 | Paired difference | 3.16 | 2.99 to 3.34 | 2,334 |
| Finland | 2023/24 | Police | 8.22 | 8.13 to 8.32 | 1,560 |
| Finland | 2023/24 | Politicians | 5.27 | 5.16 to 5.39 | 1,560 |
| Finland | 2023/24 | Paired difference | 2.95 | 2.84 to 3.06 | 1,560 |
| Bulgaria | 2023/24 | Police | 5.12 | 4.96 to 5.27 | 2,201 |
| Bulgaria | 2023/24 | Politicians | 2.18 | 2.07 to 2.29 | 2,201 |
| Bulgaria | 2023/24 | Paired difference | 2.94 | 2.81 to 3.07 | 2,201 |
| United Kingdom | 2023/24 | Police | 5.89 | 5.75 to 6.04 | 1,636 |
| United Kingdom | 2023/24 | Politicians | 3.05 | 2.90 to 3.19 | 1,636 |
| United Kingdom | 2023/24 | Paired difference | 2.85 | 2.70 to 2.99 | 1,636 |
| France | 2023/24 | Police | 6.35 | 6.22 to 6.48 | 1,749 |
| France | 2023/24 | Politicians | 3.74 | 3.61 to 3.86 | 1,749 |
| France | 2023/24 | Paired difference | 2.62 | 2.47 to 2.76 | 1,749 |
| Latvia | 2023/24 | Police | 5.32 | 5.12 to 5.52 | 1,182 |
| Latvia | 2023/24 | Politicians | 2.72 | 2.53 to 2.90 | 1,182 |
| Latvia | 2023/24 | Paired difference | 2.60 | 2.43 to 2.77 | 1,182 |
| Serbia | 2023/24 | Police | 5.28 | 5.09 to 5.46 | 1,457 |
| Serbia | 2023/24 | Politicians | 2.76 | 2.58 to 2.93 | 1,457 |
| Serbia | 2023/24 | Paired difference | 2.52 | 2.35 to 2.69 | 1,457 |
| Cyprus | 2023/24 | Police | 5.08 | 4.84 to 5.31 | 673 |
| Cyprus | 2023/24 | Politicians | 2.68 | 2.49 to 2.88 | 673 |
| Cyprus | 2023/24 | Paired difference | 2.39 | 2.16 to 2.62 | 673 |
| Belgium | 2023/24 | Police | 6.51 | 6.38 to 6.63 | 1,573 |
| Belgium | 2023/24 | Politicians | 4.14 | 4.01 to 4.27 | 1,573 |
| Belgium | 2023/24 | Paired difference | 2.37 | 2.23 to 2.50 | 1,573 |
| Iceland | 2023/24 | Police | 6.91 | 6.71 to 7.10 | 827 |
| Iceland | 2023/24 | Politicians | 4.56 | 4.37 to 4.76 | 827 |
| Iceland | 2023/24 | Paired difference | 2.34 | 2.16 to 2.52 | 827 |
| Poland | 2023/24 | Police | 5.23 | 5.09 to 5.37 | 1,401 |
| Poland | 2023/24 | Politicians | 2.90 | 2.76 to 3.04 | 1,401 |
| Poland | 2023/24 | Paired difference | 2.33 | 2.18 to 2.48 | 1,401 |
| Norway | 2023/24 | Police | 7.56 | 7.42 to 7.71 | 1,325 |
| Norway | 2023/24 | Politicians | 5.26 | 5.12 to 5.40 | 1,325 |
| Norway | 2023/24 | Paired difference | 2.30 | 2.16 to 2.45 | 1,325 |
| Sweden | 2023/24 | Police | 7.08 | 6.94 to 7.23 | 1,215 |
| Sweden | 2023/24 | Politicians | 4.85 | 4.71 to 4.98 | 1,215 |
| Sweden | 2023/24 | Paired difference | 2.23 | 2.09 to 2.38 | 1,215 |
| Netherlands | 2023/24 | Police | 7.11 | 7.02 to 7.19 | 1,657 |
| Netherlands | 2023/24 | Politicians | 4.91 | 4.81 to 5.02 | 1,657 |
| Netherlands | 2023/24 | Paired difference | 2.19 | 2.09 to 2.29 | 1,657 |
| Hungary | 2023/24 | Police | 6.24 | 6.09 to 6.38 | 2,075 |
| Hungary | 2023/24 | Politicians | 4.11 | 3.95 to 4.27 | 2,075 |
| Hungary | 2023/24 | Paired difference | 2.12 | 1.98 to 2.27 | 2,075 |
| Ireland | 2023/24 | Police | 6.34 | 6.19 to 6.50 | 1,964 |
| Ireland | 2023/24 | Politicians | 4.23 | 4.07 to 4.38 | 1,964 |
| Ireland | 2023/24 | Paired difference | 2.12 | 1.99 to 2.25 | 1,964 |
| Switzerland | 2023/24 | Police | 7.32 | 7.21 to 7.42 | 1,330 |
| Switzerland | 2023/24 | Politicians | 5.52 | 5.42 to 5.63 | 1,330 |
| Switzerland | 2023/24 | Paired difference | 1.79 | 1.69 to 1.90 | 1,330 |
| Montenegro | 2023/24 | Police | 5.22 | 5.05 to 5.39 | 1,574 |
| Montenegro | 2023/24 | Politicians | 3.45 | 3.28 to 3.62 | 1,574 |
| Montenegro | 2023/24 | Paired difference | 1.77 | 1.55 to 1.99 | 1,574 |
| Slovakia | 2023/24 | Police | 5.55 | 5.32 to 5.78 | 1,423 |
| Slovakia | 2023/24 | Politicians | 3.80 | 3.59 to 4.01 | 1,423 |
| Slovakia | 2023/24 | Paired difference | 1.75 | 1.54 to 1.96 | 1,423 |
| Israel | 2023/24 | Police | 4.76 | 4.59 to 4.93 | 874 |
| Israel | 2023/24 | Politicians | 3.23 | 3.06 to 3.39 | 874 |
| Israel | 2023/24 | Paired difference | 1.53 | 1.37 to 1.70 | 874 |
| Ukraine | 2023/24 | Police | 3.45 | 3.29 to 3.60 | 2,514 |
| Ukraine | 2023/24 | Politicians | 1.94 | 1.80 to 2.07 | 2,514 |
| Ukraine | 2023/24 | Paired difference | 1.51 | 1.38 to 1.64 | 2,514 |
* Low-precision cell: 50-99 observations. Cells below 50 have no published estimate.
Source: European Social Survey, pinned editions and design supplements. Methods and source register. Weighted repeated cross-sections, not a causal estimate.
Spain has the largest estimated police–politician gap in the latest round, 4.15 points; Ukraine has the smallest, 1.51 points. The order between neighboring countries is much less certain than the existence of the broad difference. The intervals belong to each estimate, not to a statistically established league table. In Ukraine in particular, wartime fieldwork and the people who could be reached are part of the interpretation, not background decoration.
The primary comparison uses people who answered both questions. Subtracting the police mean among one set of respondents from the politician mean among another would mix an institutional difference with a difference in who answered. The paired estimate avoids that particular problem and retains the covariance between the two answers when calculating uncertainty. It does not eliminate selective nonresponse.
France shows why the starting point matters
France provides a continuous, design-eligible example across all eleven rounds. Its paired gap was 2.27 points in Round 1, rose to 3.58 in Round 8, and stands at 2.62 in Round 11. The same latest observation therefore supports a larger gap than at the beginning of the series and a smaller one than at its intervening peak. “The gap has widened” is incomplete without a starting period.
This study retains the 2002-2024 ambition rather than treating the three recent rounds as the whole history. The cost is a visible boundary. The source releases contain 518,597 interviews; usable, explicitly joined sampling designs support 372,349 respondents in 204 country-round cells under the stated rules. Some earlier country files have no accessible design supplement, incomplete respondent keys, or no between-PSU degrees of freedom. Those observations are not assigned invented clusters or misleadingly precise intervals.
Only Finland and France have usable designs in every round under this implementation. Their equal-country panel is a two-country history, not an estimate of how Europe changed. A separate 13-country panel holds participation constant from Round 7 through Round 11. Country-specific histories and comparisons between matched endpoints preserve additional evidence without pretending that the country roster is constant.
Figure 02
A long history needs an explicit country panel
Paired differences by survey round, with pointwise 95% intervals. The two-country long-run panel is not the European trend; the separate 13-country panel is fixed from Round 7 onward.
Difference in 0-10 trust points. Shading joins observed pointwise intervals; it does not estimate the years between rounds. Actual fieldwork often spans more than one year.
Hover or use the arrow keys to inspect. Click or tap to pin; Escape releases. Every view retains pointwise 95% confidence intervals and an exact-value table.
Exact estimates, intervals and samples
| Country / group | Period | Measure | Estimate | 95% interval | n |
|---|---|---|---|---|---|
| France | 2002/03 | Paired difference | 2.27 | 2.12 to 2.42 | 1,495 |
| France | 2004/05 | Paired difference | 2.15 | 2.01 to 2.30 | 1,793 |
| France | 2006/07 | Paired difference | 2.45 | 2.31 to 2.58 | 1,970 |
| France | 2008/09 | Paired difference | 2.23 | 2.11 to 2.36 | 2,058 |
| France | 2010/11 | Paired difference | 2.41 | 2.26 to 2.56 | 1,719 |
| France | 2012/13 | Paired difference | 2.72 | 2.59 to 2.85 | 1,955 |
| France | 2014/15 | Paired difference | 3.37 | 3.24 to 3.51 | 1,907 |
| France | 2016/17 | Paired difference | 3.58 | 3.45 to 3.71 | 2,058 |
| France | 2018-20 | Paired difference | 2.95 | 2.81 to 3.09 | 1,965 |
| France | 2020-22 | Paired difference | 2.41 | 2.30 to 2.53 | 1,948 |
| France | 2023/24 | Paired difference | 2.62 | 2.47 to 2.76 | 1,749 |
| Finland + France | 2002/03 | Paired difference | 2.72 | 2.63 to 2.81 | 3,482 |
| Finland + France | 2004/05 | Paired difference | 2.61 | 2.53 to 2.70 | 3,789 |
| Finland + France | 2006/07 | Paired difference | 2.76 | 2.67 to 2.84 | 3,842 |
| Finland + France | 2008/09 | Paired difference | 2.67 | 2.59 to 2.75 | 4,230 |
| Finland + France | 2010/11 | Paired difference | 3.01 | 2.91 to 3.10 | 3,577 |
| Finland + France | 2012/13 | Paired difference | 2.98 | 2.91 to 3.06 | 4,142 |
| Finland + France | 2014/15 | Paired difference | 3.34 | 3.26 to 3.42 | 3,971 |
| Finland + France | 2016/17 | Paired difference | 3.54 | 3.46 to 3.62 | 3,977 |
| Finland + France | 2018-20 | Paired difference | 3.09 | 3.00 to 3.18 | 3,701 |
| Finland + France | 2020-22 | Paired difference | 2.66 | 2.58 to 2.74 | 3,519 |
| Finland + France | 2023/24 | Paired difference | 2.78 | 2.69 to 2.88 | 3,309 |
| 13-country panel | 2014/15 | Paired difference | 2.66 | 2.62 to 2.70 | 23,413 |
| 13-country panel | 2016/17 | Paired difference | 2.74 | 2.71 to 2.78 | 23,249 |
| 13-country panel | 2018-20 | Paired difference | 2.71 | 2.68 to 2.75 | 21,932 |
| 13-country panel | 2020-22 | Paired difference | 2.62 | 2.58 to 2.66 | 19,982 |
| 13-country panel | 2023/24 | Paired difference | 2.71 | 2.67 to 2.75 | 20,045 |
* Low-precision cell: 50-99 observations. Cells below 50 have no published estimate.
Source: European Social Survey, pinned editions and design supplements. Methods and source register. Weighted repeated cross-sections, not a causal estimate.
The horizontal positions use the survey's reference years. Actual fieldwork often spans years, especially during the pandemic. The raw sources also contain missing, reversed, and implausible interview dates. Those records remain flagged; this article does not use individual interview dates to identify a response to a particular event. A line between two observed rounds indicates their order, not a measured path through the intervening months.
A gap can widen from either side
A larger difference is compatible with several histories: greater trust in the police, less trust in politicians, or movements in both directions. A gap alone cannot distinguish them. The two-axis comparison below keeps both institutional levels visible on identical scales. Distance from the equality line describes the difference; movement along either axis identifies which measured rating changed.
Figure 03
The same gap can come from different levels
France. Each point is one survey round: politicians horizontally, police vertically. The diagonal denotes equal trust, not a fitted relationship.
France: the two levels
Police: 5.86
Politicians: 3.59
Paired gap: +2.27
Police: 6.35
Politicians: 3.74
Paired gap: +2.62
Paths are descriptive. The survey does not identify why either institution gained or lost trust.
Hover or use the arrow keys to inspect. Click or tap to pin; Escape releases. Every view retains pointwise 95% confidence intervals and an exact-value table.
Exact estimates, intervals and samples
| Country / group | Period | Measure | Estimate | 95% interval | n |
|---|---|---|---|---|---|
| France | 2002/03 | Police | 5.86 | 5.70 to 6.02 | 1,495 |
| France | 2002/03 | Politicians | 3.59 | 3.45 to 3.73 | 1,495 |
| France | 2002/03 | Paired difference | 2.27 | 2.12 to 2.42 | 1,495 |
| France | 2004/05 | Police | 5.64 | 5.51 to 5.77 | 1,793 |
| France | 2004/05 | Politicians | 3.49 | 3.36 to 3.62 | 1,793 |
| France | 2004/05 | Paired difference | 2.15 | 2.01 to 2.30 | 1,793 |
| France | 2006/07 | Police | 5.71 | 5.58 to 5.85 | 1,970 |
| France | 2006/07 | Politicians | 3.27 | 3.16 to 3.37 | 1,970 |
| France | 2006/07 | Paired difference | 2.45 | 2.31 to 2.58 | 1,970 |
| France | 2008/09 | Police | 5.74 | 5.62 to 5.86 | 2,058 |
| France | 2008/09 | Politicians | 3.51 | 3.40 to 3.63 | 2,058 |
| France | 2008/09 | Paired difference | 2.23 | 2.11 to 2.36 | 2,058 |
| France | 2010/11 | Police | 5.64 | 5.48 to 5.79 | 1,719 |
| France | 2010/11 | Politicians | 3.22 | 3.09 to 3.36 | 1,719 |
| France | 2010/11 | Paired difference | 2.41 | 2.26 to 2.56 | 1,719 |
| France | 2012/13 | Police | 5.93 | 5.79 to 6.06 | 1,955 |
| France | 2012/13 | Politicians | 3.21 | 3.08 to 3.34 | 1,955 |
| France | 2012/13 | Paired difference | 2.72 | 2.59 to 2.85 | 1,955 |
| France | 2014/15 | Police | 6.15 | 6.02 to 6.28 | 1,907 |
| France | 2014/15 | Politicians | 2.78 | 2.65 to 2.90 | 1,907 |
| France | 2014/15 | Paired difference | 3.37 | 3.24 to 3.51 | 1,907 |
| France | 2016/17 | Police | 6.47 | 6.35 to 6.59 | 2,058 |
| France | 2016/17 | Politicians | 2.89 | 2.78 to 2.99 | 2,058 |
| France | 2016/17 | Paired difference | 3.58 | 3.45 to 3.71 | 2,058 |
| France | 2018-20 | Police | 6.44 | 6.32 to 6.56 | 1,965 |
| France | 2018-20 | Politicians | 3.49 | 3.38 to 3.61 | 1,965 |
| France | 2018-20 | Paired difference | 2.95 | 2.81 to 3.09 | 1,965 |
| France | 2020-22 | Police | 6.34 | 6.24 to 6.44 | 1,948 |
| France | 2020-22 | Politicians | 3.93 | 3.83 to 4.03 | 1,948 |
| France | 2020-22 | Paired difference | 2.41 | 2.30 to 2.53 | 1,948 |
| France | 2023/24 | Police | 6.35 | 6.22 to 6.48 | 1,749 |
| France | 2023/24 | Politicians | 3.74 | 3.61 to 3.86 | 1,749 |
| France | 2023/24 | Paired difference | 2.62 | 2.47 to 2.76 | 1,749 |
* Low-precision cell: 50-99 observations. Cells below 50 have no published estimate.
Source: European Social Survey, pinned editions and design supplements. Methods and source register. Weighted repeated cross-sections, not a causal estimate.
This also limits the interpretation of the broader institutional grouping. “Protective” is the average of police and legal-system trust; “representative” is the average of parliament, politician, and party trust. The five-item comparison uses respondents who answered every item. These are transparent analytical categories, not a discovery that institutions everywhere divide into two invariant psychological dimensions.
The source questionnaires preserve the trust wording and 0-10 endpoints across the series. Political-party trust, however, enters only in Round 2, explicitly marked as a new core question. The five-item index therefore has no Round 1 value. The direct police–politician comparison reaches back further without changing its definition.
Internal consistency provides a useful warning against overinterpreting the labels. In the latest round, the weighted descriptive alpha for the protective pair ranges from about 0.62 to 0.88 across countries, compared with 0.77 to 0.94 for the representative group. Related answers make an average intelligible; they do not establish translation equivalence, institutional equivalence, or measurement invariance. The individual items remain available below.
Five items, visible separately
France, 2023/24. Each item uses all respondents who answered that question. These denominators can differ; their differences are not the paired-gap estimate. All eligible interview modes.
Exact estimates, intervals and samples
| Country / group | Period | Measure | Estimate | 95% interval | n |
|---|---|---|---|---|---|
| Police | 2023/24 | Item available-case mean | 6.36 | 6.23 to 6.49 | 1,767 |
| Legal system | 2023/24 | Item available-case mean | 5.04 | 4.90 to 5.17 | 1,764 |
| Parliament | 2023/24 | Item available-case mean | 4.10 | 3.97 to 4.23 | 1,727 |
| Politicians | 2023/24 | Item available-case mean | 3.74 | 3.62 to 3.86 | 1,753 |
| Political parties | 2023/24 | Item available-case mean | 3.37 | 3.25 to 3.49 | 1,746 |
* Low-precision cell: 50-99 observations. Cells below 50 have no published estimate.
A common difference does not imply a common direction
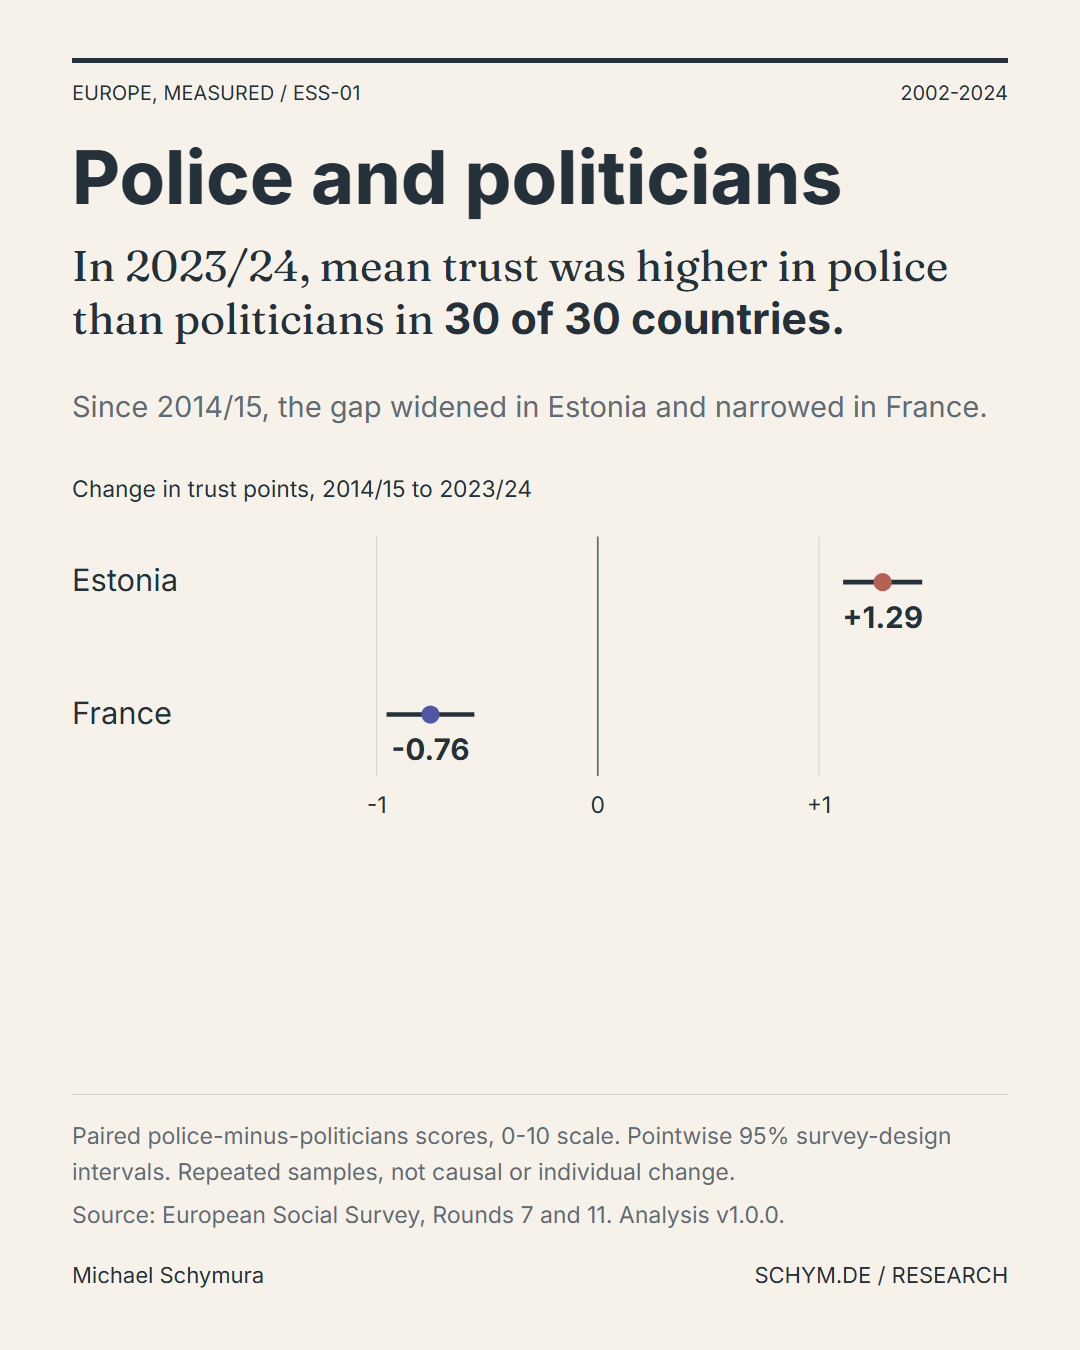
Among the 19 countries with usable Round 7 and Round 11 estimates, Estonia has the largest estimated increase in the direct gap: 1.29 points, with a 95% interval of 1.11-1.47. Lithuania and the Netherlands also widen. Ireland, France, and Poland move in the opposite direction; the estimated French change is -0.76 points, with an interval of -0.96 to -0.56.
These are changes between the same two survey rounds, calculated separately for each country. They should not be mixed with a country's change from its first available observation, because that would compare different historical periods. The baseline control changes the start round for the entire comparison and retains only countries observed at both endpoints.
Figure 04
Widening is a country-specific claim
Latest round minus the selected baseline. 19 countries have usable estimates in both periods. All eligible interviews; this published change comparison stays pinned when the interview-mode control changes.
Hover or use the arrow keys to inspect. Click or tap to pin; Escape releases. Every view retains pointwise 95% confidence intervals and an exact-value table.
Exact country changes and multiplicity checks
| Country | Change | 95% interval | Adjusted p |
|---|---|---|---|
| Estonia | +1.29 | 1.11 to 1.47 | 1.67e-42 |
| Lithuania | +0.79 | 0.57 to 1.02 | 2.21e-11 |
| Netherlands | +0.66 | 0.51 to 0.80 | 9.64e-18 |
| Belgium | +0.52 | 0.34 to 0.69 | 1.66e-8 |
| Germany | +0.35 | 0.14 to 0.56 | 0.00220 |
| Sweden | +0.32 | 0.14 to 0.50 | 0.00128 |
| Norway | +0.16 | -0.03 to 0.35 | 0.151 |
| Austria | +0.13 | -0.09 to 0.35 | 0.279 |
| Spain | +0.11 | -0.10 to 0.31 | 0.310 |
| United Kingdom | 0.00 | -0.19 to 0.19 | 0.990 |
| Switzerland | -0.11 | -0.26 to 0.04 | 0.185 |
| Israel | -0.16 | -0.39 to 0.06 | 0.188 |
| Portugal | -0.17 | -0.45 to 0.11 | 0.275 |
| Hungary | -0.23 | -0.45 to -0.02 | 0.0535 |
| Finland | -0.36 | -0.50 to -0.21 | 0.00000392 |
| Slovenia | -0.39 | -0.60 to -0.17 | 0.000832 |
| Poland | -0.73 | -0.94 to -0.53 | 1.15e-11 |
| France | -0.76 | -0.96 to -0.56 | 2.14e-12 |
| Ireland | -0.78 | -1.01 to -0.55 | 2.88e-10 |
Source: European Social Survey, pinned editions and design supplements. Methods and source register. Weighted repeated cross-sections, not a causal estimate.
The error bars are pointwise intervals. With many country comparisons, some apparently unusual results will arise by chance; the download therefore includes Benjamini–Hochberg adjusted p-values within each metric-and-baseline family. That adjustment does not turn the largest point estimate into a proven first place, nor does statistical significance explain the economic or institutional importance of a change.
The repeated cross-sections do not follow the same people. A country's change may reflect attitude shifts, population composition, differential response, or combinations of these. The between-round calculation assumes independent samples. It is not an estimate of how an individual respondent changed their mind.
Financial strain is an association, not the answer to “why”
The latest-round financial-strain comparison asks whether the two institutional ratings vary within a country according to how people describe their household income. “Living comfortably,” “coping,” and “difficult or very difficult” are subjective conditions, not harmonized monetary income bands. Their meaning may differ with costs, household needs, expectations, and national institutions.
In France, the direct gap is 2.49 points among people living comfortably and 2.76 among those reporting difficulty. The latter estimate has a much wider 95% interval, 2.28-3.24, from 232 paired answers. Those two group estimates do not by themselves establish a difference between the groups. Their uncertainty, composition, and the covariance of domain estimates matter; this article does not convert a visual separation into a causal income effect.
Figure 05
Financial difficulty and institutional trust
France, 2023/24. Groups report how they feel about their household's present income. Domain-aware intervals retain the full sampling design. This association is not an income effect.
Hover or use the arrow keys to inspect. Click or tap to pin; Escape releases. Every view retains pointwise 95% confidence intervals and an exact-value table.
Exact estimates, intervals and samples
| Country / group | Period | Measure | Estimate | 95% interval | n |
|---|---|---|---|---|---|
| Living comfortably | 2023/24 | Police | 6.69 | 6.50 to 6.87 | 733 |
| Living comfortably | 2023/24 | Politicians | 4.20 | 4.03 to 4.36 | 733 |
| Living comfortably | 2023/24 | Paired difference | 2.49 | 2.29 to 2.69 | 733 |
| Coping | 2023/24 | Police | 6.26 | 6.08 to 6.44 | 767 |
| Coping | 2023/24 | Politicians | 3.57 | 3.39 to 3.74 | 767 |
| Coping | 2023/24 | Paired difference | 2.69 | 2.50 to 2.88 | 767 |
| Difficult / very difficult | 2023/24 | Police | 5.75 | 5.33 to 6.18 | 232 |
| Difficult / very difficult | 2023/24 | Politicians | 2.99 | 2.68 to 3.31 | 232 |
| Difficult / very difficult | 2023/24 | Paired difference | 2.76 | 2.28 to 3.24 | 232 |
* Low-precision cell: 50-99 observations. Cells below 50 have no published estimate.
Source: European Social Survey, pinned editions and design supplements. Methods and source register. Weighted repeated cross-sections, not a causal estimate.
The financial comparison is deliberately confined to the latest round. France's early income-feeling questions used deviating categories and were removed from the integrated file; silently rebuilding a historical income series from those responses would change the measurement contract. The downloadable analysis also contains age-group estimates, with recorded ages below the target population treated as unavailable ages rather than silently deleted trust respondents.
The finding must survive its sample definition
Four checks hold the police–politician estimand fixed while crossing two sample restrictions. The first requires only the two answers used in the difference; the second requires all five institutional answers. Each is calculated for all eligible interviews and for face-to-face interviews alone. The small matrix is useful because it exposes the conditions behind each estimate rather than presenting four nearly identical labels as four discoveries.
Figure 06
Four prespecified checks on the same difference
France, 2023/24. Police minus politicians remains the estimand in every row. The two columns show which restrictions apply; these are four declared checks, not an exhaustive multiverse.
Hover or use the arrow keys to inspect. Click or tap to pin; Escape releases. Every view retains pointwise 95% confidence intervals and an exact-value table.
Exact estimates, intervals and samples
| Country / group | Period | Measure | Estimate | 95% interval | n |
|---|---|---|---|---|---|
| Both answers / all interviews | 2023/24 | Police minus politicians | 2.62 | 2.47 to 2.76 | 1,749 |
| All five / all interviews | 2023/24 | Police minus politicians | 2.61 | 2.47 to 2.76 | 1,707 |
| Both answers / face-to-face | 2023/24 | Police minus politicians | 2.64 | 2.49 to 2.79 | 1,678 |
| All five / face-to-face | 2023/24 | Police minus politicians | 2.64 | 2.48 to 2.79 | 1,638 |
* Low-precision cell: 50-99 observations. Cells below 50 have no published estimate.
Source: European Social Survey, pinned editions and design supplements. Methods and source register. Weighted repeated cross-sections, not a causal estimate.
In the default French view, requiring all five answers changes the latest direct gap from 2.616 to 2.614 points. That is a small sample-definition difference, not evidence that nonresponse is harmless. Across the article, counts and weighted missing shares remain available so that a stable average cannot conceal a changing denominator.
Video interviews and unknown mode codes are retained explicitly in the recent integrated releases. The face-to-face restriction excludes them. It does not estimate the effect of switching an otherwise identical person from one mode to another: respondents and fieldwork conditions can differ. The separate self-completion releases, including Czechia's Round 11 file, are not pooled into this interviewer-administered series.
What this evidence does not prove
The data establish a widespread difference in stated institutional trust and substantial variation in its history. They do not identify why police are trusted more, measure the quality of policing or democratic representation directly, or prove that one institutional domain causes confidence in another. Country averages also leave differences within populations unresolved.
The strongest implication is narrower and more useful than a diagnosis of general distrust. A country can retain confidence in some state institutions while withholding it from political representation. Monitoring a single aggregate can hide that distinction; monitoring only the gap can hide which side changed. The practical analytical task is to keep the institutional levels, paired difference, sample, and period together.
The next research step is not a more elaborate ranking. It is evidence capable of distinguishing the mechanisms: comparable measures of institutional encounters and performance, longitudinal responses where available, or a defensible source of exogenous change. This survey supplies the pattern those designs must explain.
The audit
Sources, design and reproducibility
Analysis version 1.0.0. 8,146 aggregate estimates; 198 independently reproduced real-data cases using R survey 4.5. Python owns acquisition, harmonization and estimation. A matching independent implementation verifies values, standard errors, design degrees of freedom and sample counts.
- Population and weights
- Residents aged 15 and older in private households, subject to documented national exceptions. The ESS analysis weight combines post-stratification and population size. Country estimates use the same weights; the population factor cancels within country. Equal-country aggregates average country estimates, rather than pooling unweighted respondents.
- Uncertainty
- Taylor linearization with round/country-nested strata and PSUs, full-design domain estimation, explicit singleton and singleton-domain adjustment, and Student's t intervals. Equal-country and independent-round contrasts use Satterthwaite degrees of freedom. Marginal institutional intervals do not substitute for the paired-gap interval.
- Missing data and disclosure
- No imputed trust responses. The direct pair requires both answers; the index requires all five. Below 50 observations, values and intervals are suppressed; 50-99 is flagged. Design-unavailable country-rounds remain in the coverage ledger. Sampling intervals do not capture nonresponse or measurement bias.
- Historical boundary
- The complete fixed panel is Finland and France. The recent fixed panel contains BE, CH, EE, FI, FR, GB, HU, IE, LT, NL, NO, PT, SI. The Round 8 design supplement has a documented publisher version-label discrepancy: DOI edition 1.1, embedded 1.2, identical production date and a complete 44,387-key join. Both labels and its hash are pinned.
- Use terms
- Noncommercial research. ESS attribution required. Rounds 8-11 explicitly carry CC BY-NC-SA 4.0 data terms; earlier metadata specify not-for-profit use. The source questionnaires have separate documentation terms. No respondent-level data are published.
All source editions and coverage
| Round | Reference period | Edition | Source |
|---|---|---|---|
| 1 | 2002/03 | 6.7 | 10.21338/ess1e06_7 |
| 2 | 2004/05 | 3.6 | 10.21338/ess2e03_6 |
| 3 | 2006/07 | 3.7 | 10.21338/ess3e03_7 |
| 4 | 2008/09 | 4.6 | 10.21338/ess4e04_6 |
| 5 | 2010/11 | 3.6 | 10.21338/ess5e03_6 |
| 6 | 2012/13 | 2.7 | 10.21338/ess6e02_7 |
| 7 | 2014/15 | 2.3 | 10.21338/ess7e02_3 |
| 8 | 2016/17 | 2.3 | 10.21338/ess8e02_3 |
| 9 | 2018-20 | 3.3 | 10.21338/ess9e03_3 |
| 10 | 2020-22 | 3.3 | 10.21338/ess10e03_3 |
| 11 | 2023/24 | 4.2 | 10.21338/ess11e04_2 |
ESS weighting guidance · Sampling-design documentation · Source questionnaires
Aggregate fingerprint: 2a69f1735ff3db7a. The receipt binds all sources, code, checks and outputs.