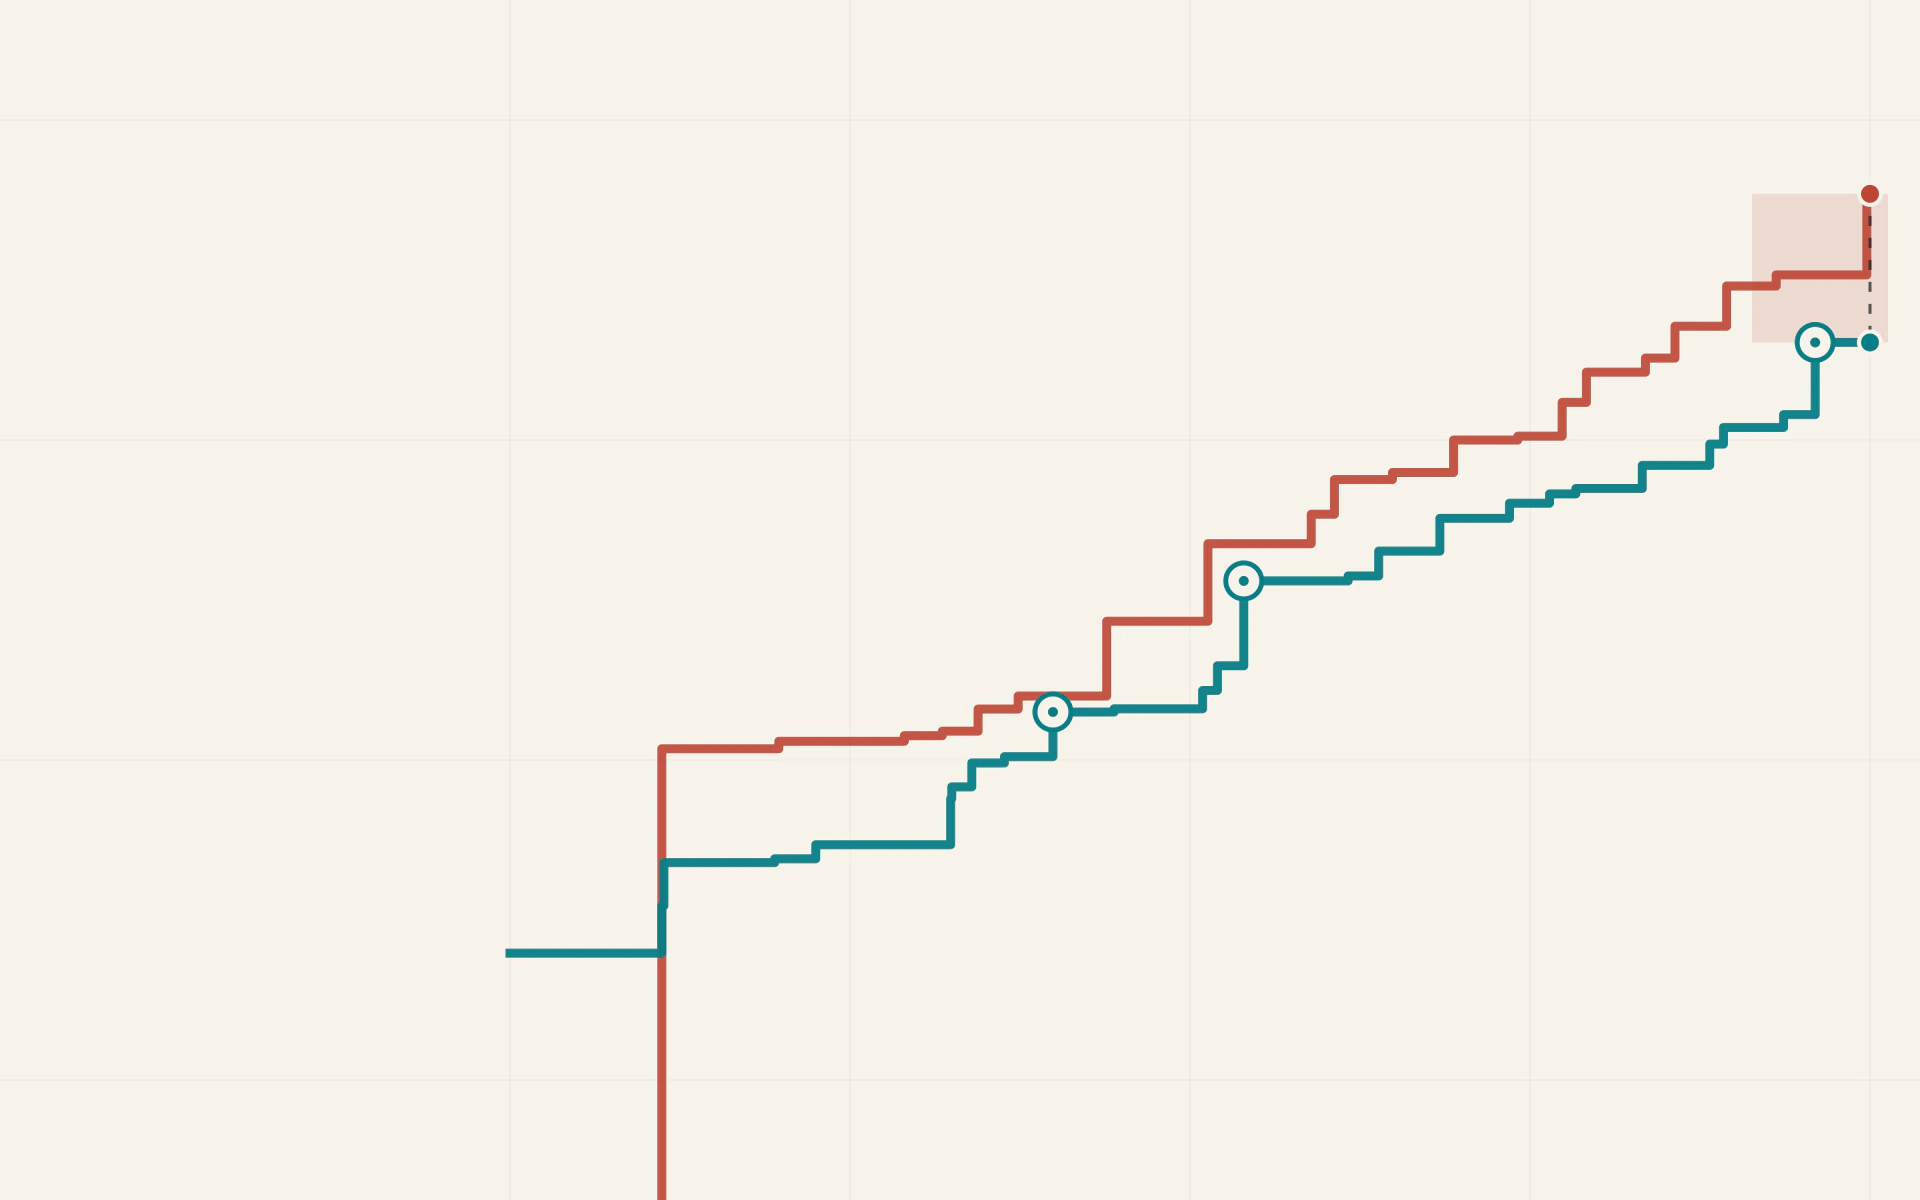
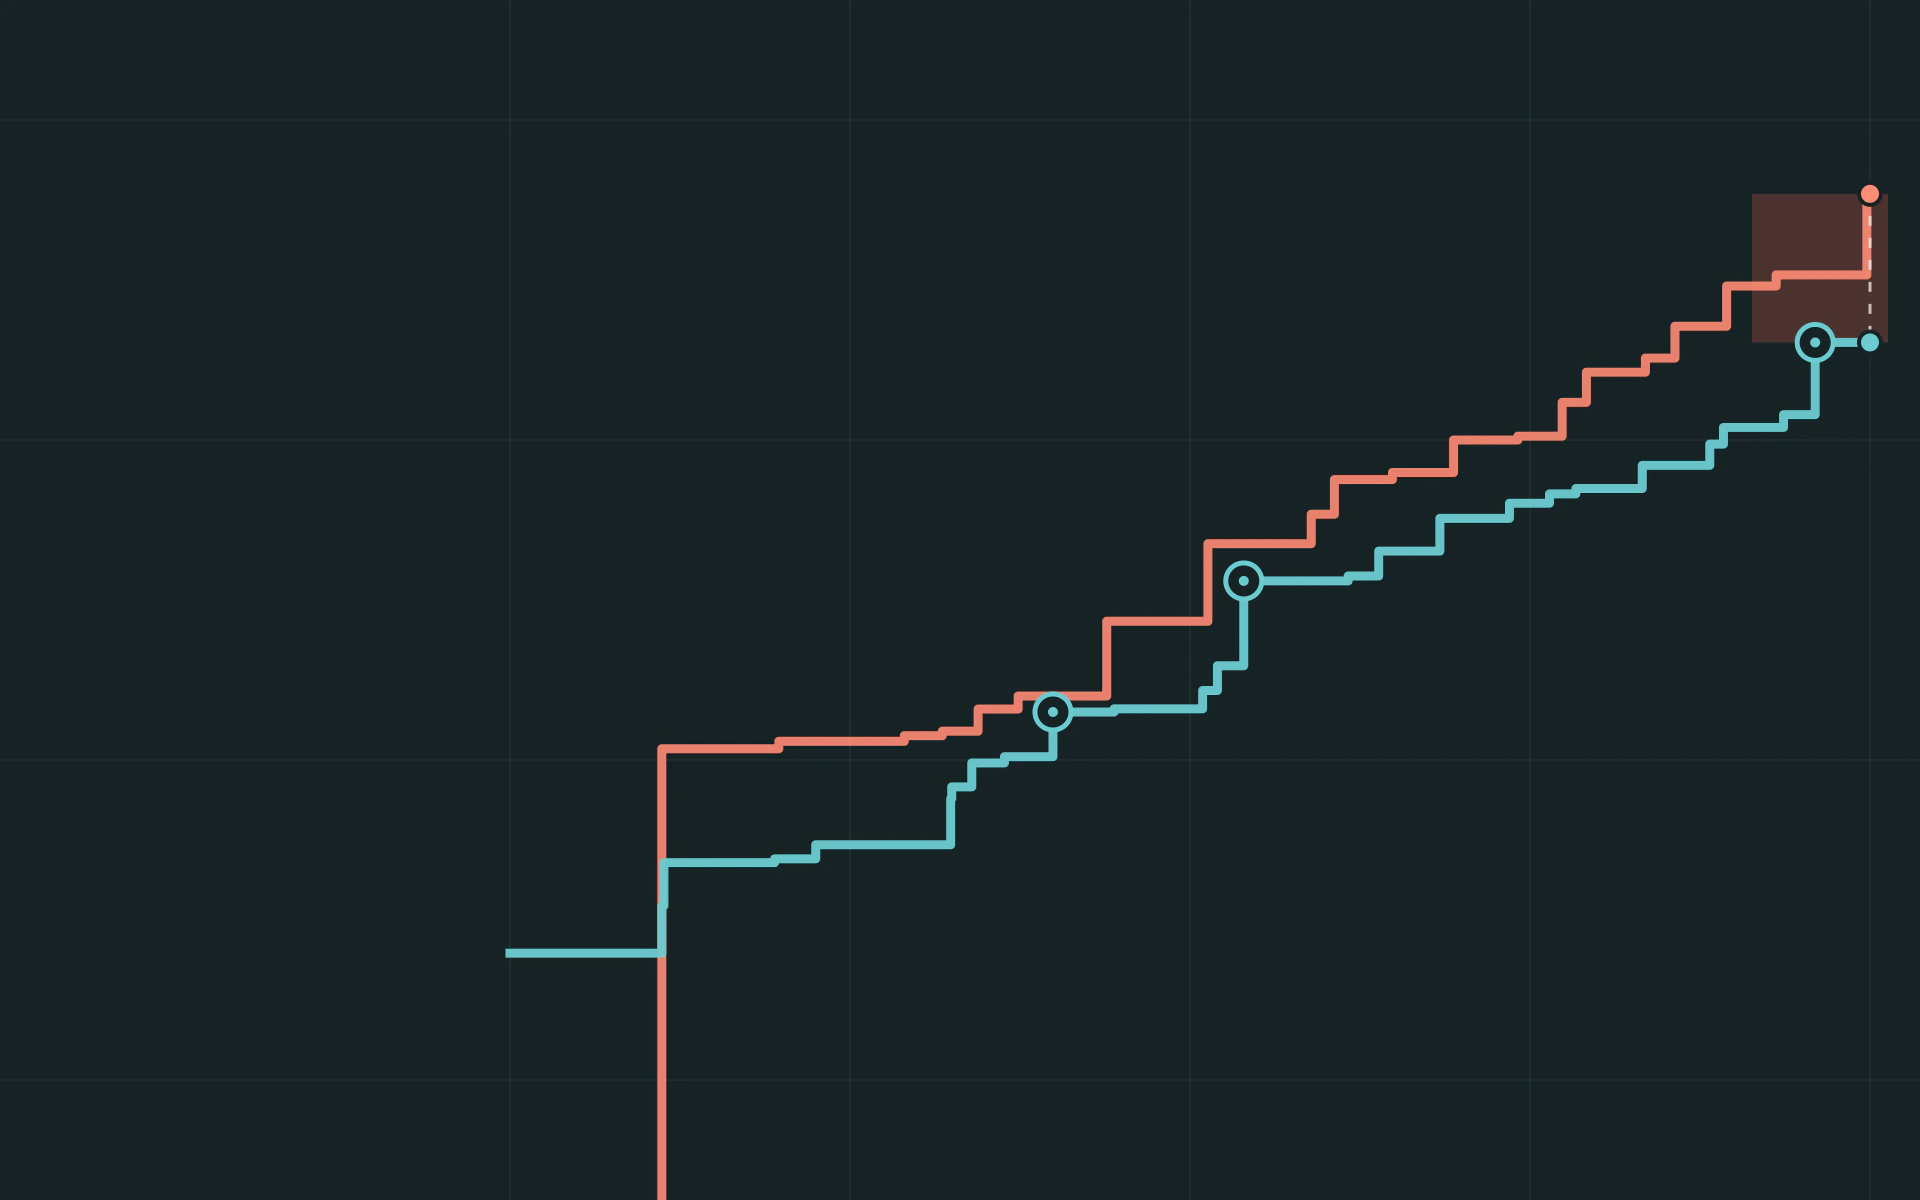
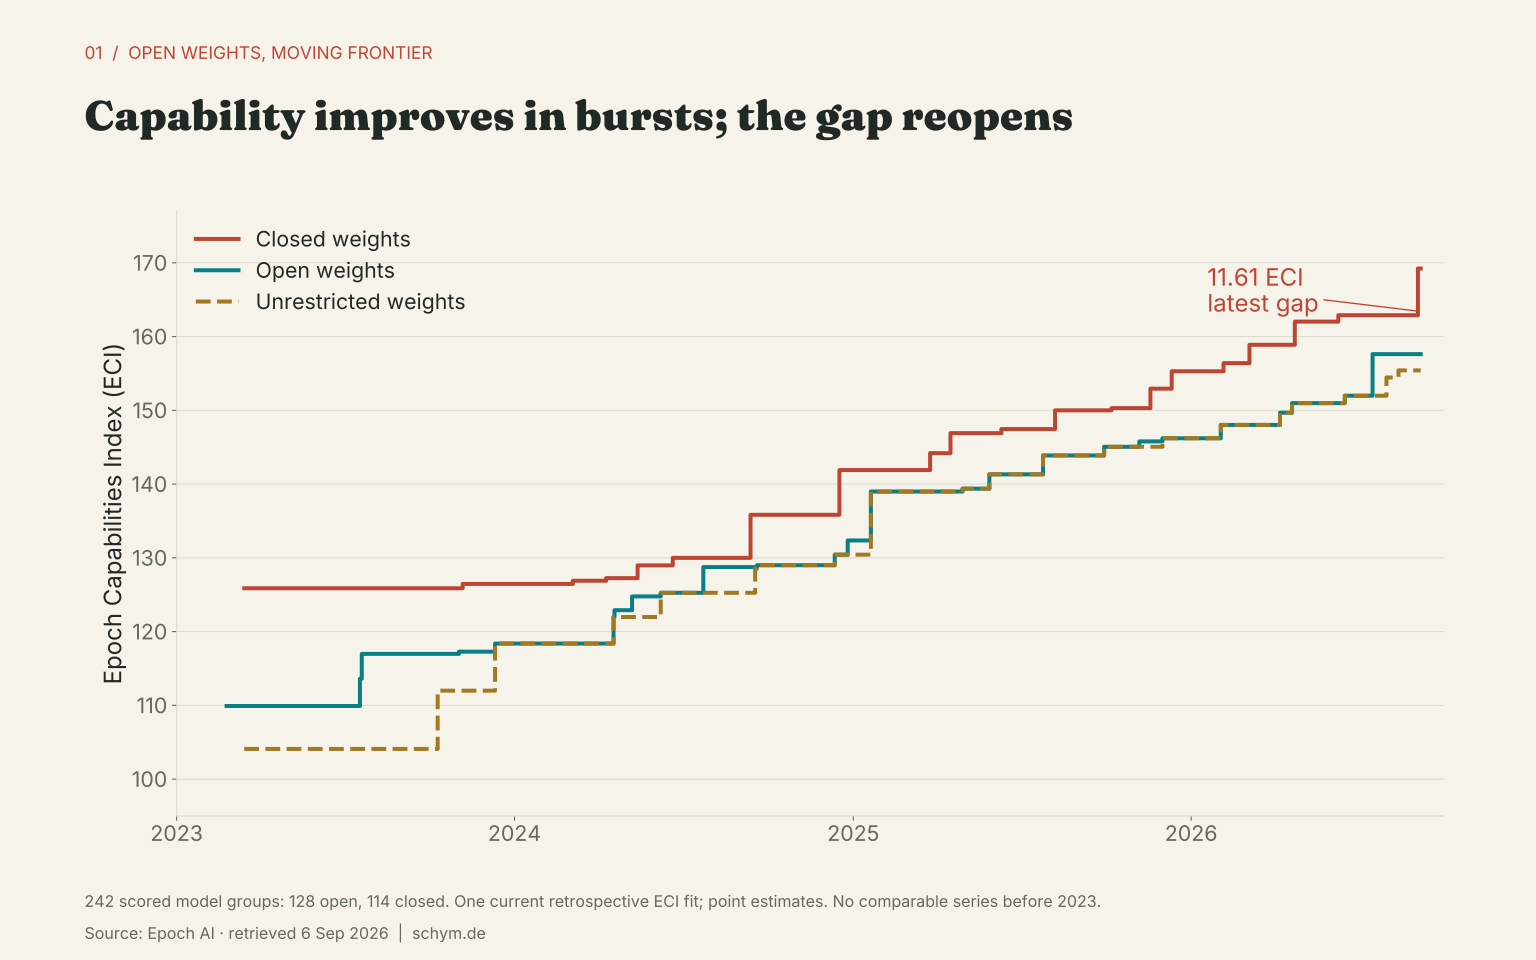
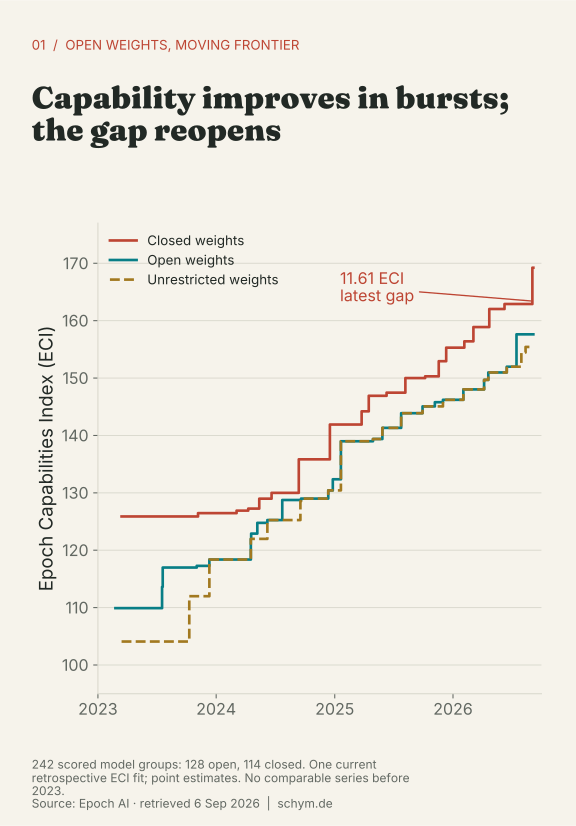
On 23 July 2024, Llama 3.1-405B came within 1.25 ECI points of the capability frontier in today’s fitted index. In January 2025, DeepSeek R1 reduced a 9.54-point gap to 2.91. Those were substantial advances. Neither established a continuously shrinking distance.
The evidence fits periodic compression better than continuous catch-up. It does not establish an ever more expensive, permanently widening distance: recent cost and compute estimates are too thin for that stronger claim.
Read the clock
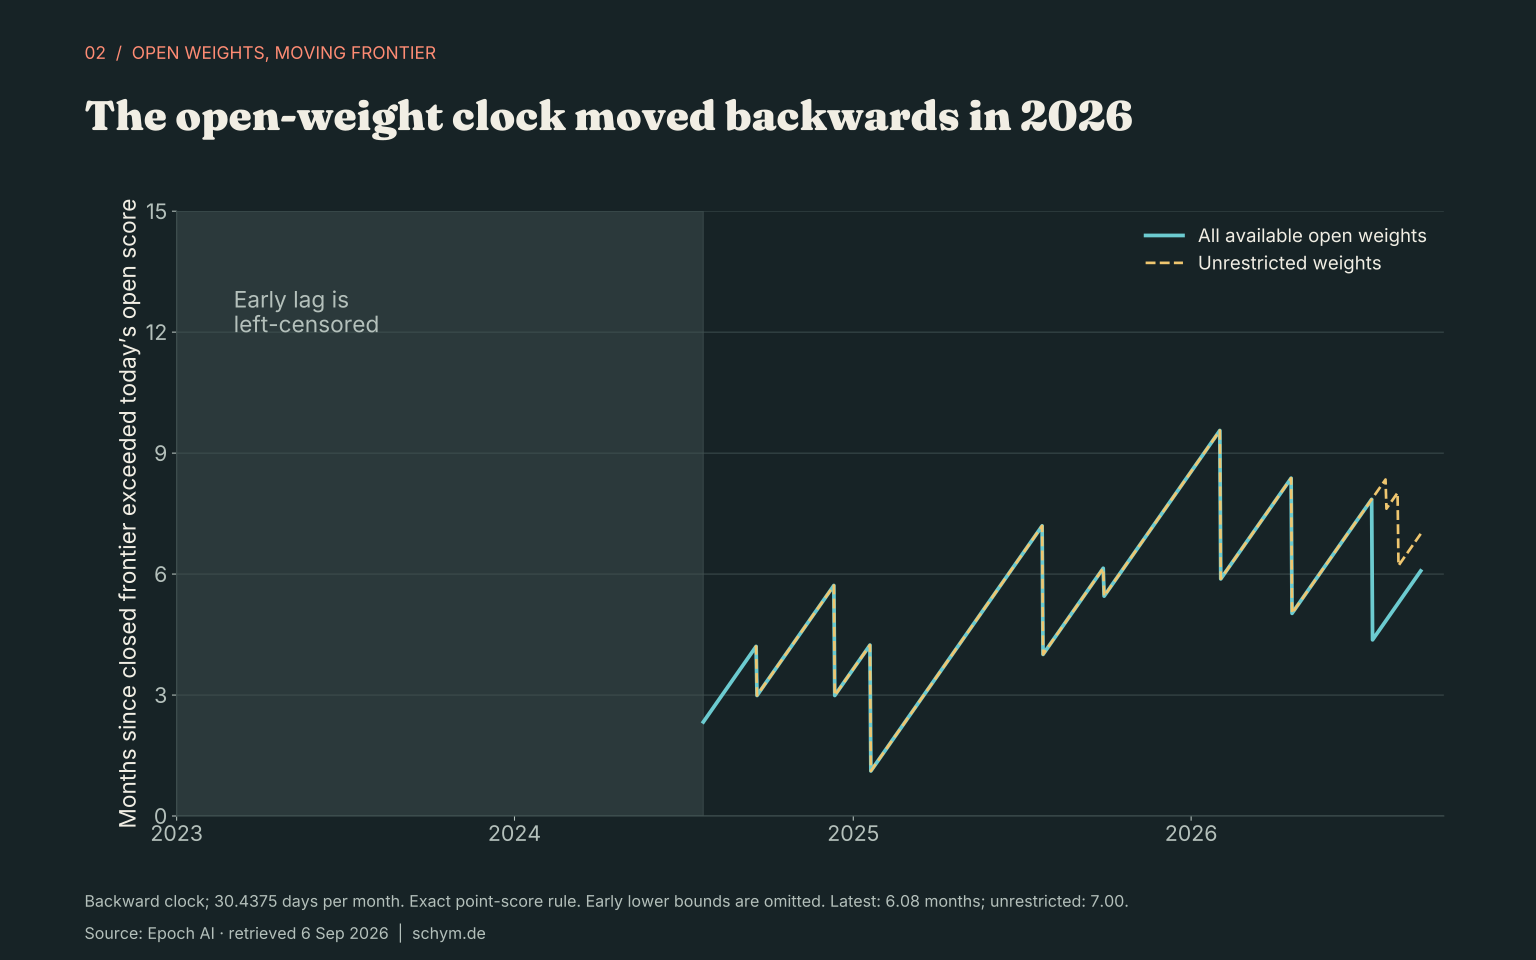
The clock asks a precise question: how long has the closed frontier exceeded the capability score of the strongest open-weight model available on the selected date? It holds one current ECI fit fixed and reconstructs dated release records. It is not the age of the open model, nor the forward waiting time for every task or benchmark. The ECI comparison begins in 2023. No capability-lag line is fabricated for 2020–22.
GPT-6 Astra
90% ECI interval 164.85–174.02Kimi K3
90% ECI interval 155.06–160.13ECI points
6.08 months · strict point-score clockKimi K3: non-commercial weights in Epoch. Weight availability does not establish full open source.
242 public scored groups; 128 open, 114 closed.
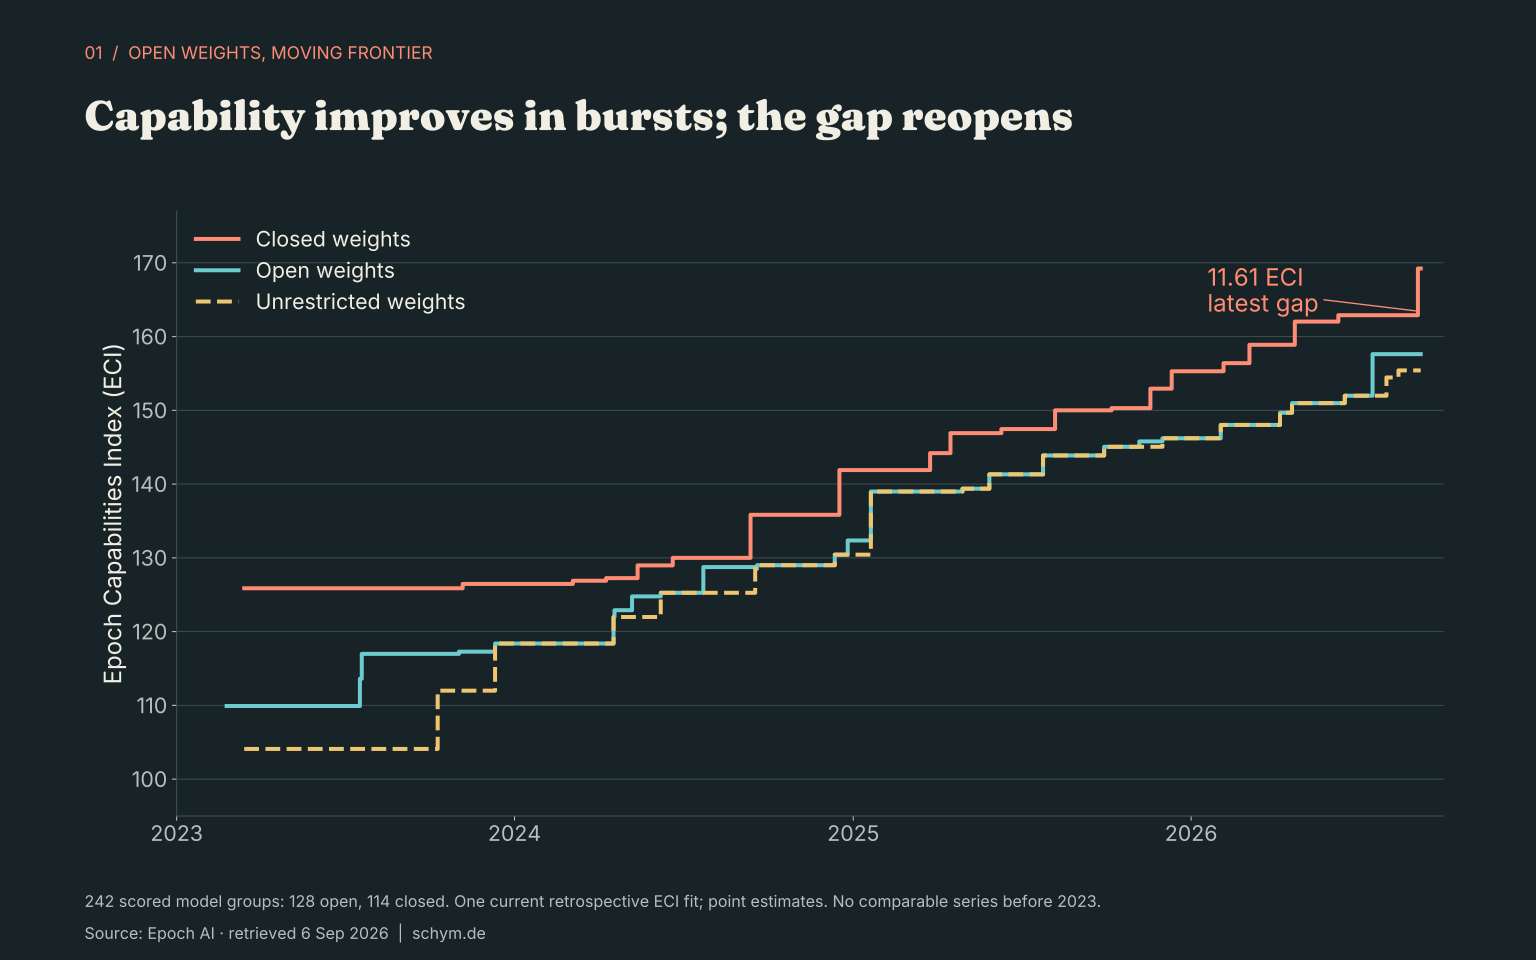
Exact values and sample counts
| date | n_available | open_group | open_eci | closed_group | closed_eci | unrestricted_group | unrestricted_eci | gap |
|---|---|---|---|---|---|---|---|---|
| 2023-02-24 | 2 | LLaMA-65B | 109.91 | — | — | — | — | 0 |
| 2023-07-18 | 18 | Llama 2-70B | 113.61 | GPT-4 (Mar 2023) | 125.88 | Falcon-40B | 104.09 | 12.27 |
| 2023-07-20 | 19 | Stable Beluga 2 | 116.98 | GPT-4 (Mar 2023) | 125.88 | Falcon-40B | 104.09 | 8.9 |
| 2023-10-10 | 29 | Stable Beluga 2 | 116.98 | GPT-4 (Mar 2023) | 125.88 | Mistral 7B v0.1 | 111.99 | 8.9 |
| 2023-11-02 | 34 | Yi-34B | 117.28 | GPT-4 (Mar 2023) | 125.88 | Mistral 7B v0.1 | 111.99 | 8.6 |
| 2023-11-06 | 36 | Yi-34B | 117.28 | GPT-4 Turbo (Nov 2023) | 126.46 | Mistral 7B v0.1 | 111.99 | 9.18 |
| 2023-12-11 | 38 | Mixtral 8x7B | 118.38 | GPT-4 Turbo (Nov 2023) | 126.46 | Mixtral 8x7B | 118.38 | 8.08 |
| 2024-03-04 | 50 | Mixtral 8x7B | 118.38 | Claude 3 Opus | 126.9 | Mixtral 8x7B | 118.38 | 8.52 |
| 2024-04-09 | 52 | Mixtral 8x7B | 118.38 | GPT-4 Turbo (Apr 2024) | 127.25 | Mixtral 8x7B | 118.38 | 8.87 |
| 2024-04-17 | 53 | Mixtral 8x22B | 121.98 | GPT-4 Turbo (Apr 2024) | 127.25 | Mixtral 8x22B | 121.98 | 5.27 |
| 2024-04-18 | 55 | Llama 3-70B | 122.9 | GPT-4 Turbo (Apr 2024) | 127.25 | Mixtral 8x22B | 121.98 | 4.35 |
| 2024-05-07 | 59 | DeepSeek-V2 (MoE-236B, May 2024) | 124.77 | GPT-4 Turbo (Apr 2024) | 127.25 | Mixtral 8x22B | 121.98 | 2.48 |
| 2024-05-13 | 61 | DeepSeek-V2 (MoE-236B, May 2024) | 124.77 | GPT-4o (May 2024) | 128.98 | Mixtral 8x22B | 121.98 | 4.21 |
| 2024-06-07 | 64 | Qwen2-72B | 125.26 | GPT-4o (May 2024) | 128.98 | Qwen2-72B | 125.26 | 3.72 |
| 2024-06-20 | 65 | Qwen2-72B | 125.26 | Claude 3.5 Sonnet | 130 | Qwen2-72B | 125.26 | 4.74 |
| 2024-07-23 | 72 | Llama 3.1-405B | 128.75 | Claude 3.5 Sonnet | 130 | Qwen2-72B | 125.26 | 1.25 |
| 2024-09-12 | 77 | Llama 3.1-405B | 128.75 | o1-mini | 135.84 | Qwen2-72B | 125.26 | 7.09 |
| 2024-09-17 | 78 | Llama 3.1-405B | 128.75 | o1-mini | 135.84 | Qwen2.5-32B | 128.53 | 7.09 |
| 2024-09-19 | 82 | Qwen2.5-72B | 129 | o1-mini | 135.84 | Qwen2.5-72B | 129 | 6.84 |
| 2024-12-12 | 97 | Phi-4 | 130.43 | o1-mini | 135.84 | Phi-4 | 130.43 | 5.41 |
| 2024-12-17 | 98 | Phi-4 | 130.43 | o1 | 141.9 | Phi-4 | 130.43 | 11.47 |
| 2024-12-26 | 99 | DeepSeek-V3 | 132.36 | o1 | 141.9 | Phi-4 | 130.43 | 9.54 |
| 2025-01-20 | 100 | DeepSeek-R1 | 138.99 | o1 | 141.9 | DeepSeek-R1 | 138.99 | 2.91 |
| 2025-03-25 | 117 | DeepSeek-R1 | 138.99 | Gemini 2.5 Pro (Mar 2025) | 144.2 | DeepSeek-R1 | 138.99 | 5.21 |
| 2025-04-16 | 126 | DeepSeek-R1 | 138.99 | o3 | 146.91 | DeepSeek-R1 | 138.99 | 7.92 |
| 2025-04-29 | 132 | Qwen3-235B-A22B | 139.38 | o3 | 146.91 | Qwen3-235B-A22B | 139.38 | 7.53 |
| 2025-05-28 | 138 | DeepSeek-R1 (May 2025) | 141.32 | o3 | 146.91 | DeepSeek-R1 (May 2025) | 141.32 | 5.59 |
| 2025-06-10 | 141 | DeepSeek-R1 (May 2025) | 141.32 | o3-pro | 147.46 | DeepSeek-R1 (May 2025) | 141.32 | 6.14 |
| 2025-07-25 | 148 | Qwen3-235B-A22B-Thinking (Jul 2025) | 143.88 | o3-pro | 147.46 | Qwen3-235B-A22B-Thinking (Jul 2025) | 143.88 | 3.58 |
| 2025-08-07 | 156 | Qwen3-235B-A22B-Thinking (Jul 2025) | 143.88 | GPT-5 | 150 | Qwen3-235B-A22B-Thinking (Jul 2025) | 143.88 | 6.12 |
First 30 of 49 rows shown. The CSV contains all rows.
Download values as CSV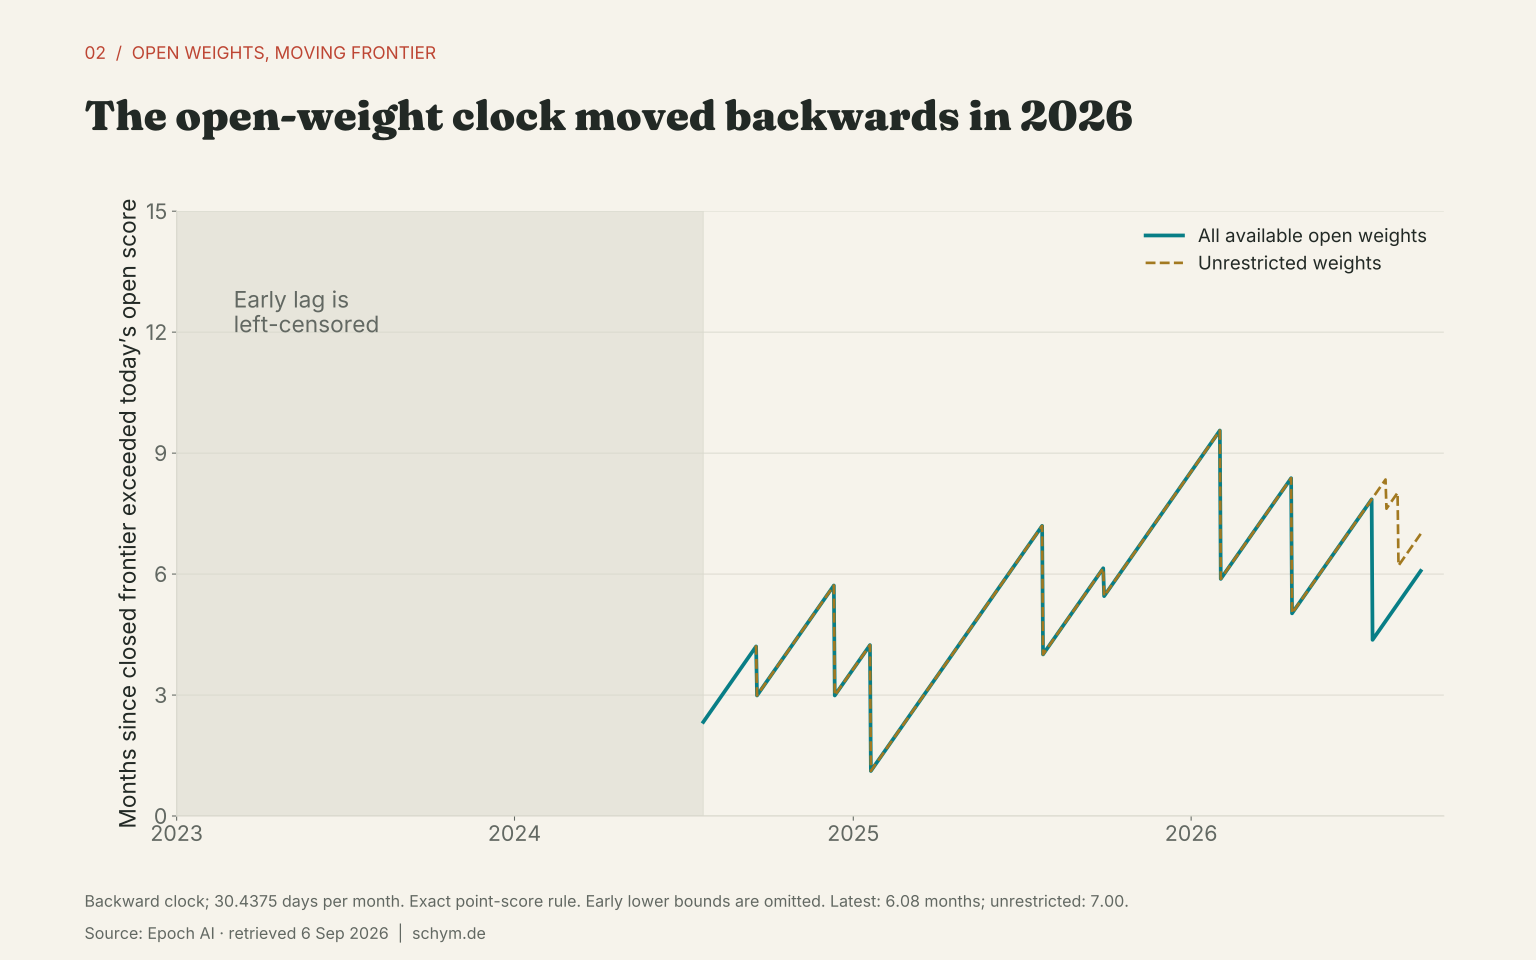
Exact values and sample counts
| date | lag_open_months | lag_open_left_censored | lag_unrestricted_months | lag_unrestricted_left_censored | n_available |
|---|---|---|---|---|---|
| 2023-02-24 | — | True | — | False | 2 |
| 2023-02-25 | — | True | — | False | 2 |
| 2023-02-26 | — | True | — | False | 2 |
| 2023-02-27 | — | True | — | False | 4 |
| 2023-02-28 | — | True | — | False | 4 |
| 2023-03-01 | — | True | — | False | 4 |
| 2023-03-02 | — | True | — | False | 4 |
| 2023-03-03 | — | True | — | False | 4 |
| 2023-03-04 | — | True | — | False | 4 |
| 2023-03-05 | — | True | — | False | 4 |
| 2023-03-06 | — | True | — | False | 4 |
| 2023-03-07 | — | True | — | False | 4 |
| 2023-03-08 | — | True | — | False | 4 |
| 2023-03-09 | — | True | — | False | 4 |
| 2023-03-10 | — | True | — | False | 4 |
| 2023-03-11 | — | True | — | False | 4 |
| 2023-03-12 | — | True | — | False | 4 |
| 2023-03-13 | — | True | — | False | 4 |
| 2023-03-14 | — | True | — | False | 4 |
| 2023-03-15 | 0 | True | 0 | True | 6 |
| 2023-03-16 | 0.033 | True | 0.033 | True | 6 |
| 2023-03-17 | 0.066 | True | 0.066 | True | 6 |
| 2023-03-18 | 0.099 | True | 0.099 | True | 6 |
| 2023-03-19 | 0.131 | True | 0.131 | True | 6 |
| 2023-03-20 | 0.164 | True | 0.164 | True | 6 |
| 2023-03-21 | 0.197 | True | 0.197 | True | 6 |
| 2023-03-22 | 0.23 | True | 0.23 | True | 6 |
| 2023-03-23 | 0.263 | True | 0.263 | True | 6 |
| 2023-03-24 | 0.296 | True | 0.296 | True | 6 |
| 2023-03-25 | 0.329 | True | 0.329 | True | 6 |
First 30 of 1,291 rows shown. The CSV contains all rows.
Download values as CSVDaily average capability gaps fell from 11.19 ECI in the observed part of 2023 to 5.94 in 2024 and 5.82 in 2025, then rose to 9.18 in 2026 through 6 September. The fully observed backward clock averaged 5.04 months in 2025 and 6.73 in 2026 to date. Early lag observations are left-censored because the first closed score already exceeded the open frontier; they cannot support an exact historical lag trend.
Seven findings from the record
- Open capability improved, but the distance did not shrink continuously. The 2026 average gap is larger than in either 2024 or 2025. The current 11.61-point difference remains positive even under the descriptive endpoint envelope of the two models’ marginal intervals, 4.72–18.96. That envelope is not a joint confidence interval.
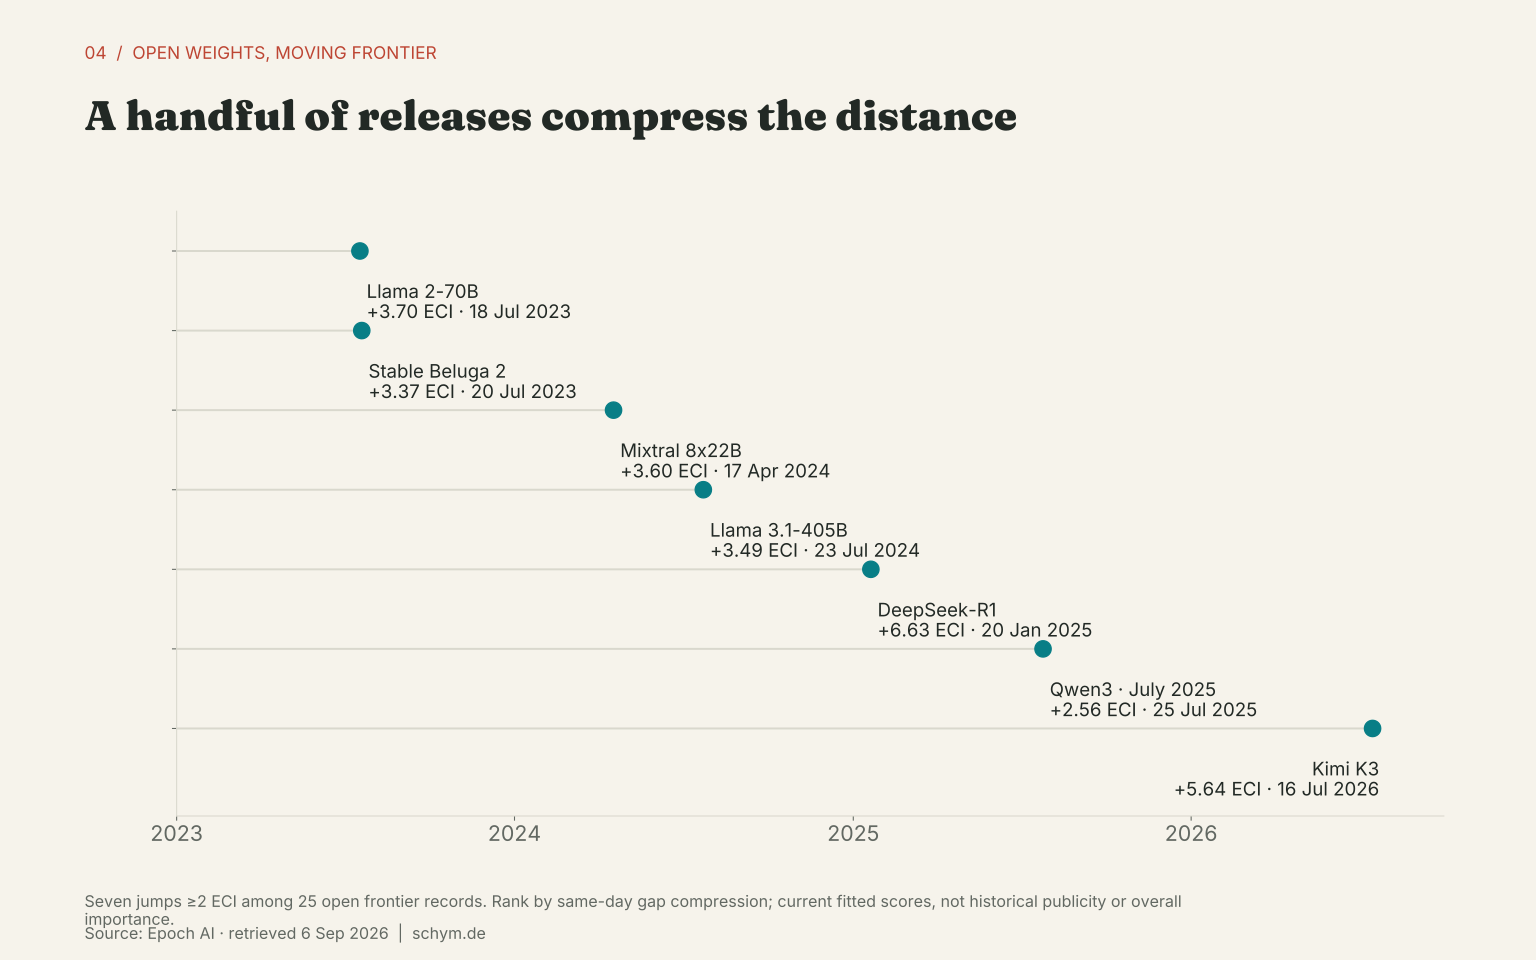
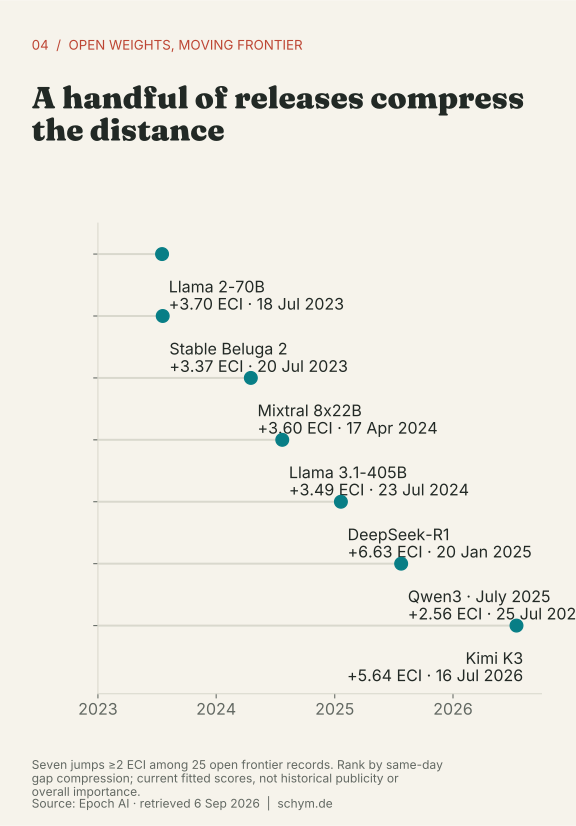
- A few releases delivered large contractions. The five largest observed open-record improvements account for 48.3% of the total improvement after the first recorded open model. DeepSeek R1 compressed the same-day gap by 69.5%; Llama 3.1-405B compressed it by 73.6%. Within 90 days, their gaps had reopened by as much as 5.01 and 5.84 points respectively.
- Downloadable does not mean unrestricted. The current open leader’s category is non-commercial. The unrestricted frontier lies another 2.20 ECI points behind it. Training code, training data, a recipe and full reproducibility remain separate questions.
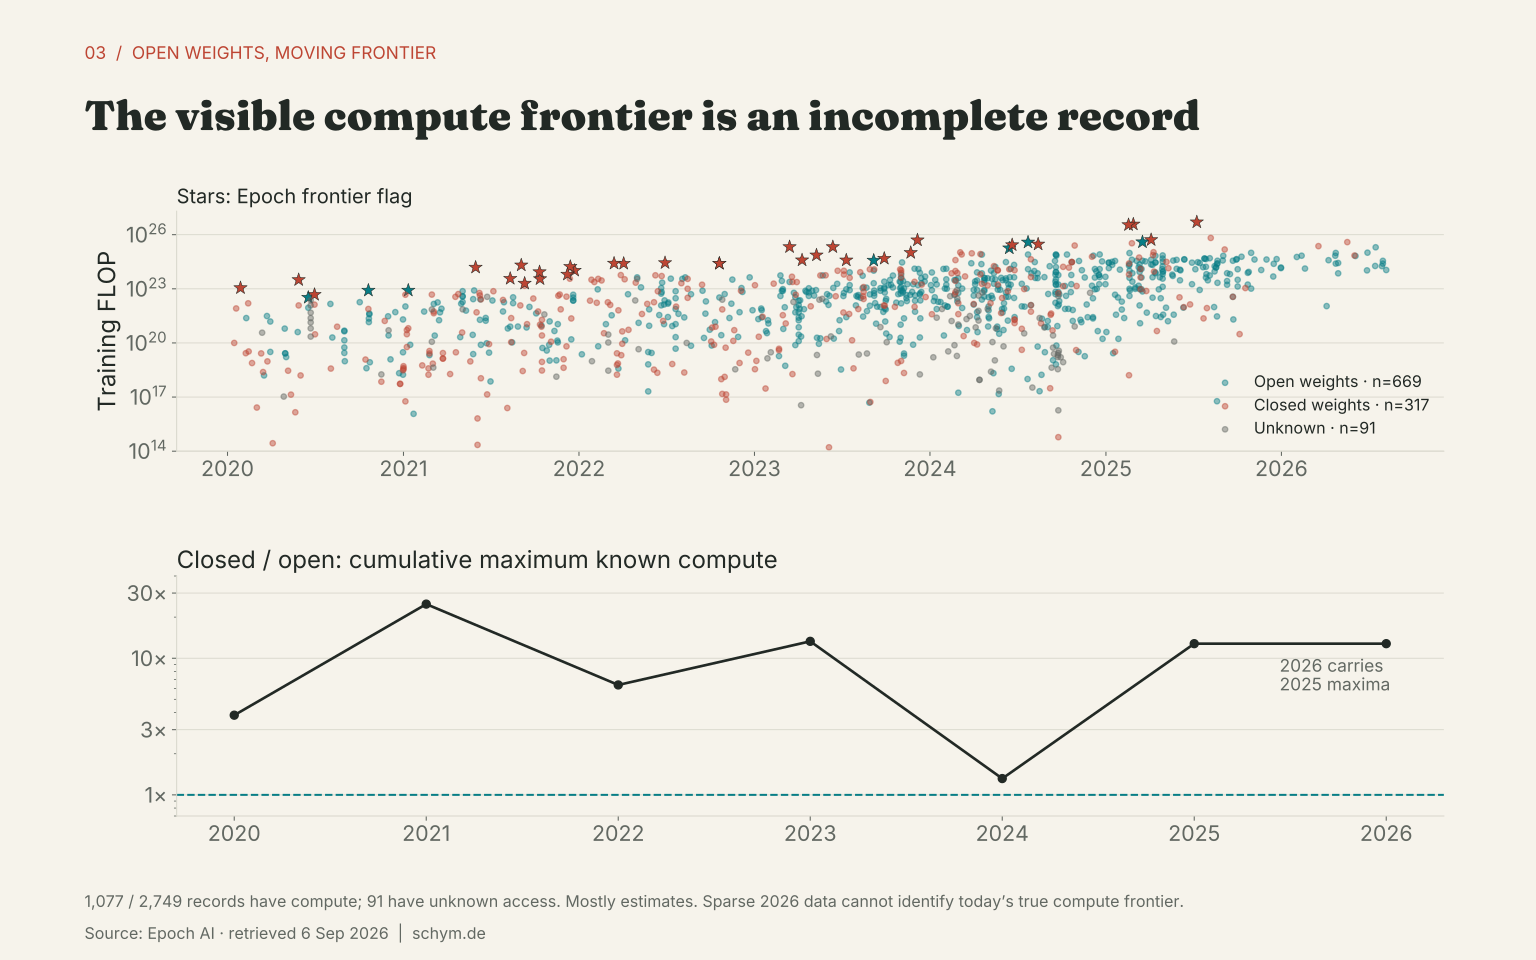
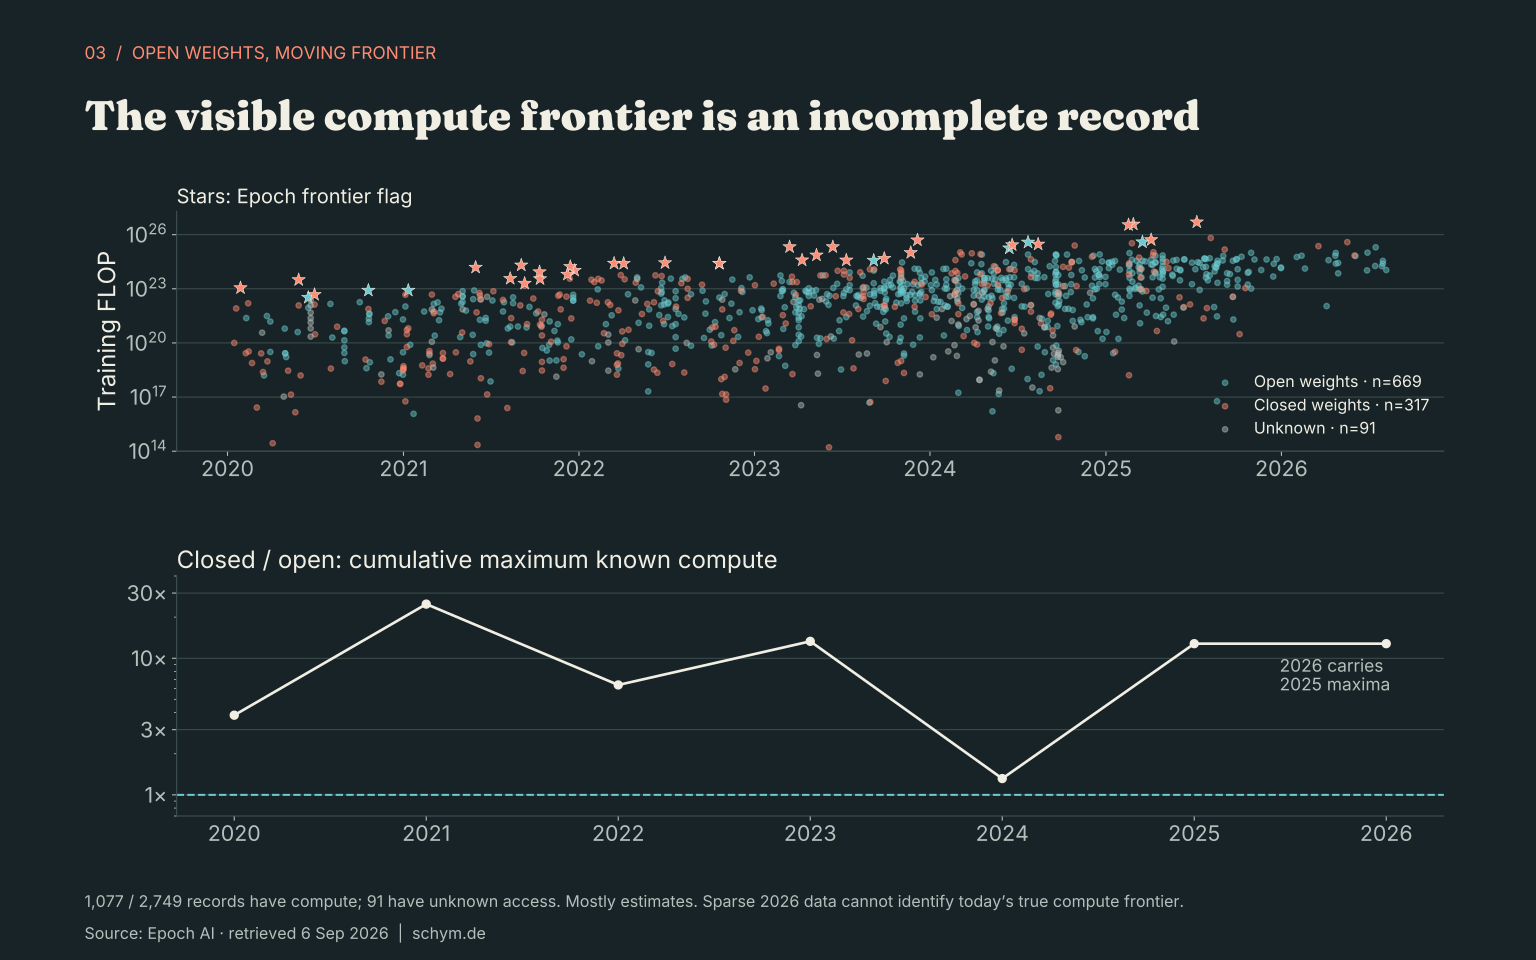
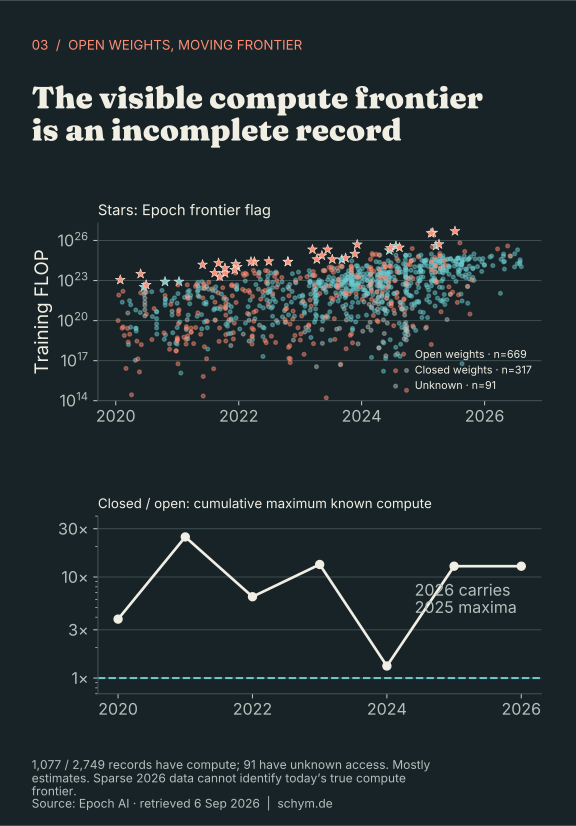
- The compute record is volatile and increasingly incomplete. The cumulative maximum-known closed/open compute ratio fell to 1.32 in 2024, then rose to 12.78 in 2025. The 2026 figure merely carries those old maxima forward. Missing recent compute prevents treating this as today’s true frontier ratio.
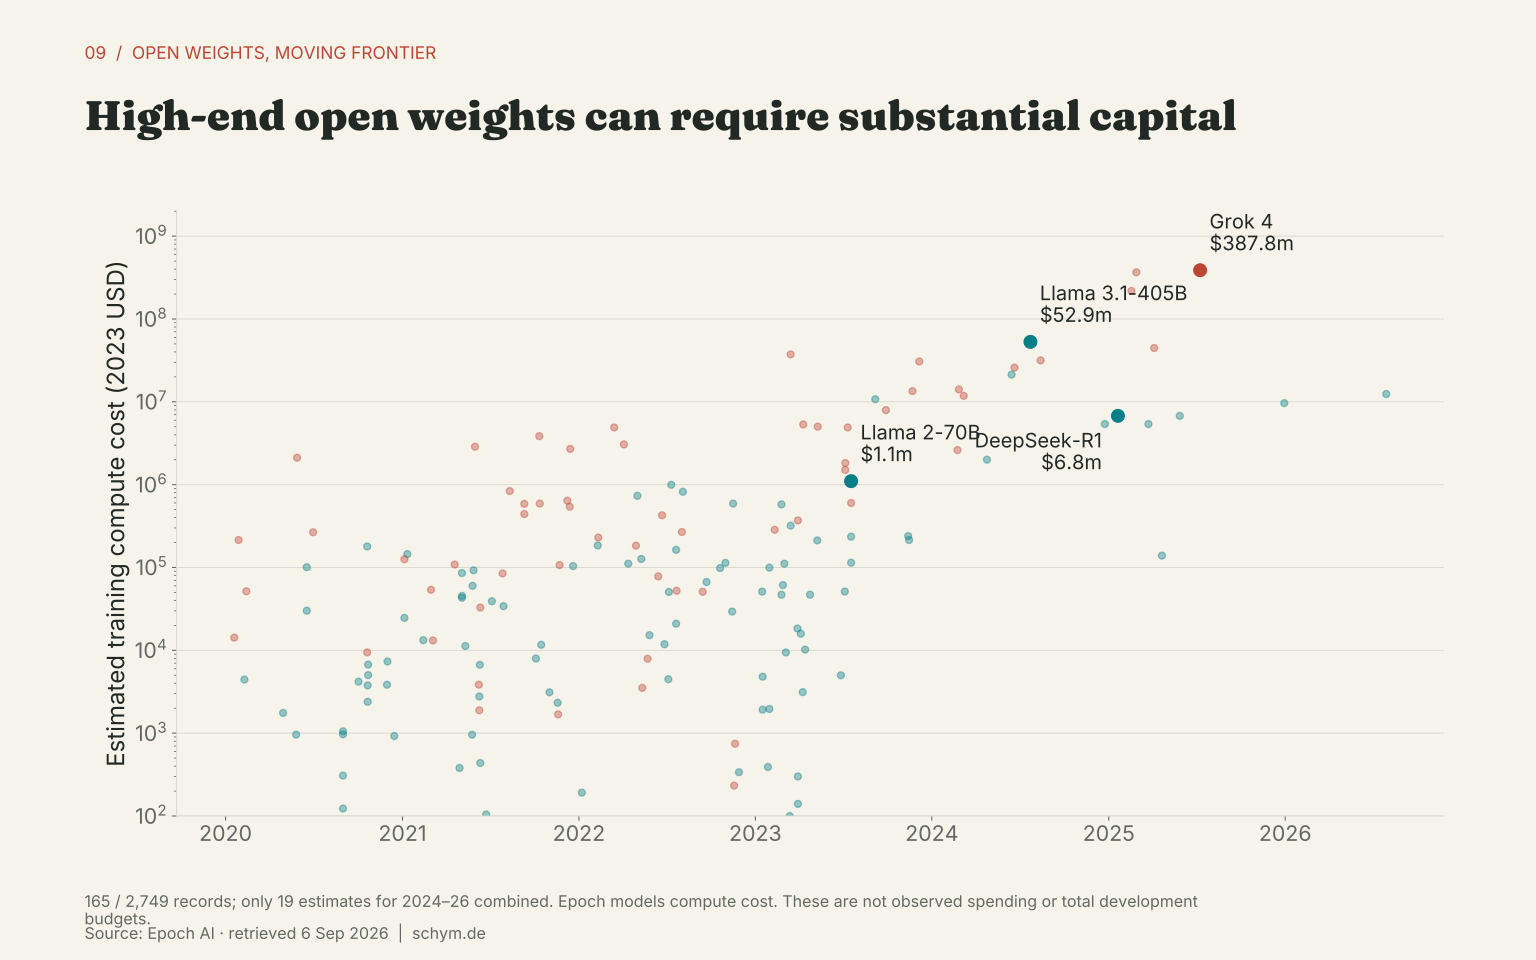
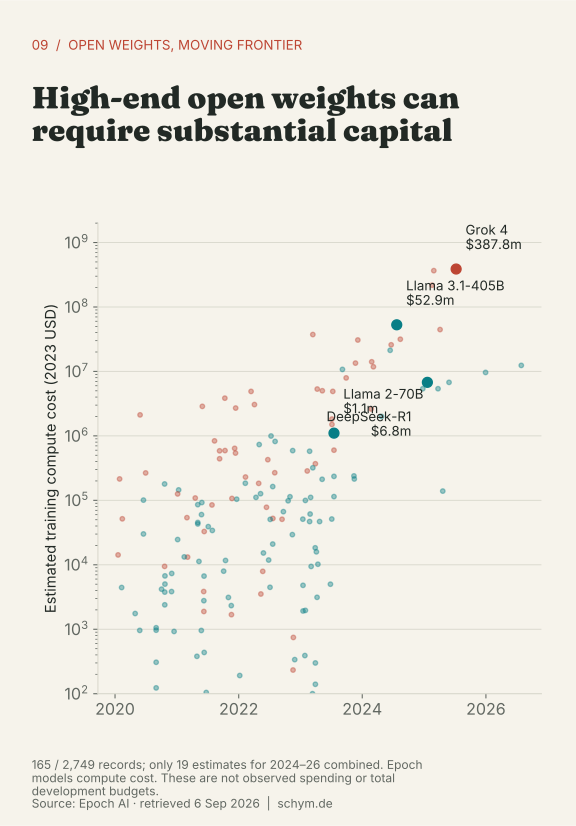
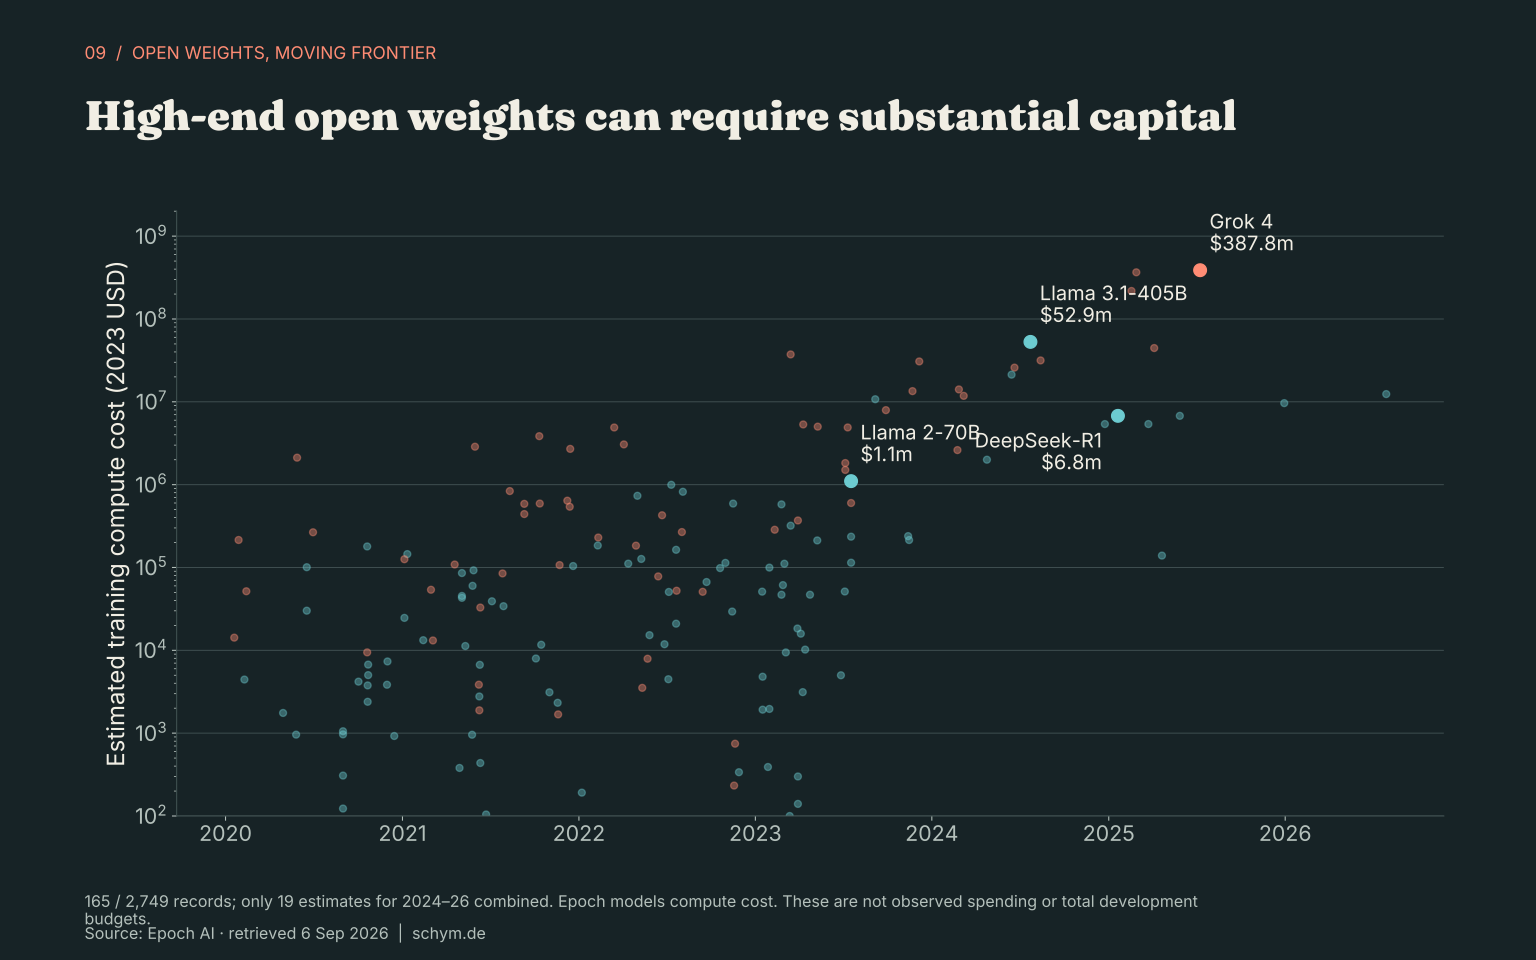
- Large open releases can be expensive; a monotonic cost trend is unproven. Epoch’s cost estimate is $52.9 million in 2023 dollars for Llama 3.1-405B, compared with $1.1 million for Llama 2-70B. DeepSeek R1’s estimate is $6.8 million. Only nineteen cost estimates cover 2024–26 combined, and these are modeled training-compute costs, not observed total budgets.
- Frontier-relevant releases come from a small set of organizations, with a strong definition effect. Among fourteen open groups released within five ECI points of the contemporary frontier, Meta, DeepSeek and Alibaba account for 85.7% of release credits. Among 56 closed groups, OpenAI, Anthropic and Google account for 92.9%. These are selected database counts, not market shares or an established concentration trend.
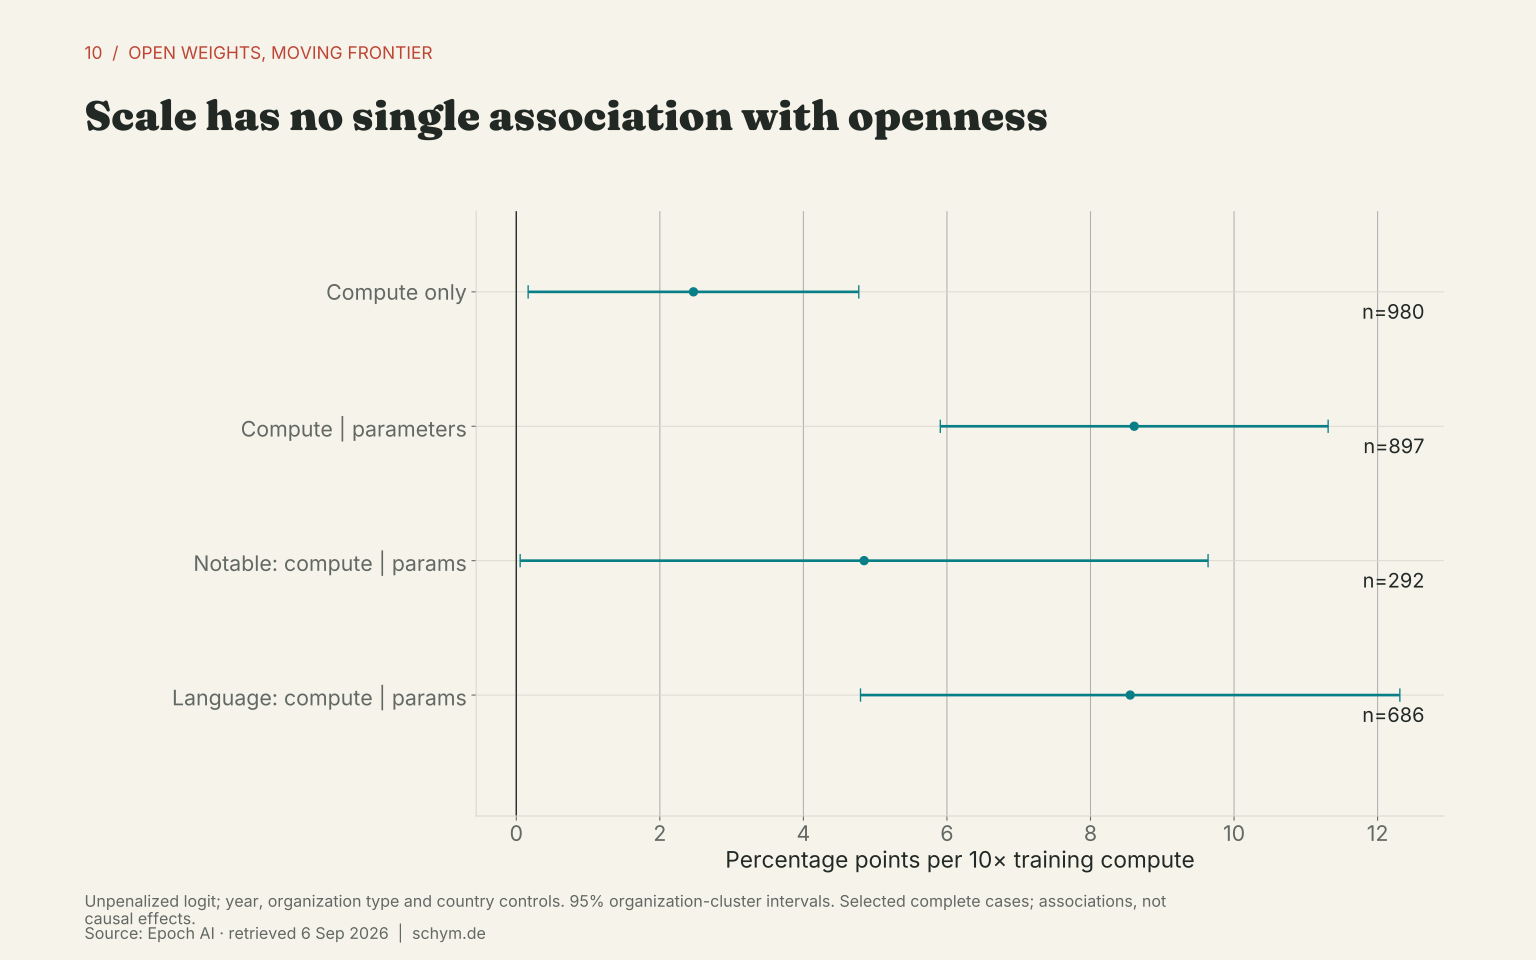
- The disclosure asymmetry is clearer than a blanket scale penalty. Parameter counts are available for 88.5% of open-weight records and 48.2% of closed records. The joint complete-case logit associates ten times greater compute with an 8.6-percentage-point higher probability of open weights, conditional on parameters and controls; the 95% interval is 5.9–11.3 points. Parameters have a negative conditional association. These selected associations reject a simple universal “larger means closed” reading, while offering no causal explanation.
Define the frontier before counting it
“Frontier” has two roles here. Epoch’s own flag identifies compute-frontier relevance. The capability race instead follows the best comparable ECI score available at each date. Keeping those definitions explicit prevents a parameter count, an expensive training run or a notable paper from silently becoming evidence of superior capability.
| Taxonomy | Recorded weight status | Frontier rule |
|---|---|---|
| Frontier closed/proprietary | API, hosted access, or unreleased | Epoch frontier flag true |
| Frontier open-weight | Unrestricted, restricted-use or non-commercial weights | Epoch frontier flag true |
| Non-frontier open-weight | Same weight categories | No positive flag; operationally “not flagged” |
| Non-frontier closed | Same closed categories | No positive flag; operationally “not flagged” |
Unknown accessibility stays outside the four-way comparison. The flag covers 49 study records, seven open and 42 closed, and stops in 2025. Its absence does not prove that a 2026 model is non-frontier. We therefore also report capability relevance within five points of the release-date ECI frontier, with three- and ten-point sensitivities.
Scale is visible unevenly
Exact values and sample counts
| year | access | frontier_only | n_models | compute_n | compute_median | compute_p90 | compute_max |
|---|---|---|---|---|---|---|---|
| 2020 | Open weights | False | 51 | 36 | 4.2e+20 | 1.17e+22 | 8.2e+22 |
| 2020 | Open weights | True | 2 | 2 | 5.75e+22 | 7.71e+22 | 8.2e+22 |
| 2020 | Closed weights | False | 60 | 30 | 1.91e+19 | 1.89e+22 | 3.14e+23 |
| 2020 | Closed weights | True | 3 | 3 | 1.12e+23 | 2.74e+23 | 3.14e+23 |
| 2021 | Open weights | False | 79 | 59 | 1.81e+21 | 3.43e+22 | 8.22e+22 |
| 2021 | Open weights | True | 1 | 1 | 8.22e+22 | 8.22e+22 | 8.22e+22 |
| 2021 | Closed weights | False | 115 | 73 | 6.5e+20 | 3.62e+23 | 2.05e+24 |
| 2021 | Closed weights | True | 9 | 9 | 8.59e+23 | 1.77e+24 | 2.05e+24 |
| 2022 | Open weights | False | 105 | 62 | 5.76e+21 | 2.1e+23 | 4.3e+23 |
| 2022 | Open weights | True | 0 | 0 | — | — | — |
| 2022 | Closed weights | False | 103 | 59 | 6.42e+21 | 5.63e+23 | 2.74e+24 |
| 2022 | Closed weights | True | 5 | 5 | 2.54e+24 | 2.68e+24 | 2.74e+24 |
| 2023 | Open weights | False | 269 | 155 | 4.03e+22 | 2.95e+23 | 3.76e+24 |
| 2023 | Open weights | True | 1 | 1 | 3.76e+24 | 3.76e+24 | 3.76e+24 |
| 2023 | Closed weights | False | 181 | 62 | 4.26e+22 | 3.89e+24 | 5e+25 |
| 2023 | Closed weights | True | 9 | 8 | 8.67e+24 | 2.97e+25 | 5e+25 |
| 2024 | Open weights | False | 403 | 197 | 9.36e+22 | 1.7e+24 | 3.8e+25 |
| 2024 | Open weights | True | 2 | 2 | 2.8e+25 | 3.6e+25 | 3.8e+25 |
| 2024 | Closed weights | False | 292 | 60 | 1.41e+23 | 8.04e+24 | 2.96e+25 |
| 2024 | Closed weights | True | 10 | 2 | 2.83e+25 | 2.93e+25 | 2.96e+25 |
| 2025 | Open weights | False | 304 | 141 | 9.18e+23 | 4.32e+24 | 3.91e+25 |
| 2025 | Open weights | True | 1 | 1 | 3.91e+25 | 3.91e+25 | 3.91e+25 |
| 2025 | Closed weights | False | 235 | 30 | 7.62e+23 | 9.44e+25 | 5e+26 |
| 2025 | Closed weights | True | 6 | 4 | 3.65e+26 | 4.64e+26 | 5e+26 |
| 2026 | Open weights | False | 58 | 19 | 2.7e+24 | 9.78e+24 | 2e+25 |
| 2026 | Open weights | True | 0 | 0 | — | — | — |
| 2026 | Closed weights | False | 79 | 3 | 2.32e+25 | 3.56e+25 | 3.87e+25 |
| 2026 | Closed weights | True | 0 | 0 | — | — | — |
Of 2,749 records dated since 2020, 1,077 contain training compute. Only 55 carry the strict estimation-method label “Reported”, and only 48 of those have known accessibility. A reported figure can still be a developer’s calculation rather than a meter reading. The public capability subset contains just four groups under this strict compute screen, which is insufficient for a two-sided capability frontier.
The Epoch-flagged cumulative frontier ratio also moves from 1.32 in 2024 to 12.78 in 2025, but the flag has no 2026 additions. The annual tables report medians, 90th percentiles and maxima for all open, all closed and each flagged-frontier class, with the number of populated compute observations. A second table follows cumulative records and their original dates. The distinction matters: a maximum that stays flat because new models have no disclosed compute is not evidence that frontier investment stopped.
The release is the event
Exact values and sample counts
| date | model | eci | overall_frontier | distance | open_jump | gap_before | compression | compression_share | organization | compute | parameters | cost | model_access | rank_by_gap_compression |
|---|---|---|---|---|---|---|---|---|---|---|---|---|---|---|
| 2025-01-20 | DeepSeek-R1 | 138.99 | 141.9 | 2.91 | 6.63 | 9.54 | 6.63 | 0.695 | DeepSeek | 3.5e+24 | 6.71e+11 | 6.77e+06 | Open weights (unrestricted) | 1 |
| 2026-07-16 | Kimi K3 | 157.62 | 162.9 | 5.28 | 5.64 | 10.92 | 5.64 | 0.516 | Moonshot | 2e+25 | 2.8e+12 | — | Open weights (non-commercial) | 2 |
| 2023-07-18 | Llama 2-70B | 113.61 | 125.88 | 12.27 | 3.7 | 15.97 | 3.7 | 0.232 | Meta AI | 8.1e+23 | 7e+10 | 1.1e+06 | Open weights (restricted use) | 3 |
| 2024-04-17 | Mixtral 8x22B | 121.98 | 127.25 | 5.27 | 3.6 | 8.87 | 3.6 | 0.406 | Mistral AI | 2.34e+24 | 1.41e+11 | — | Open weights (unrestricted) | 4 |
| 2024-07-23 | Llama 3.1-405B | 128.75 | 130 | 1.25 | 3.49 | 4.74 | 3.49 | 0.736 | Meta AI | 3.8e+25 | 4.05e+11 | 5.29e+07 | Open weights (restricted use) | 5 |
| 2023-07-20 | Stable Beluga 2 | 116.98 | 125.88 | 8.9 | 3.37 | 12.27 | 3.37 | 0.275 | Stability AI | — | 7e+10 | — | Open weights (non-commercial) | 6 |
| 2025-07-25 | Qwen3-235B-A22B-Thinking (Jul 2025) | 143.88 | 147.46 | 3.58 | 2.56 | 6.14 | 2.56 | 0.417 | Alibaba | 4.75e+24 | 2.35e+11 | — | Open weights (unrestricted) | 7 |
| 2025-05-28 | DeepSeek-R1 (May 2025) | 141.32 | 146.91 | 5.59 | 1.94 | 7.53 | 1.94 | 0.258 | DeepSeek | 4.02e+24 | 6.71e+11 | 6.77e+06 | Open weights (unrestricted) | 8 |
| 2024-12-26 | DeepSeek-V3 | 132.36 | 141.9 | 9.54 | 1.93 | 11.47 | 1.93 | 0.168 | DeepSeek | 3.3e+24 | 6.71e+11 | 5.39e+06 | Open weights (restricted use) | 9 |
| 2024-05-07 | DeepSeek-V2 (MoE-236B, May 2024) | 124.77 | 127.25 | 2.48 | 1.87 | 4.35 | 1.87 | 0.43 | DeepSeek | — | — | — | Open weights (restricted use) | 10 |
| 2026-02-02 | Kimi K2.5 | 148.02 | 155.3 | 7.28 | 1.81 | 9.09 | 1.81 | 0.199 | Moonshot | 5.8e+24 | 1.04e+12 | — | Open weights (unrestricted) | 11 |
| 2026-04-07 | GLM-5.1 | 149.68 | 158.89 | 9.21 | 1.66 | 10.87 | 1.66 | 0.153 | Z.ai (Zhipu AI) | — | 7.54e+11 | — | Open weights (unrestricted) | 12 |
| 2024-12-12 | Phi-4 | 130.43 | 135.84 | 5.41 | 1.43 | 6.84 | 1.43 | 0.209 | Microsoft Research | 9.32e+23 | 1.4e+10 | — | Open weights (unrestricted) | 13 |
| 2026-04-20 | Kimi K2.6 | 150.98 | 158.89 | 7.91 | 1.3 | 9.21 | 1.3 | 0.141 | Moonshot | — | 1.04e+12 | — | Open weights (unrestricted) | 14 |
| 2025-09-29 | DeepSeek-V3.2-Exp | 145.06 | 150 | 4.94 | 1.18 | 6.12 | 1.18 | 0.193 | DeepSeek | 4.18e+24 | 6.71e+11 | — | Open weights (unrestricted) | 15 |
| 2023-12-11 | Mixtral 8x7B | 118.38 | 126.46 | 8.08 | 1.1 | 9.18 | 1.1 | 0.12 | Mistral AI | 7.74e+23 | 4.67e+10 | — | Open weights (unrestricted) | 16 |
| 2026-06-16 | GLM-5.2 | 151.98 | 162.9 | 10.92 | 1 | 11.92 | 1 | 0.084 | Z.ai (Zhipu AI) | — | 7.44e+11 | — | Open weights (unrestricted) | 17 |
| 2024-04-18 | Llama 3-70B | 122.9 | 127.25 | 4.35 | 0.92 | 5.27 | 0.92 | 0.175 | Meta AI | 7.86e+24 | 7e+10 | — | Open weights (restricted use) | 18 |
| 2025-11-06 | Kimi K2 Thinking | 145.79 | 150.3 | 4.51 | 0.73 | 5.24 | 0.73 | 0.139 | Moonshot | 4.2e+24 | 1e+12 | — | Open weights (restricted use) | 19 |
| 2024-06-07 | Qwen2-72B | 125.26 | 128.98 | 3.72 | 0.49 | 4.21 | 0.49 | 0.116 | Alibaba | 3.02e+24 | 7.27e+10 | — | Open weights (unrestricted) | 20 |
| 2025-12-01 | DeepSeek-V3.2 | 146.21 | 152.94 | 6.73 | 0.42 | 7.15 | 0.42 | 0.059 | DeepSeek | 4.2e+24 | — | — | Open weights (unrestricted) | 21 |
| 2025-04-29 | Qwen3-235B-A22B | 139.38 | 146.91 | 7.53 | 0.39 | 7.92 | 0.39 | 0.049 | Alibaba | 4.75e+24 | 2.35e+11 | — | Open weights (unrestricted) | 22 |
| 2023-11-02 | Yi-34B | 117.28 | 125.88 | 8.6 | 0.3 | 8.9 | 0.3 | 0.034 | 01.AI | 6.1e+23 | 3.4e+10 | — | Open weights (restricted use) | 23 |
| 2024-09-19 | Qwen2.5-72B | 129 | 135.84 | 6.84 | 0.25 | 7.09 | 0.25 | 0.035 | Alibaba | 7.8e+24 | 7.27e+10 | — | Open weights (unrestricted) | 24 |
| 2023-02-24 | LLaMA-65B | 109.91 | 109.91 | 0 | — | — | — | — | Meta AI | 5.5e+23 | 6.52e+10 | 5.78e+05 | Open weights (non-commercial) | — |
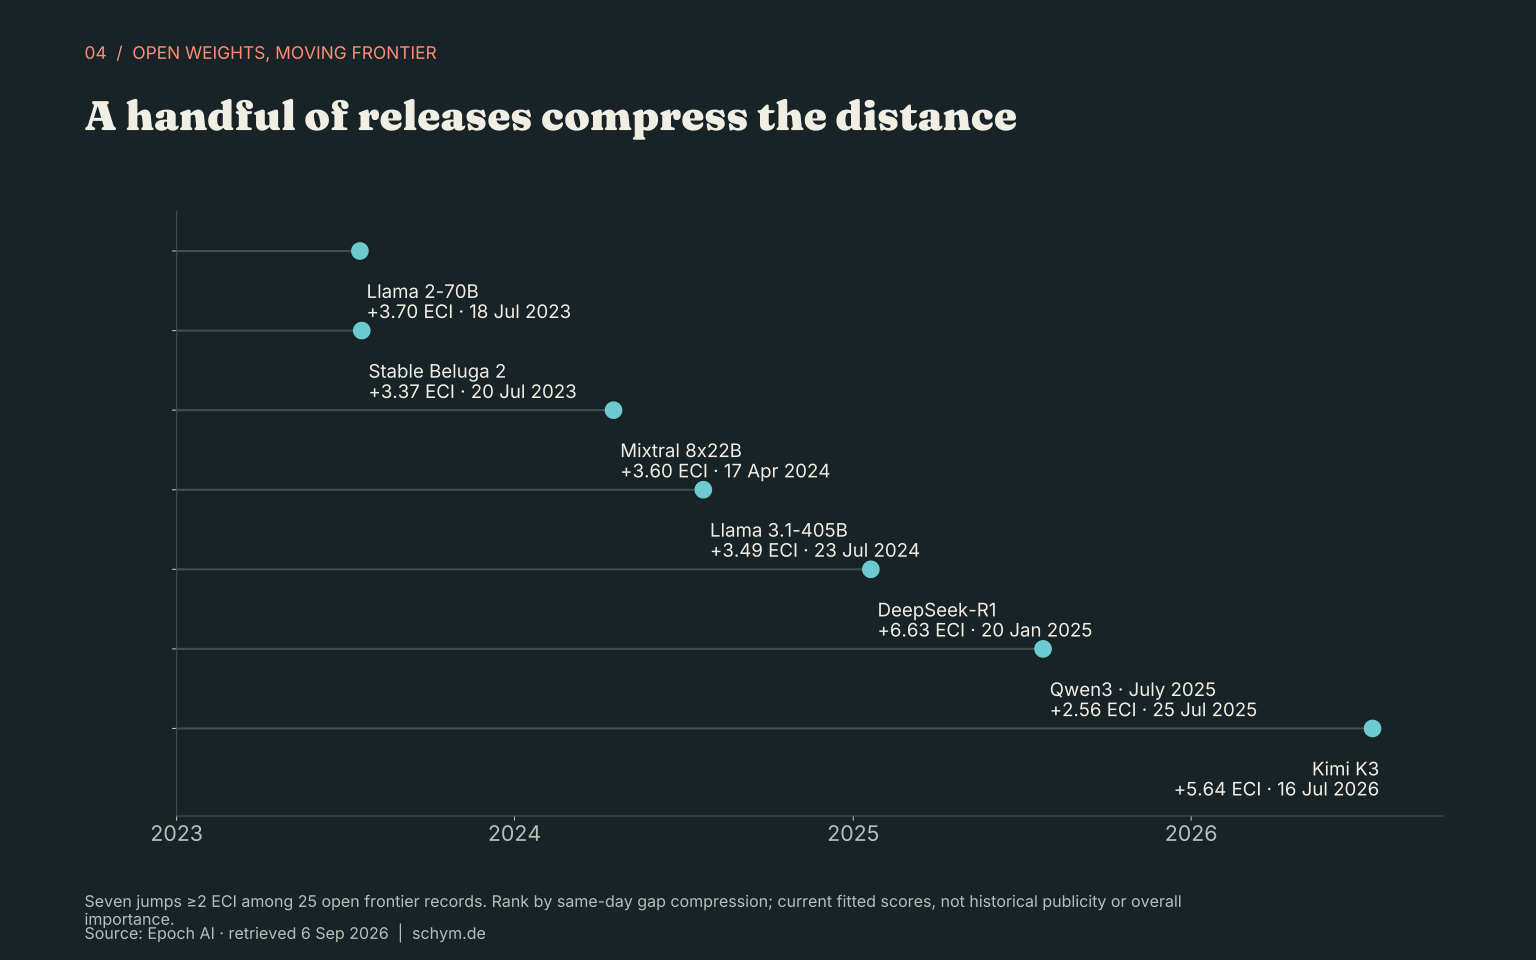
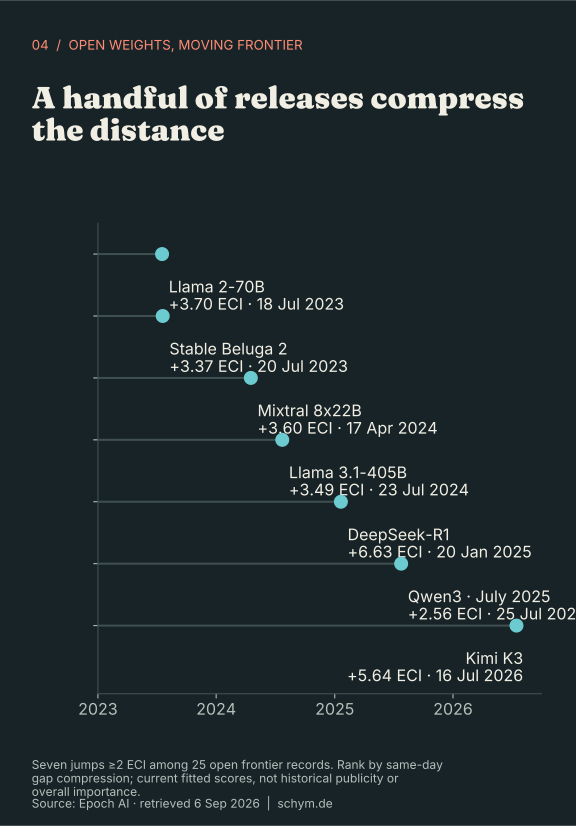
Llama 3.1 brought the open record close to the frontier in July 2024. DeepSeek R1 did so again in January 2025. Kimi K3 compressed the gap from 10.92 to 5.28 points in July 2026, a 51.6% reduction, before the closed record moved away again. By the September cutoff that gap had widened by another 6.33 points.
Not every improvement is followed by immediate reopening. The earlier Llama 2, Stable Beluga and Mixtral episodes did not show a larger gap within the next ninety days. Nor do step-shaped lines alone prove a burst process: release maxima are steps by construction. The stronger evidence is the concentration of large gains, the measured reopenings after several major releases and the reversal of the annual average gap.
The ranked breakthrough list uses measured ECI-gap compression. It does not rank scientific originality, ecosystem influence or the social value of an open release. For 2020–22, the annual model table identifies high-compute open releases such as mT5-XXL, Switch and OPT-175B as relevance markers; their capability distance remains unavailable.
Many releases, few frontier producers
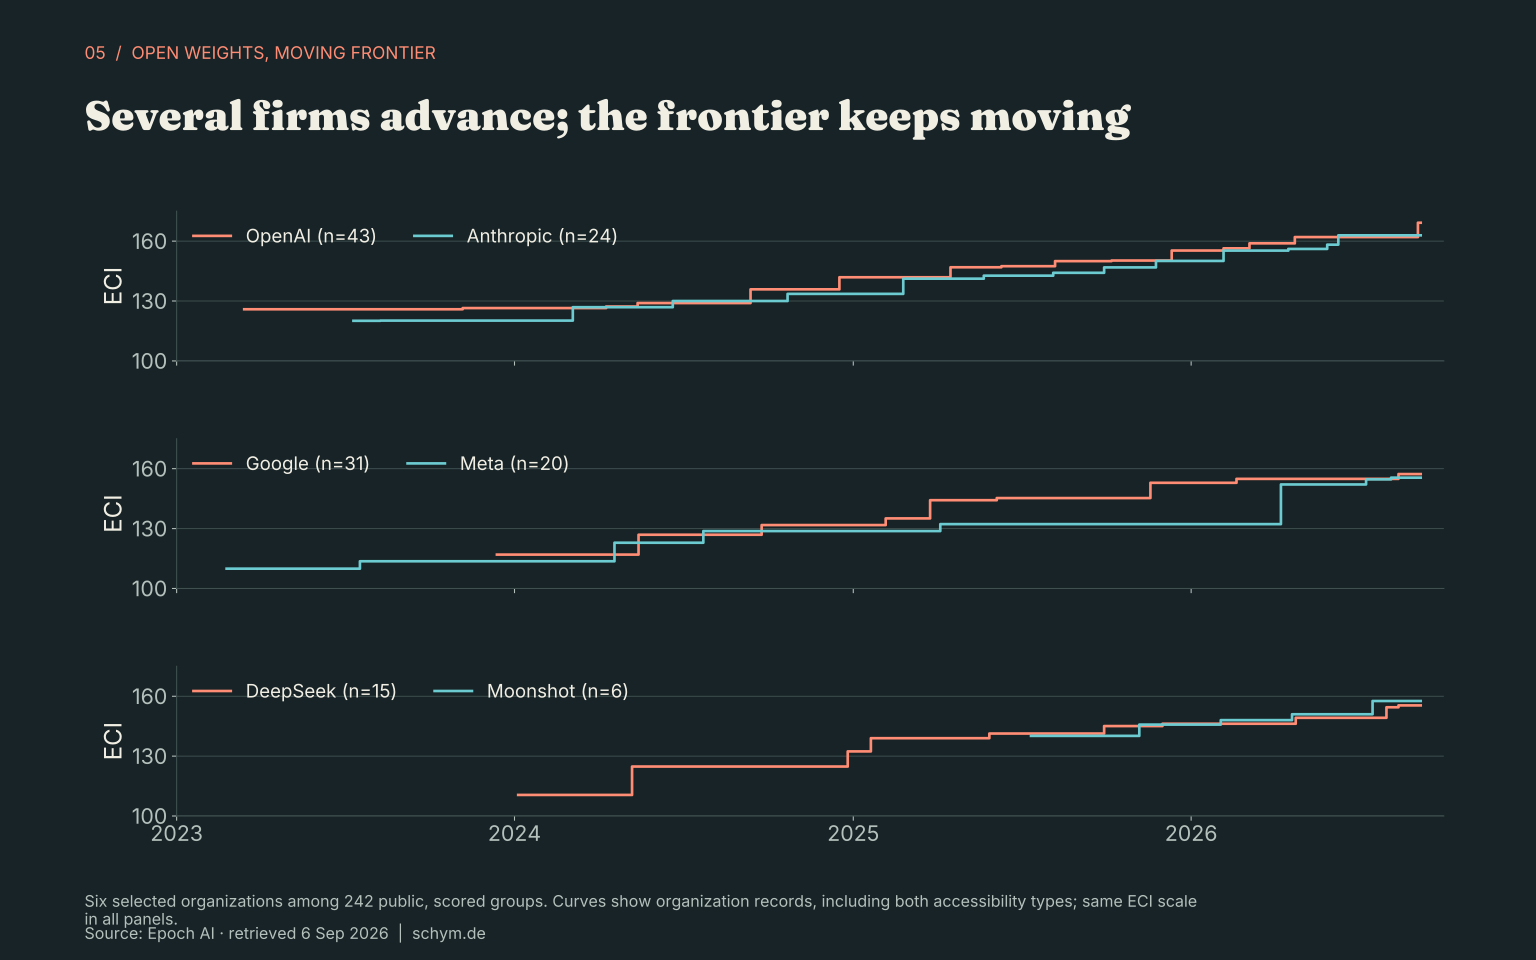
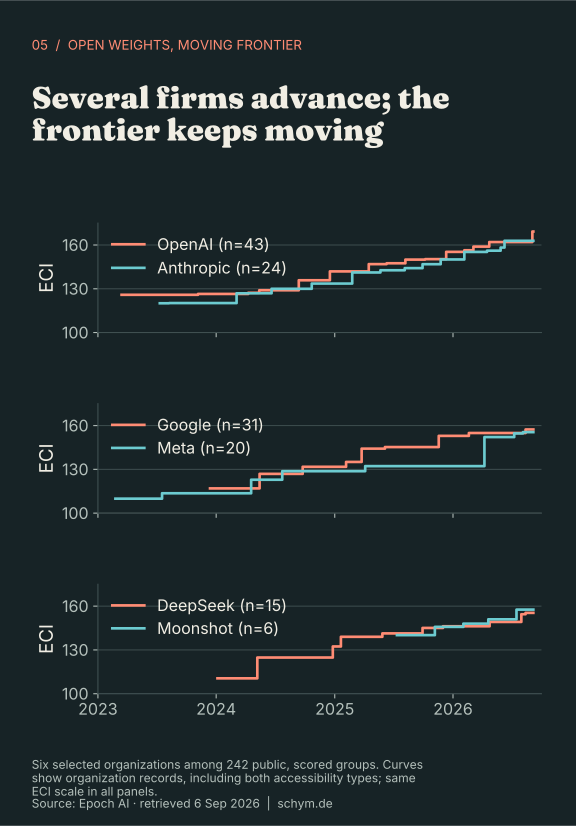
Exact values and sample counts
| group | organization | date | access | eci | distance_at_release |
|---|---|---|---|---|---|
| Claude Fable 5.1 | Anthropic | 2026-09-01 | Closed weights | 162.88 | 0.02 |
| GPT-4o mini | OpenAI | 2024-07-18 | Closed weights | 126.56 | 3.44 |
| GPT-4o (Aug 2024) | OpenAI | 2024-08-06 | Closed weights | 128.78 | 1.22 |
| GPT-4.1 nano | OpenAI | 2025-04-14 | Closed weights | 129.63 | 14.57 |
| GPT-4.1 mini | OpenAI | 2025-04-14 | Closed weights | 135.03 | 9.17 |
| GPT-4.1 | OpenAI | 2025-04-14 | Closed weights | 136.82 | 7.38 |
| o3-mini | OpenAI | 2025-01-31 | Closed weights | 140.38 | 1.52 |
| o1 | OpenAI | 2024-12-17 | Closed weights | 141.9 | 0 |
| Muse Spark 1.1 | Meta AI | 2026-07-09 | Closed weights | 154.65 | 8.25 |
| Claude 3 Opus | Anthropic | 2024-03-04 | Closed weights | 126.9 | 0 |
| GLM-5.3 | Z.ai (Zhipu AI) | 2026-08-14 | Closed weights | 155.3 | 7.6 |
| Qwen3.5-35B-A3B | Alibaba | 2026-02-24 | Open weights | 142.54 | 13.86 |
| Qwen3-32B | Alibaba | 2025-04-29 | Open weights | 138.53 | 8.38 |
| Qwen3-30B-A3B-Thinking (Jul 2025) | Alibaba | 2025-07-30 | Open weights | 139.66 | 7.8 |
| Qwen3-30B-A3B-Instruct (Jul 2025) | Alibaba | 2025-07-29 | Open weights | 137.44 | 10.02 |
| Qwen3-30B-A3B | Alibaba | 2025-04-29 | Open weights | 136.2 | 10.71 |
| Qwen3-14B | Alibaba | 2025-04-29 | Open weights | 138.26 | 8.65 |
| Qwen2.5-7B | Alibaba | 2024-09-19 | Open weights | 118.44 | 17.4 |
| Qwen2.5-32B | Alibaba | 2024-09-17 | Open weights | 128.53 | 7.31 |
| phi-3-mini 3.8B | Microsoft | 2024-04-23 | Open weights | 117.24 | 10.01 |
| Mistral Small 3.2 | Mistral AI | 2025-06-20 | Open weights | 131.75 | 15.71 |
| Mistral Small 3.1 | Mistral AI | 2025-03-17 | Open weights | 127.48 | 14.42 |
| Mistral Small 3 | Mistral AI | 2025-01-30 | Open weights | 127.07 | 14.83 |
| Mistral 7B v0.3 | Mistral AI | 2023-10-10 | Open weights | 108.75 | 17.13 |
| Magistral Small 1.2 | Mistral AI | 2025-09-18 | Open weights | 131.42 | 18.58 |
| Llama 3.2 1B | Meta AI | 2024-09-24 | Open weights | 102.43 | 33.41 |
| Llama 3-8B | Meta AI | 2024-04-18 | Open weights | 116.33 | 10.92 |
| Llama 2-7B | Meta AI | 2023-07-18 | Open weights | 98.61 | 27.27 |
| Gemini 3.1 Flash-Lite | 2026-03-03 | Closed weights | 144.51 | 11.89 | |
| Qwen 3.6 35B-A3B | Alibaba | 2026-04-14 | Open weights | 143.88 | 15.01 |
First 30 of 242 rows shown. The CSV contains all rows.
Download values as CSV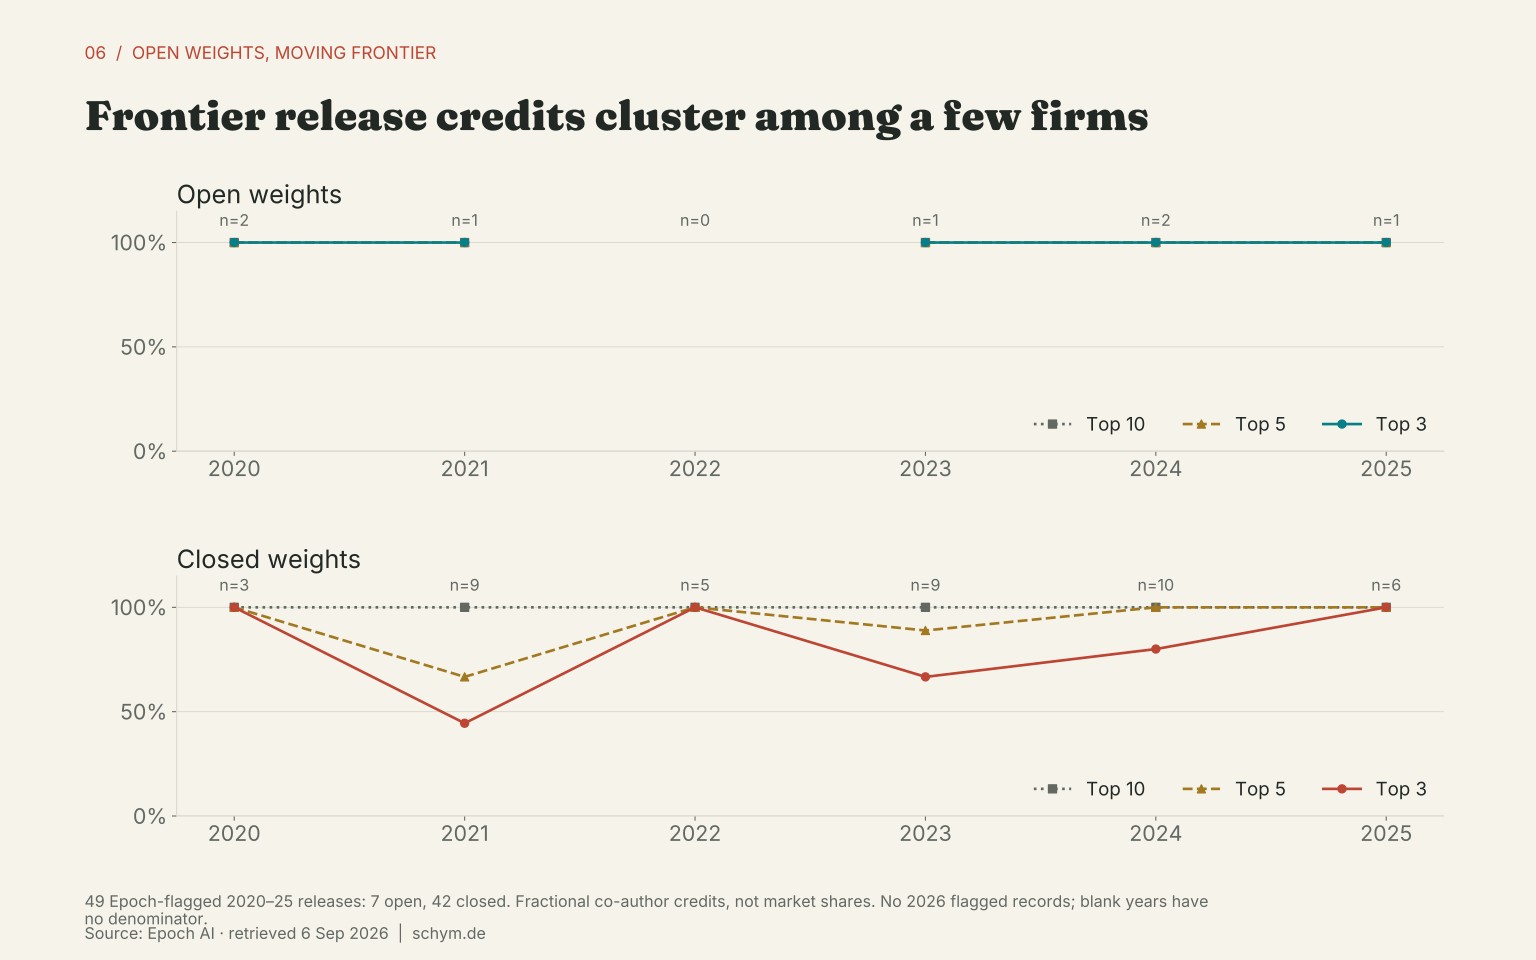
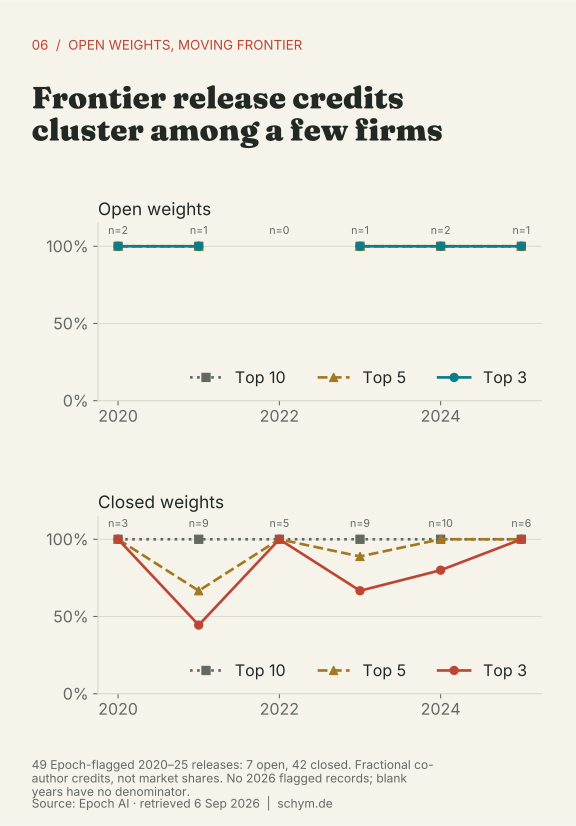
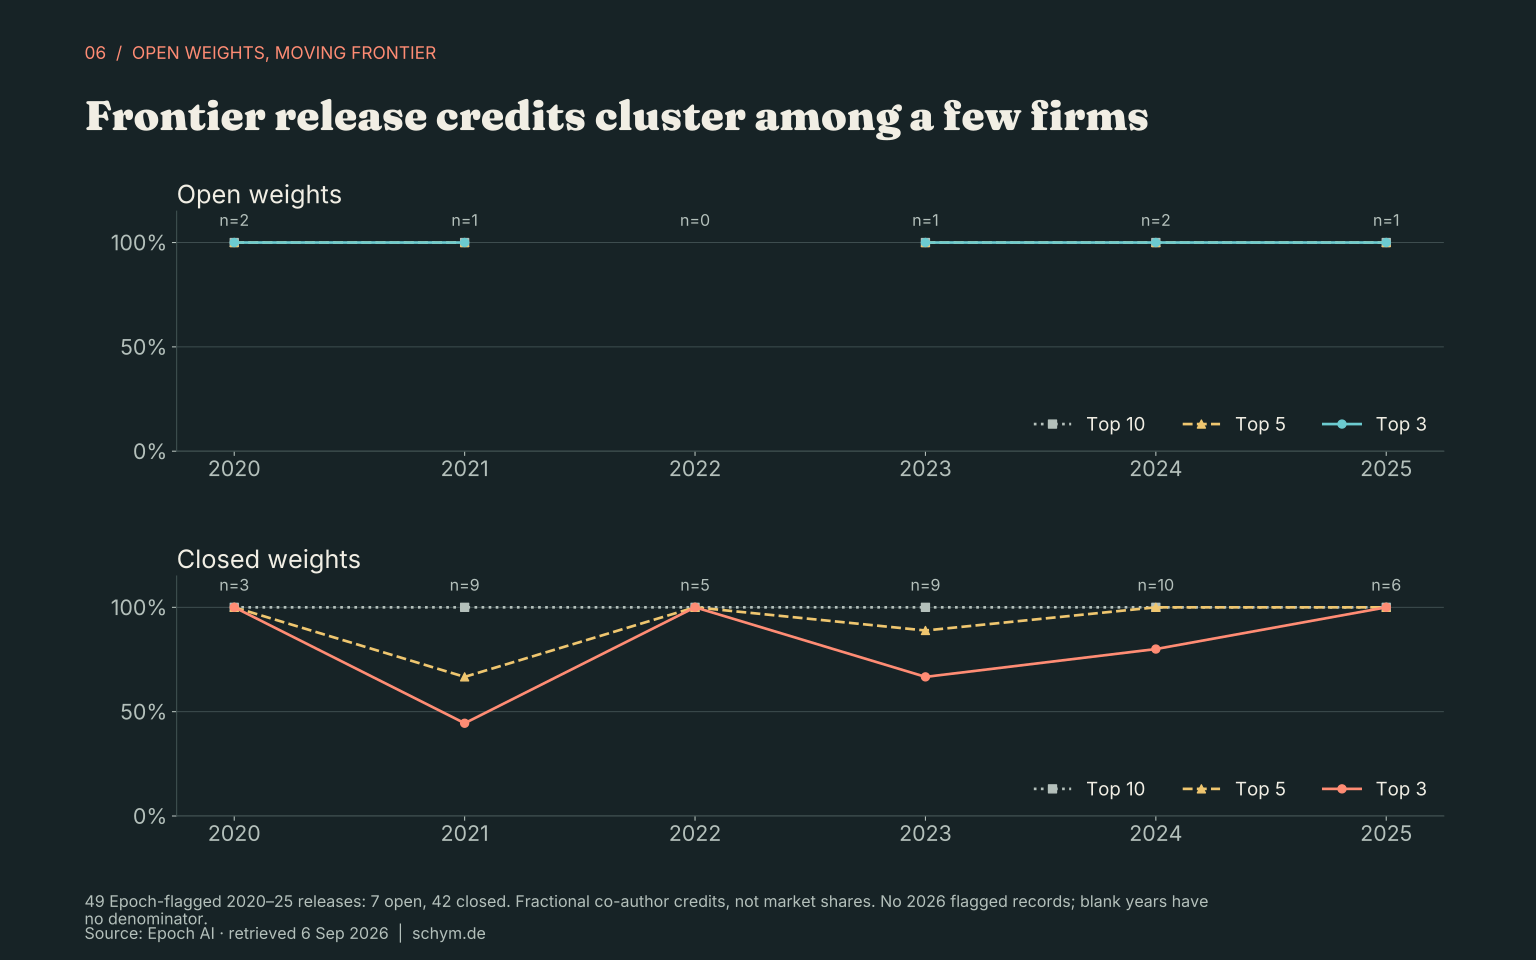
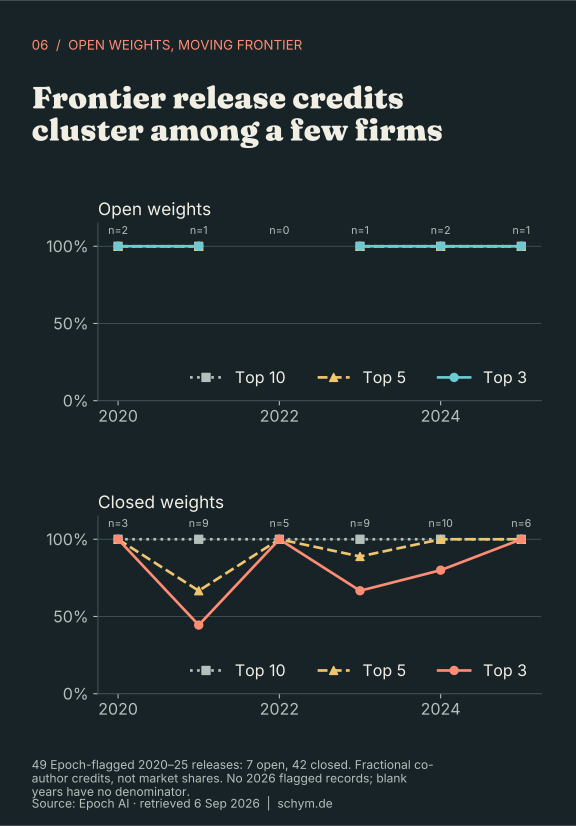
Exact values and sample counts
| scope | year | access | level | n_models | n_attributed | n_entities | top3 | top5 | top10 | hhi |
|---|---|---|---|---|---|---|---|---|---|---|
| epoch_frontier | 2020 | Open weights | organization | 2 | 2 | 2 | 1 | 1 | 1 | 5000 |
| epoch_frontier | 2020 | Open weights | country | 2 | 2 | 1 | 1 | 1 | 1 | 10000 |
| epoch_frontier | 2020 | Closed weights | organization | 3 | 3 | 3 | 1 | 1 | 1 | 3333.333 |
| epoch_frontier | 2020 | Closed weights | country | 3 | 3 | 1 | 1 | 1 | 1 | 10000 |
| epoch_frontier | 2021 | Open weights | organization | 1 | 1 | 1 | 1 | 1 | 1 | 10000 |
| epoch_frontier | 2021 | Open weights | country | 1 | 1 | 1 | 1 | 1 | 1 | 10000 |
| epoch_frontier | 2021 | Closed weights | organization | 9 | 9 | 10 | 0.444 | 0.667 | 1 | 1234.568 |
| epoch_frontier | 2021 | Closed weights | country | 9 | 9 | 5 | 0.778 | 1 | 1 | 2345.679 |
| epoch_frontier | 2022 | Open weights | organization | 0 | 0 | 0 | — | — | — | — |
| epoch_frontier | 2022 | Open weights | country | 0 | 0 | 0 | — | — | — | — |
| epoch_frontier | 2022 | Closed weights | organization | 5 | 5 | 2 | 1 | 1 | 1 | 6800 |
| epoch_frontier | 2022 | Closed weights | country | 5 | 5 | 1 | 1 | 1 | 1 | 10000 |
| epoch_frontier | 2023 | Open weights | organization | 1 | 1 | 1 | 1 | 1 | 1 | 10000 |
| epoch_frontier | 2023 | Open weights | country | 1 | 1 | 1 | 1 | 1 | 1 | 10000 |
| epoch_frontier | 2023 | Closed weights | organization | 9 | 9 | 6 | 0.667 | 0.889 | 1 | 2098.765 |
| epoch_frontier | 2023 | Closed weights | country | 9 | 9 | 2 | 1 | 1 | 1 | 8024.691 |
| epoch_frontier | 2024 | Open weights | organization | 2 | 2 | 2 | 1 | 1 | 1 | 5000 |
| epoch_frontier | 2024 | Open weights | country | 2 | 2 | 1 | 1 | 1 | 1 | 10000 |
| epoch_frontier | 2024 | Closed weights | organization | 10 | 10 | 5 | 0.8 | 1 | 1 | 2600 |
| epoch_frontier | 2024 | Closed weights | country | 10 | 10 | 2 | 1 | 1 | 1 | 6800 |
| epoch_frontier | 2025 | Open weights | organization | 1 | 1 | 1 | 1 | 1 | 1 | 10000 |
| epoch_frontier | 2025 | Open weights | country | 1 | 1 | 1 | 1 | 1 | 1 | 10000 |
| epoch_frontier | 2025 | Closed weights | organization | 6 | 6 | 3 | 1 | 1 | 1 | 3888.889 |
| epoch_frontier | 2025 | Closed weights | country | 6 | 6 | 1 | 1 | 1 | 1 | 10000 |
| epoch_frontier | 2026 | Open weights | organization | 0 | 0 | 0 | — | — | — | — |
| epoch_frontier | 2026 | Open weights | country | 0 | 0 | 0 | — | — | — | — |
| epoch_frontier | 2026 | Closed weights | organization | 0 | 0 | 0 | — | — | — | — |
| epoch_frontier | 2026 | Closed weights | country | 0 | 0 | 0 | — | — | — | — |
| epoch_frontier | 2020-2026 | Open weights | organization | 7 | 7 | 5 | 0.714 | 1 | 1 | 2244.898 |
| epoch_frontier | 2020-2026 | Open weights | country | 7 | 7 | 2 | 1 | 1 | 1 | 7551.02 |
First 30 of 96 rows shown. The CSV contains all rows.
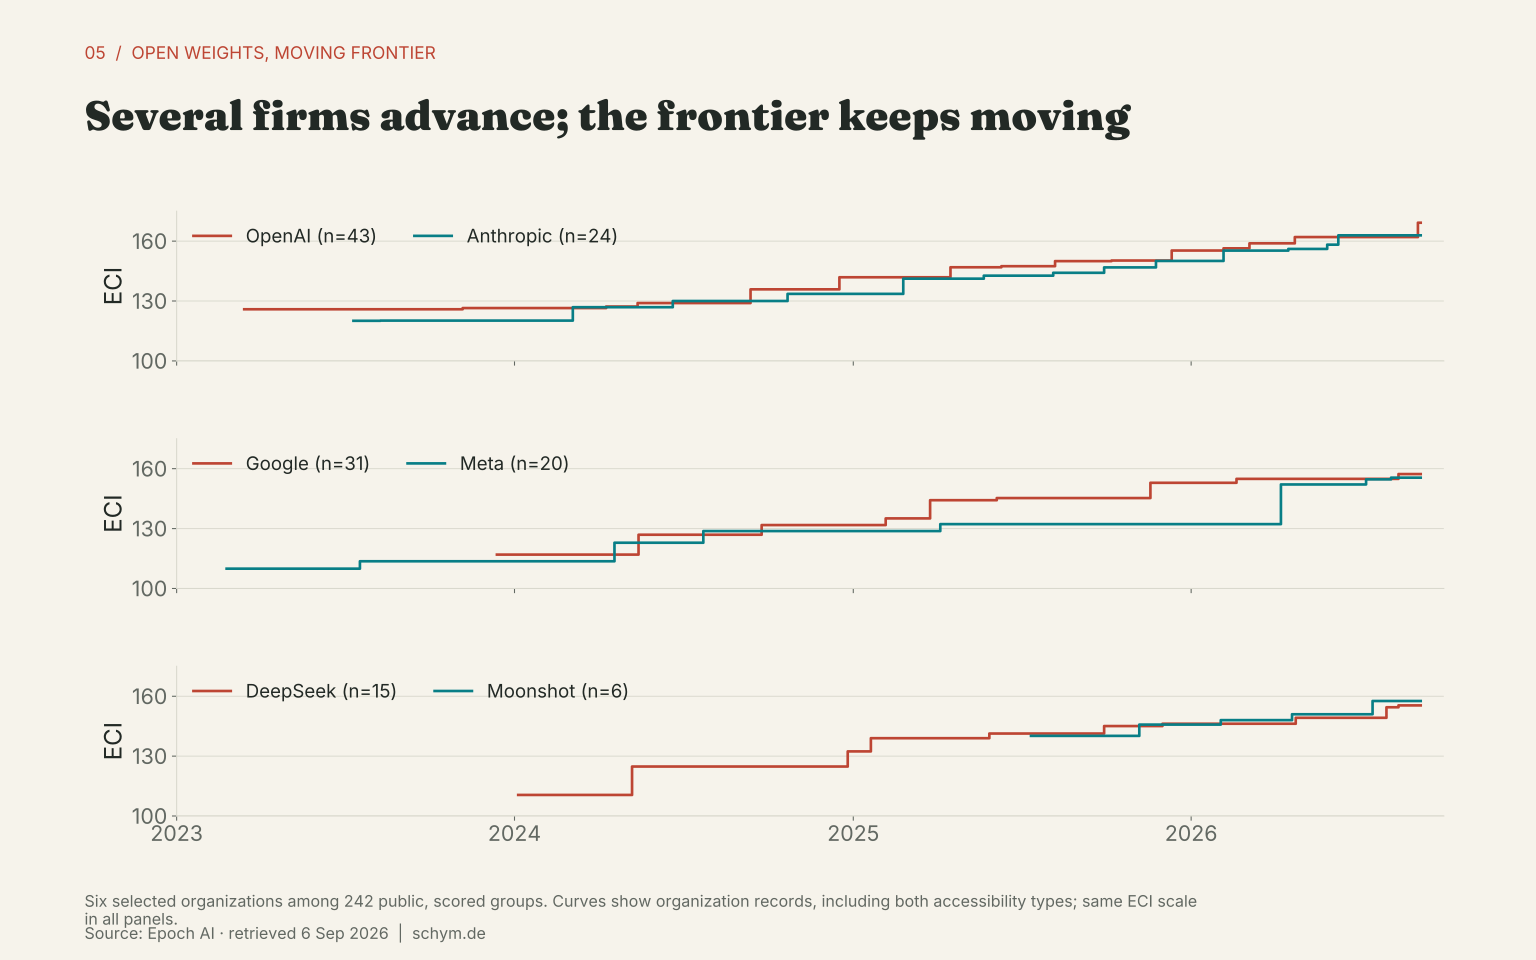
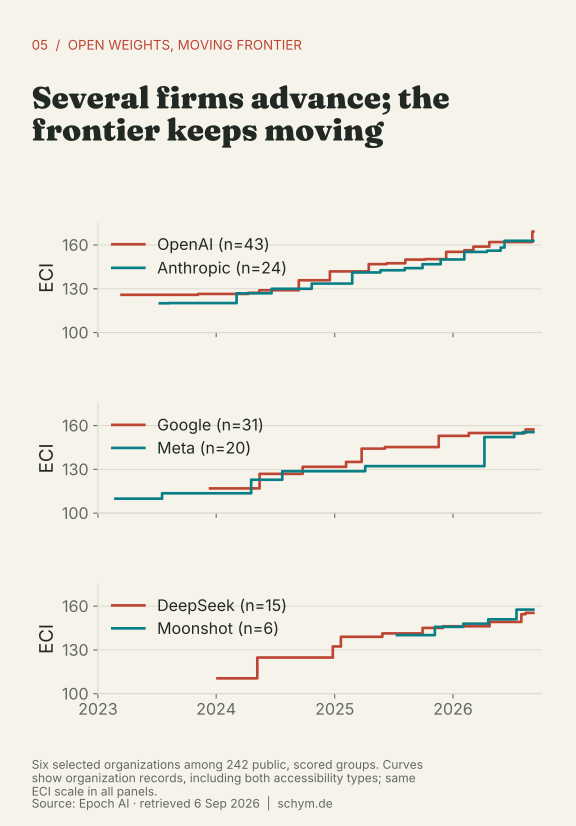
Download values as CSVWithin the five-point capability screen, the open release-credit shares are Meta 35.7%, DeepSeek 28.6%, Alibaba 21.4%, Moonshot 7.1% and Mistral AI 7.1%. OpenAI receives 50.0% of closed credits, Anthropic 26.8% and Google 16.1%. Organization HHI is 2,653 for open and 3,508 for closed groups on the 0–10,000 scale.
The country pattern is also asymmetric. China receives 57.1% of open credits, the United States 35.7% and France 7.1%. The United States receives 98.2% of closed credits in this selected capability sample; France receives the remainder. Country HHI is 4,592 and 9,649 respectively. These figures identify the recorded organization locations, not where all research, training or supply-chain inputs originated.
Using Epoch’s compute-oriented flag changes the pooled top-three organization shares to 71.4% for open and 59.5% for closed releases. A single concentration claim would hide that reversal. The open sample is particularly small, and the five-point rule admits no open entrant in 2026. Neither result establishes a continuous consolidation of the entire open-weight ecosystem.
The recurrent high-compute producers are broader. Among included open records with known compute of at least 10^24 FLOP, Alibaba appears seventeen times, DeepSeek fourteen, NVIDIA eleven and Meta eight. Variants and derivatives can enter these counts. They are not counts of independent from-scratch investments.
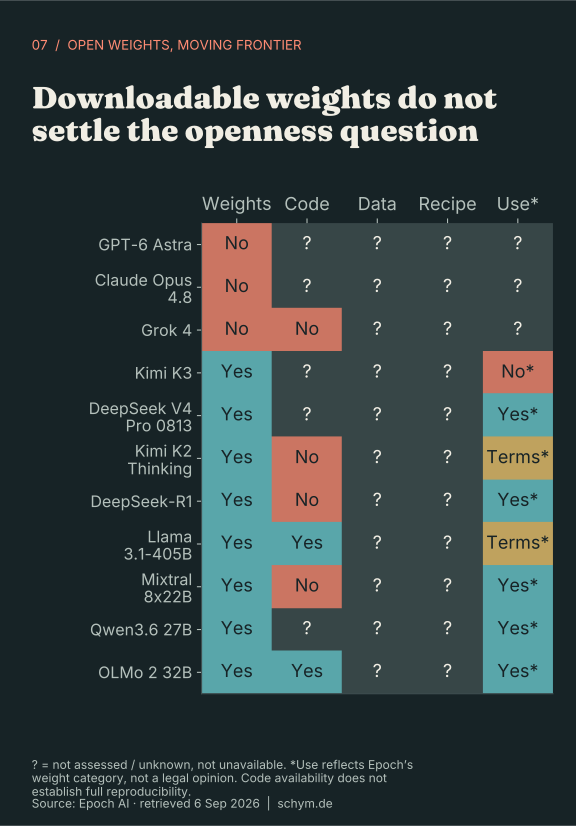
Openness has more than one column
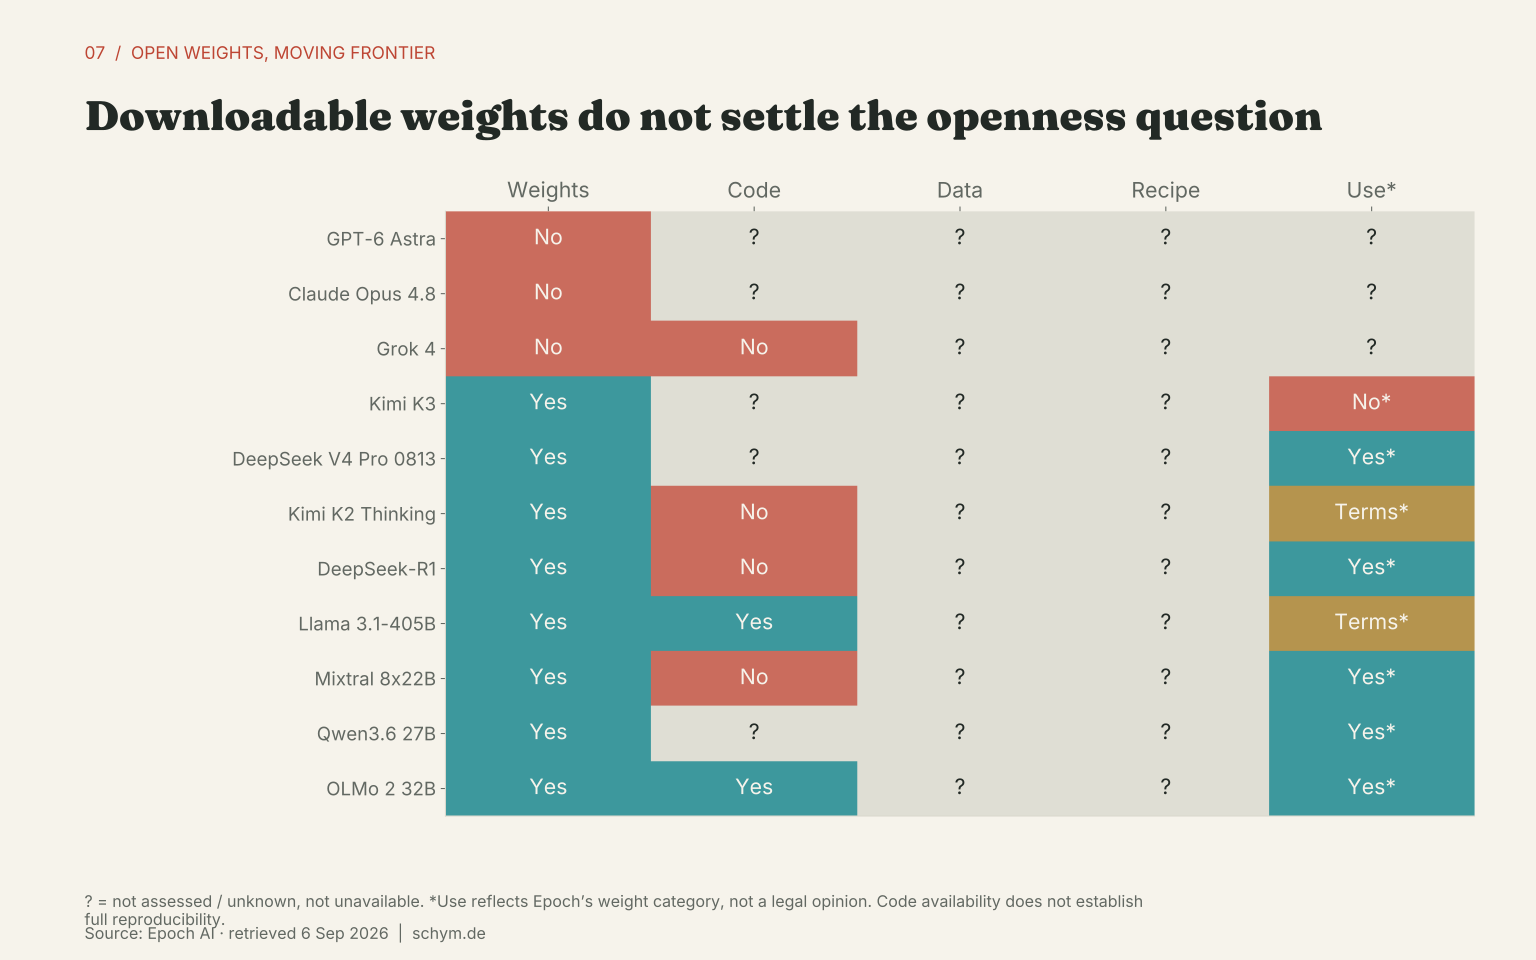
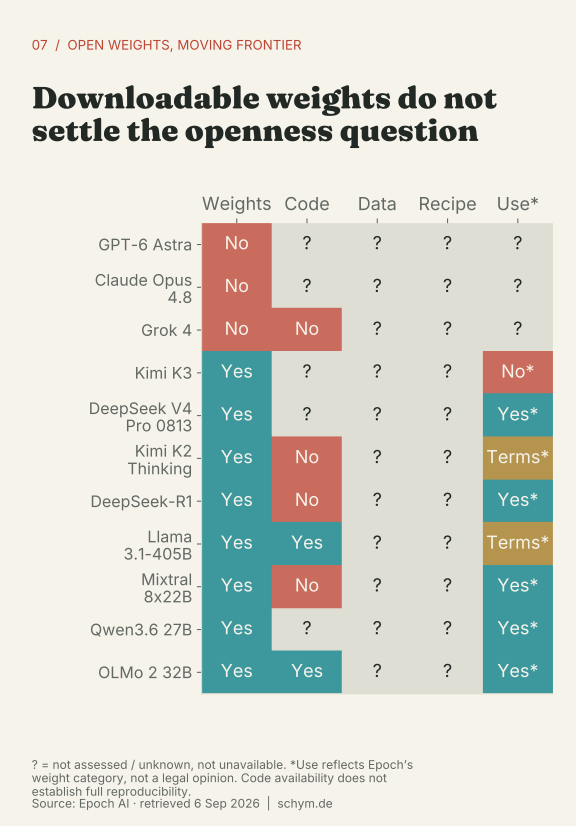
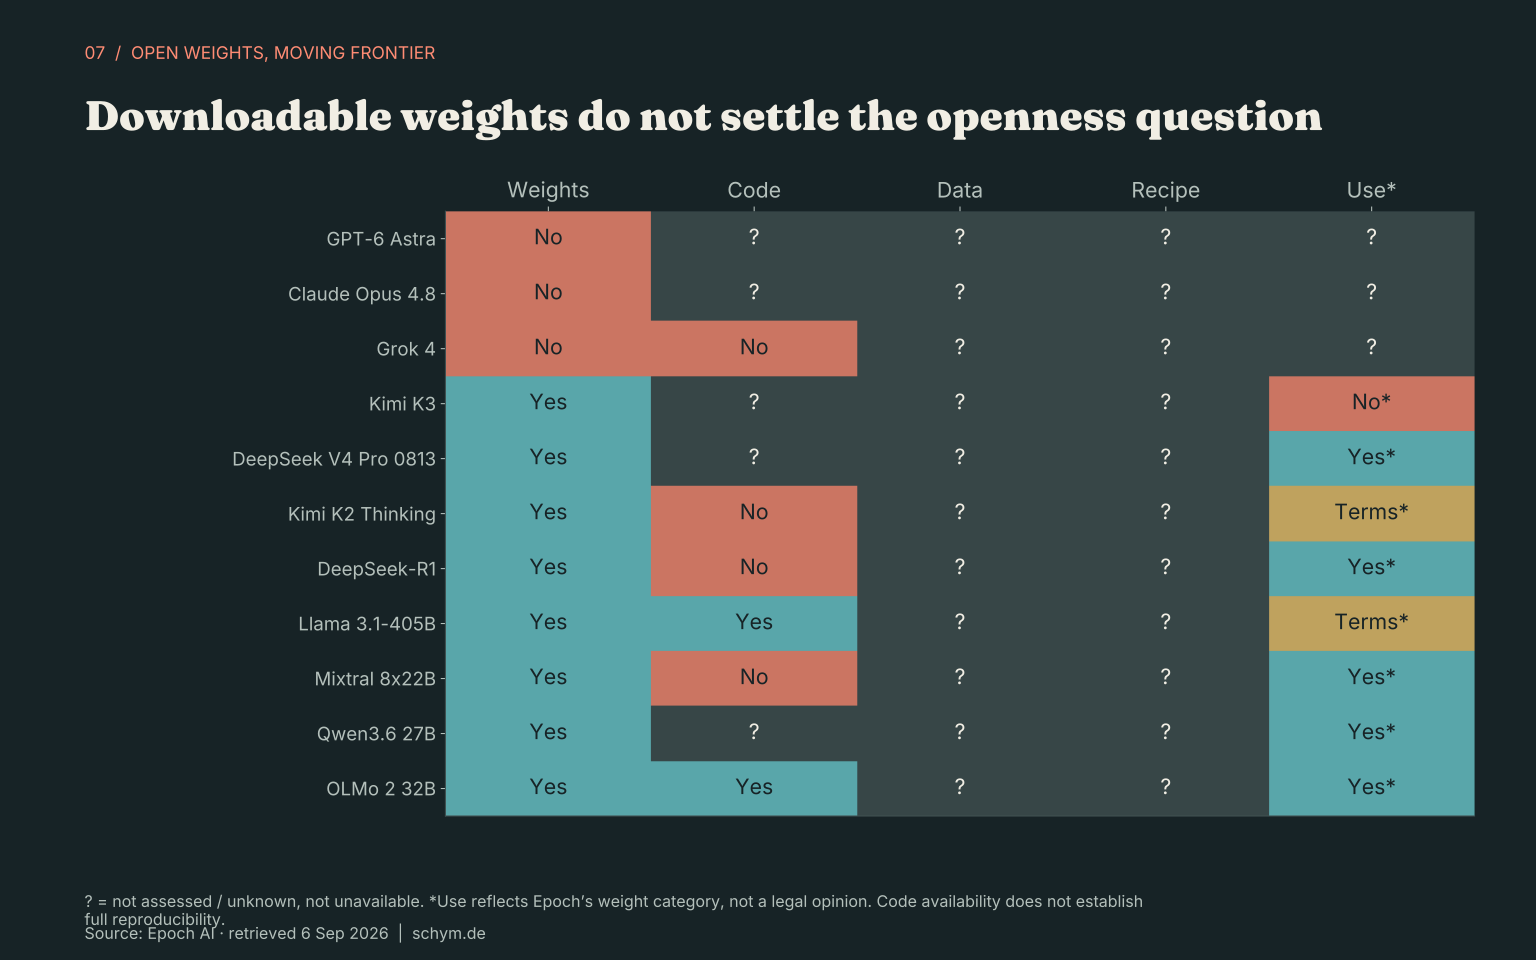
Exact values and sample counts
| model | weights | training_code | training_data | training_recipe | commercial |
|---|---|---|---|---|---|
| GPT-6 Astra | API access | — | Not assessed: no structured field in main CSV | Not assessed: no structured field in main CSV | ? |
| Claude Opus 4.8 | API access | — | Not assessed: no structured field in main CSV | Not assessed: no structured field in main CSV | ? |
| Grok 4 | API access | Unreleased | Not assessed: no structured field in main CSV | Not assessed: no structured field in main CSV | ? |
| Kimi K3 | Open weights (non-commercial) | — | Not assessed: no structured field in main CSV | Not assessed: no structured field in main CSV | No* |
| DeepSeek V4 Pro 0813 | Open weights (unrestricted) | — | Not assessed: no structured field in main CSV | Not assessed: no structured field in main CSV | Yes* |
| Kimi K2 Thinking | Open weights (restricted use) | Unreleased | Not assessed: no structured field in main CSV | Not assessed: no structured field in main CSV | Terms* |
| DeepSeek-R1 | Open weights (unrestricted) | Unreleased | Not assessed: no structured field in main CSV | Not assessed: no structured field in main CSV | Yes* |
| Llama 3.1-405B | Open weights (restricted use) | Open (restricted use) | Not assessed: no structured field in main CSV | Not assessed: no structured field in main CSV | Terms* |
| Mixtral 8x22B | Open weights (unrestricted) | Unreleased | Not assessed: no structured field in main CSV | Not assessed: no structured field in main CSV | Yes* |
| Qwen3.6 27B | Open weights (unrestricted) | — | Not assessed: no structured field in main CSV | Not assessed: no structured field in main CSV | Yes* |
| OLMo 2 32B | Open weights (unrestricted) | Open source | Not assessed: no structured field in main CSV | Not assessed: no structured field in main CSV | Yes* |
Epoch’s accessibility categories distinguish weights with unrestricted, restricted and non-commercial use. Its training-code field answers a different question. The main model CSV does not provide a structured census of training-data access, recipe disclosure or full reproducibility. A question mark in the matrix means the field was not assessed here, not that the producer withheld it. No external licensing research is silently mixed into the database.
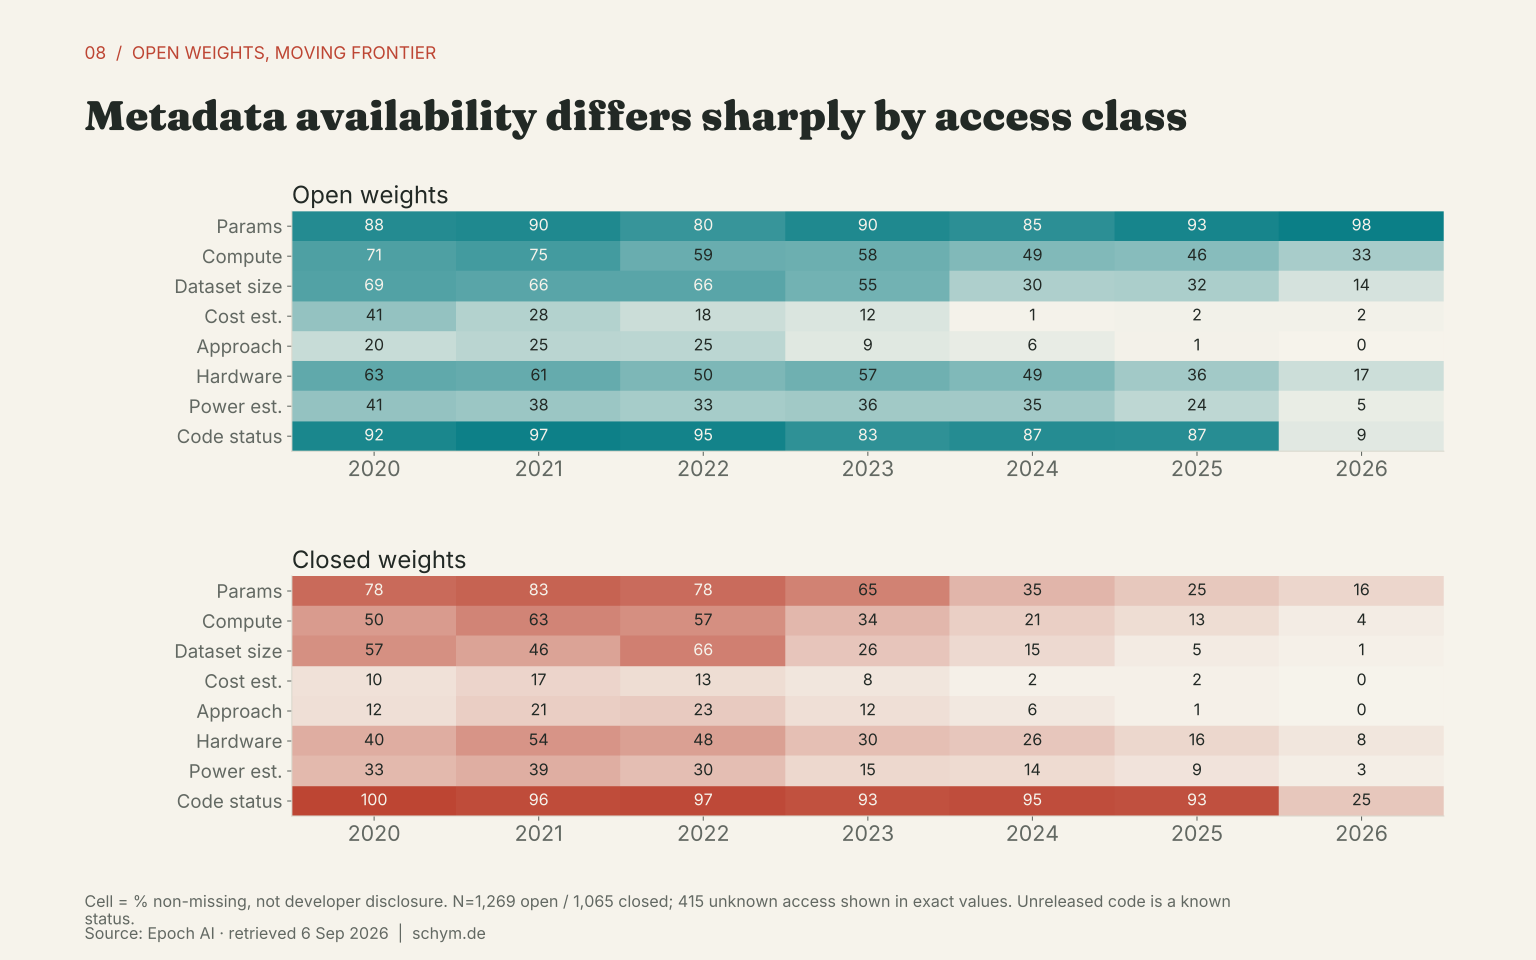
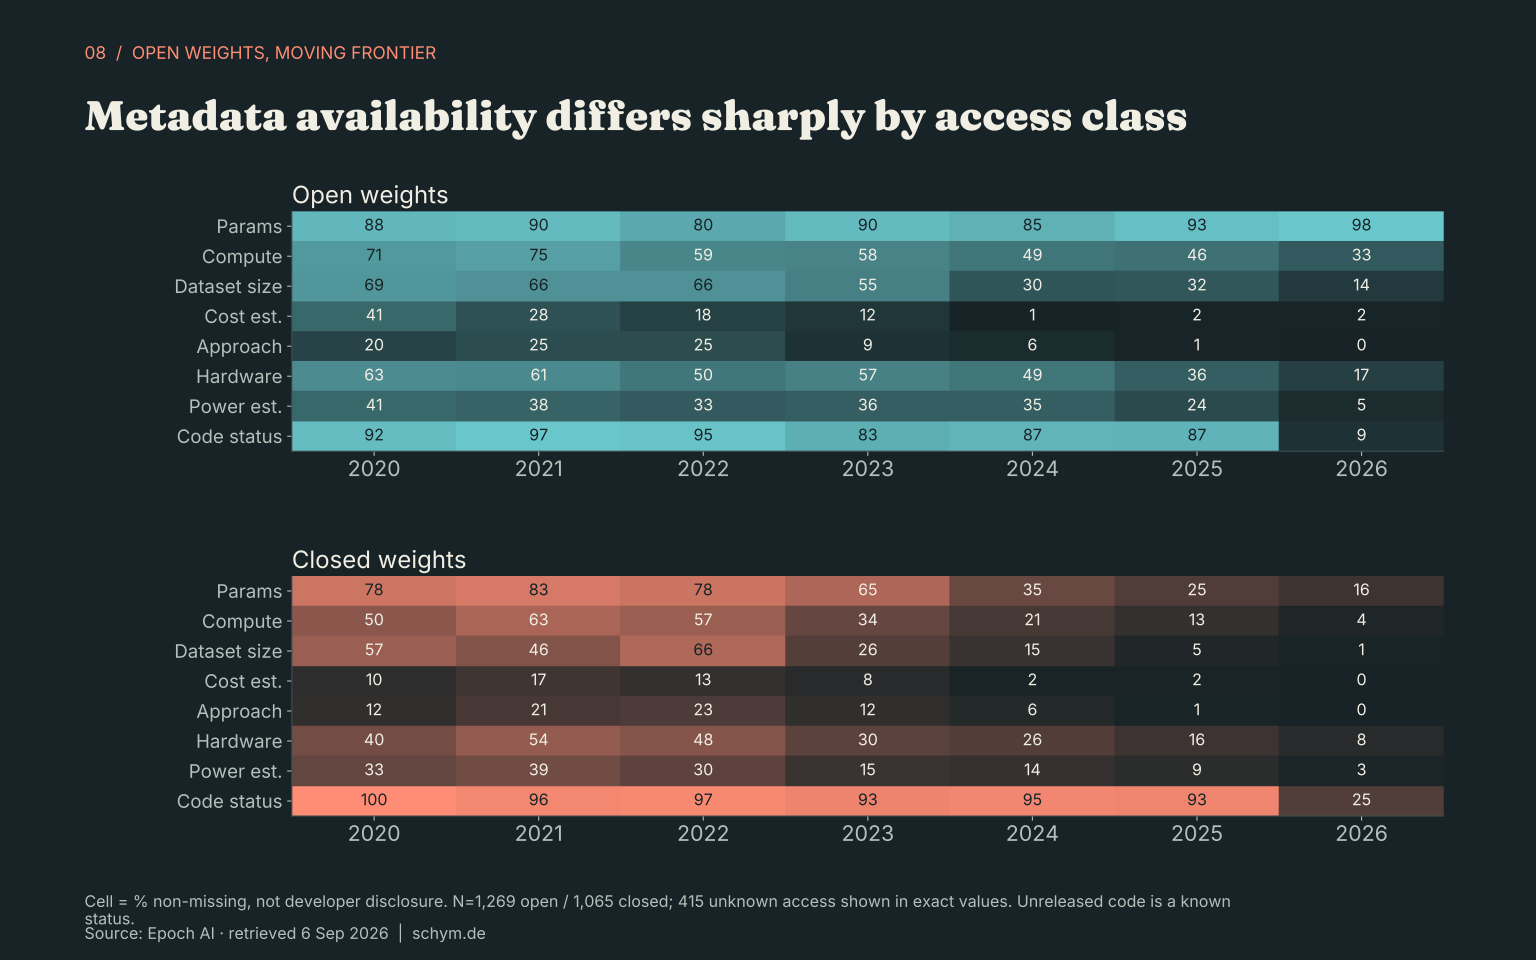
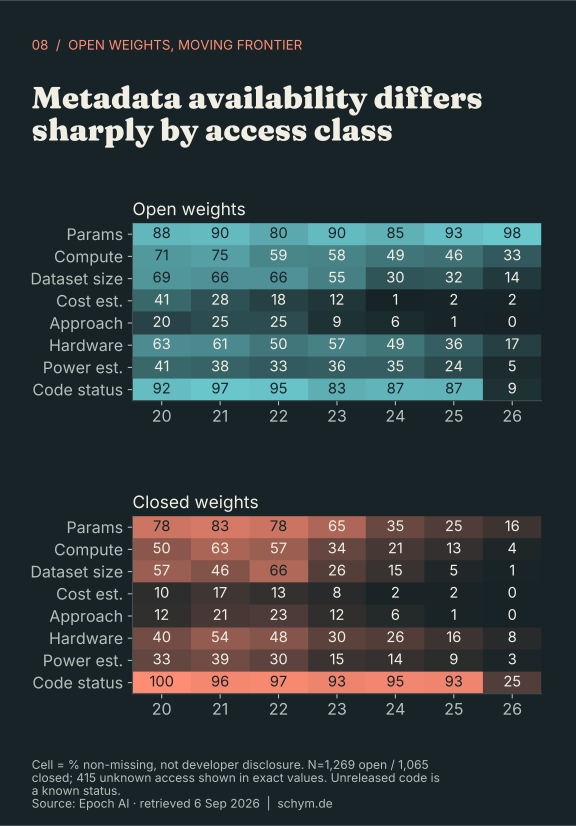
Exact values and sample counts
| year | access | field | n_models | n_available | n_missing | rate |
|---|---|---|---|---|---|---|
| 2020 | Open weights | Parameters | 51 | 45 | 6 | 0.882 |
| 2020 | Open weights | Training compute | 51 | 36 | 15 | 0.706 |
| 2020 | Open weights | Dataset size | 51 | 35 | 16 | 0.686 |
| 2020 | Open weights | Training cost estimate | 51 | 21 | 30 | 0.412 |
| 2020 | Open weights | Architecture / approach | 51 | 10 | 41 | 0.196 |
| 2020 | Open weights | Hardware | 51 | 32 | 19 | 0.627 |
| 2020 | Open weights | Power estimate | 51 | 21 | 30 | 0.412 |
| 2020 | Open weights | Training code status | 51 | 47 | 4 | 0.922 |
| 2020 | Open weights | Reported compute only | 51 | 1 | 50 | 0.02 |
| 2020 | Open weights | Training code available | 51 | 31 | 20 | 0.608 |
| 2020 | Closed weights | Parameters | 60 | 47 | 13 | 0.783 |
| 2020 | Closed weights | Training compute | 60 | 30 | 30 | 0.5 |
| 2020 | Closed weights | Dataset size | 60 | 34 | 26 | 0.567 |
| 2020 | Closed weights | Training cost estimate | 60 | 6 | 54 | 0.1 |
| 2020 | Closed weights | Architecture / approach | 60 | 7 | 53 | 0.117 |
| 2020 | Closed weights | Hardware | 60 | 24 | 36 | 0.4 |
| 2020 | Closed weights | Power estimate | 60 | 20 | 40 | 0.333 |
| 2020 | Closed weights | Training code status | 60 | 60 | 0 | 1 |
| 2020 | Closed weights | Reported compute only | 60 | 2 | 58 | 0.033 |
| 2020 | Closed weights | Training code available | 60 | 15 | 45 | 0.25 |
| 2020 | Unknown | Parameters | 15 | 10 | 5 | 0.667 |
| 2020 | Unknown | Training compute | 15 | 11 | 4 | 0.733 |
| 2020 | Unknown | Dataset size | 15 | 9 | 6 | 0.6 |
| 2020 | Unknown | Training cost estimate | 15 | 0 | 15 | 0 |
| 2020 | Unknown | Architecture / approach | 15 | 1 | 14 | 0.067 |
| 2020 | Unknown | Hardware | 15 | 9 | 6 | 0.6 |
| 2020 | Unknown | Power estimate | 15 | 2 | 13 | 0.133 |
| 2020 | Unknown | Training code status | 15 | 0 | 15 | 0 |
| 2020 | Unknown | Reported compute only | 15 | 7 | 8 | 0.467 |
| 2020 | Unknown | Training code available | 15 | 0 | 15 | 0 |
First 30 of 240 rows shown. The CSV contains all rows.
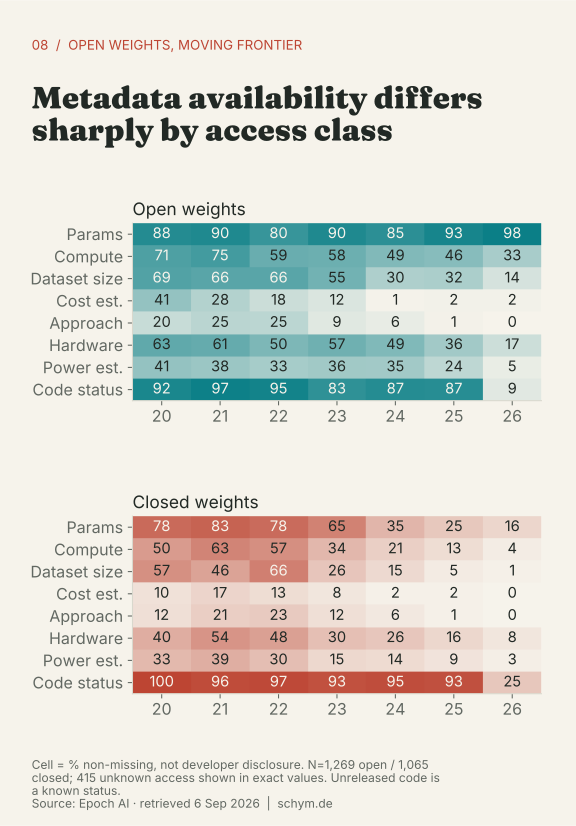
Download values as CSVCompute is populated for 52.7% of open records and 29.8% of closed records. Dataset size is populated for 41.8% and 24.1%. Cost estimates appear for only 8.1% and 5.8%. The equal-weight metadata score averages 45.35 out of 100 for open models and 31.64 for closed models. Because estimates and known negative statuses count as available metadata, the field-by-field rates are more informative than calling this a general transparency ranking.
The cost question remains open
Exact values and sample counts
| Model | date | Organization | access | epoch_frontier | compute | cost |
|---|---|---|---|---|---|---|
| A.X K2 | 2026-07-29 | SK Telecom | Open weights | False | 1.8e+24 | 1.24e+07 |
| A.X K1 | 2025-12-30 | SK Telecom | Open weights | False | — | 9.64e+06 |
| Grok 4 | 2025-07-09 | xAI | Closed weights | True | 5e+26 | 3.88e+08 |
| DeepSeek-R1 (May 2025) | 2025-05-28 | DeepSeek | Open weights | False | 4.02e+24 | 6.77e+06 |
| Trillion-7B | 2025-04-21 | Trillion Labs | Open weights | False | 9.3e+22 | 1.39e+05 |
| Llama 4 Behemoth (preview) | 2025-04-05 | Meta AI | Closed weights | True | 5.18e+25 | 4.46e+07 |
| DeepSeek-V3 (Mar 2025) | 2025-03-24 | DeepSeek | Open weights | False | 3.3e+24 | 5.39e+06 |
| GPT-4.5 | 2025-02-27 | OpenAI | Closed weights | True | 3.8e+26 | 3.66e+08 |
| Grok 3 | 2025-02-17 | xAI | Closed weights | True | 3.5e+26 | 2.18e+08 |
| DeepSeek-R1 | 2025-01-20 | DeepSeek | Open weights | False | 3.5e+24 | 6.77e+06 |
| DeepSeek-V3 | 2024-12-24 | DeepSeek | Open weights | False | 3.3e+24 | 5.39e+06 |
| Grok-2 | 2024-08-13 | xAI | Closed weights | True | 2.96e+25 | 3.16e+07 |
| Llama 3.1-405B | 2024-07-23 | Meta AI | Open weights | True | 3.8e+25 | 5.29e+07 |
| Claude 3.5 Sonnet | 2024-06-20 | Anthropic | Closed weights | True | 2.7e+25 | 2.59e+07 |
| Nemotron-4 340B | 2024-06-14 | NVIDIA | Open weights | True | 1.8e+25 | 2.13e+07 |
| Arctic | 2024-04-24 | Snowflake | Open weights | False | 3.83e+23 | 2e+06 |
| Inflection-2.5 | 2024-03-07 | Inflection AI | Closed weights | False | 8e+24 | 1.18e+07 |
| Mistral Large | 2024-02-26 | Mistral AI | Closed weights | False | — | 1.41e+07 |
| MegaScale (Production) | 2024-02-23 | ByteDance,Peking University | Closed weights | False | 3.9e+24 | 2.61e+06 |
| Gemini 1.0 Ultra | 2023-12-06 | Google DeepMind | Closed weights | True | 5e+25 | 3.07e+07 |
| Inflection-2 | 2023-11-22 | Inflection AI | Closed weights | True | 1e+25 | 1.35e+07 |
| Nemotron-3-8B | 2023-11-15 | NVIDIA | Open weights | False | 1.8e+23 | 2.14e+05 |
| SPHINX (Llama 2 13B) | 2023-11-13 | Shanghai AI Lab,Chinese University of Hong Kong (CUHK),ShanghaiTech University | Open weights | False | 3.04e+22 | 2.39e+05 |
| MultiBand Diffusion | 2023-11-08 | Meta AI,Hebrew University of Jerusalem,LORIA | Open weights | False | 2.6e+19 | 22.81 |
| CODEFUSION (Python) | 2023-10-26 | Microsoft,Microsoft Research | Closed weights | False | 7.92e+18 | 8.542 |
| Amazon Titan | 2023-09-28 | Amazon | Closed weights | True | 4.8e+24 | 7.93e+06 |
| Falcon-180B | 2023-09-06 | Technology Innovation Institute | Open weights | True | 3.76e+24 | 1.07e+07 |
| Llama 2-70B | 2023-07-18 | Meta AI | Open weights | False | 8.1e+23 | 1.1e+06 |
| Llama 2-34B | 2023-07-18 | Meta AI | Closed weights | False | 4.08e+23 | 6e+05 |
| Llama 2-7B | 2023-07-18 | Meta AI | Open weights | False | 8.4e+22 | 1.14e+05 |
First 30 of 165 rows shown. The CSV contains all rows.
Download values as CSVAmong flagged frontier records, training-cost estimates exist for six of seven open releases and 25 of 42 closed releases. Their pooled medians are $5.46 million and $4.90 million respectively, across different years and capability targets; this is not a matched cost comparison.
Releasing weights does not remove the capital required to train a competitive model. Llama 3.1-405B is a clear example of an open release with a large estimated training budget. But the surviving cost points do not form a comparable time series of the cost of reaching a constant capability threshold. Model design, training efficiency, post-training and capability targets all change. The database supports the existence of a substantial capital requirement for particular releases; it cannot establish that every subsequent open frontier becomes more expensive.
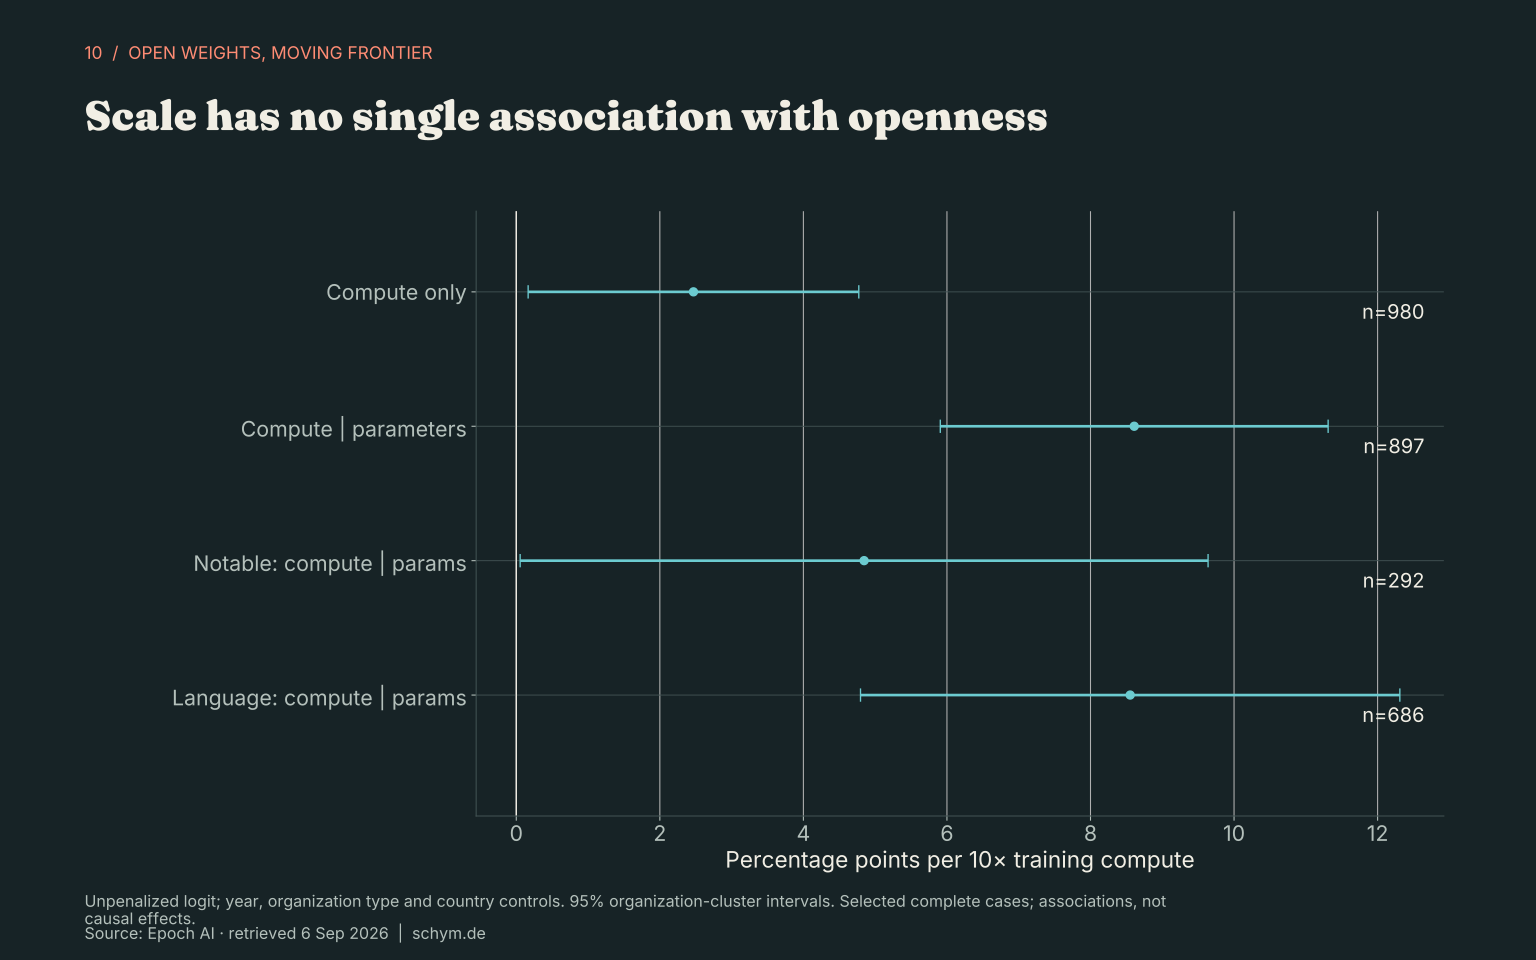
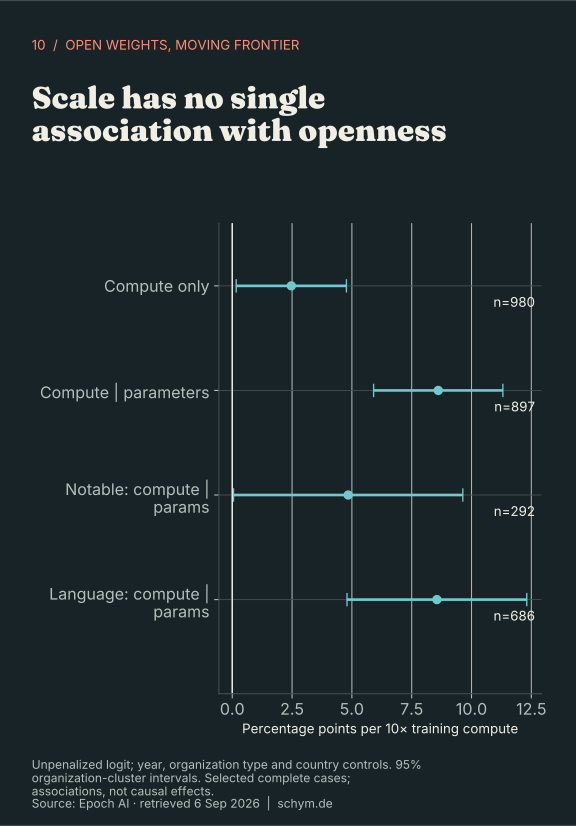
Exact values and sample counts
| scope | spec | term | coefficient | se_cluster | ci_low | ci_high | odds_ratio | ame | ame_low | ame_high | n | clusters |
|---|---|---|---|---|---|---|---|---|---|---|---|---|
| all | compute | Intercept | 0.529 | 0.4 | -0.254 | 1.313 | 1.697 | — | — | — | 980 | 404 |
| all | compute | log10_compute | 0.127 | 0.063 | 0.004 | 0.251 | 1.136 | 0.025 | 0.002 | 0.048 | 980 | 404 |
| all | compute | year_since_2020 | 0.35 | 0.083 | 0.188 | 0.512 | 1.419 | 0.068 | 0.038 | 0.098 | 980 | 404 |
| all | compute | organization_type_Industry only | -0.742 | 0.34 | -1.409 | -0.075 | 0.476 | -0.139 | -0.26 | -0.019 | 980 | 404 |
| all | compute | organization_type_Mixed / other | 0.356 | 0.304 | -0.239 | 0.952 | 1.428 | 0.068 | -0.042 | 0.178 | 980 | 404 |
| all | compute | country_group_Other / multinational | -0.622 | 0.348 | -1.304 | 0.06 | 0.537 | -0.122 | -0.253 | 0.009 | 980 | 404 |
| all | compute | country_group_USA | -0.508 | 0.329 | -1.153 | 0.136 | 0.601 | -0.1 | -0.225 | 0.026 | 980 | 404 |
| all | parameters | Intercept | -0.189 | 0.307 | -0.791 | 0.413 | 0.828 | — | — | — | 1611 | 556 |
| all | parameters | log10_parameters | -0.029 | 0.075 | -0.176 | 0.118 | 0.971 | -0.006 | -0.034 | 0.023 | 1611 | 556 |
| all | parameters | year_since_2020 | 0.435 | 0.074 | 0.289 | 0.581 | 1.546 | 0.085 | 0.059 | 0.111 | 1611 | 556 |
| all | parameters | organization_type_Industry only | -0.336 | 0.313 | -0.948 | 0.277 | 0.715 | -0.065 | -0.182 | 0.053 | 1611 | 556 |
| all | parameters | organization_type_Mixed / other | 0.261 | 0.252 | -0.232 | 0.755 | 1.299 | 0.05 | -0.042 | 0.142 | 1611 | 556 |
| all | parameters | country_group_Other / multinational | -0.37 | 0.297 | -0.953 | 0.212 | 0.69 | -0.073 | -0.188 | 0.041 | 1611 | 556 |
| all | parameters | country_group_USA | -0.371 | 0.307 | -0.973 | 0.232 | 0.69 | -0.074 | -0.193 | 0.046 | 1611 | 556 |
| all | joint | Intercept | 0.702 | 0.432 | -0.145 | 1.549 | 2.018 | — | — | — | 897 | 364 |
| all | joint | log10_compute | 0.482 | 0.086 | 0.313 | 0.65 | 1.619 | 0.086 | 0.059 | 0.113 | 897 | 364 |
| all | joint | log10_parameters | -0.602 | 0.146 | -0.888 | -0.317 | 0.547 | -0.108 | -0.157 | -0.059 | 897 | 364 |
| all | joint | year_since_2020 | 0.37 | 0.09 | 0.195 | 0.546 | 1.448 | 0.066 | 0.036 | 0.097 | 897 | 364 |
| all | joint | organization_type_Industry only | -0.814 | 0.389 | -1.576 | -0.052 | 0.443 | -0.14 | -0.265 | -0.014 | 897 | 364 |
| all | joint | organization_type_Mixed / other | 0.28 | 0.331 | -0.369 | 0.929 | 1.323 | 0.049 | -0.062 | 0.161 | 897 | 364 |
| all | joint | country_group_Other / multinational | -0.811 | 0.372 | -1.54 | -0.081 | 0.445 | -0.149 | -0.28 | -0.018 | 897 | 364 |
| all | joint | country_group_USA | -0.55 | 0.352 | -1.24 | 0.139 | 0.577 | -0.1 | -0.223 | 0.024 | 897 | 364 |
| notable | compute | Intercept | 1.364 | 0.691 | 0.009 | 2.719 | 3.913 | — | — | — | 323 | 158 |
| notable | compute | log10_compute | -0.116 | 0.103 | -0.318 | 0.086 | 0.89 | -0.024 | -0.066 | 0.017 | 323 | 158 |
| notable | compute | year_since_2020 | 0.311 | 0.106 | 0.103 | 0.519 | 1.365 | 0.065 | 0.025 | 0.104 | 323 | 158 |
| notable | compute | organization_type_Industry only | -1.335 | 0.647 | -2.604 | -0.067 | 0.263 | -0.273 | -0.51 | -0.036 | 323 | 158 |
| notable | compute | organization_type_Mixed / other | -0.335 | 0.562 | -1.436 | 0.767 | 0.716 | -0.069 | -0.291 | 0.154 | 323 | 158 |
| notable | compute | country_group_Other / multinational | -0.831 | 0.588 | -1.983 | 0.321 | 0.436 | -0.166 | -0.371 | 0.039 | 323 | 158 |
| notable | compute | country_group_USA | -1.072 | 0.45 | -1.955 | -0.19 | 0.342 | -0.231 | -0.408 | -0.053 | 323 | 158 |
| notable | parameters | Intercept | 0.736 | 0.558 | -0.359 | 1.83 | 2.087 | — | — | — | 422 | 192 |
First 30 of 66 rows shown. The CSV contains all rows.
Download values as CSVThe joint logistic regression uses 897 complete records and excludes 1,852 with missing required fields. It includes publication year, organization type and country, with uncertainty clustered across 364 organization groups. Holding parameter count fixed, compute has a positive association with open weights; holding compute fixed, parameters have a negative association. Compute-only and Language-restricted specifications are provided separately. Conditioning on scale, selection into disclosure and correlated covariates changes the question. The coefficients are not estimates of what would happen if a producer increased its compute budget.
A diffusion clock has a stopping point
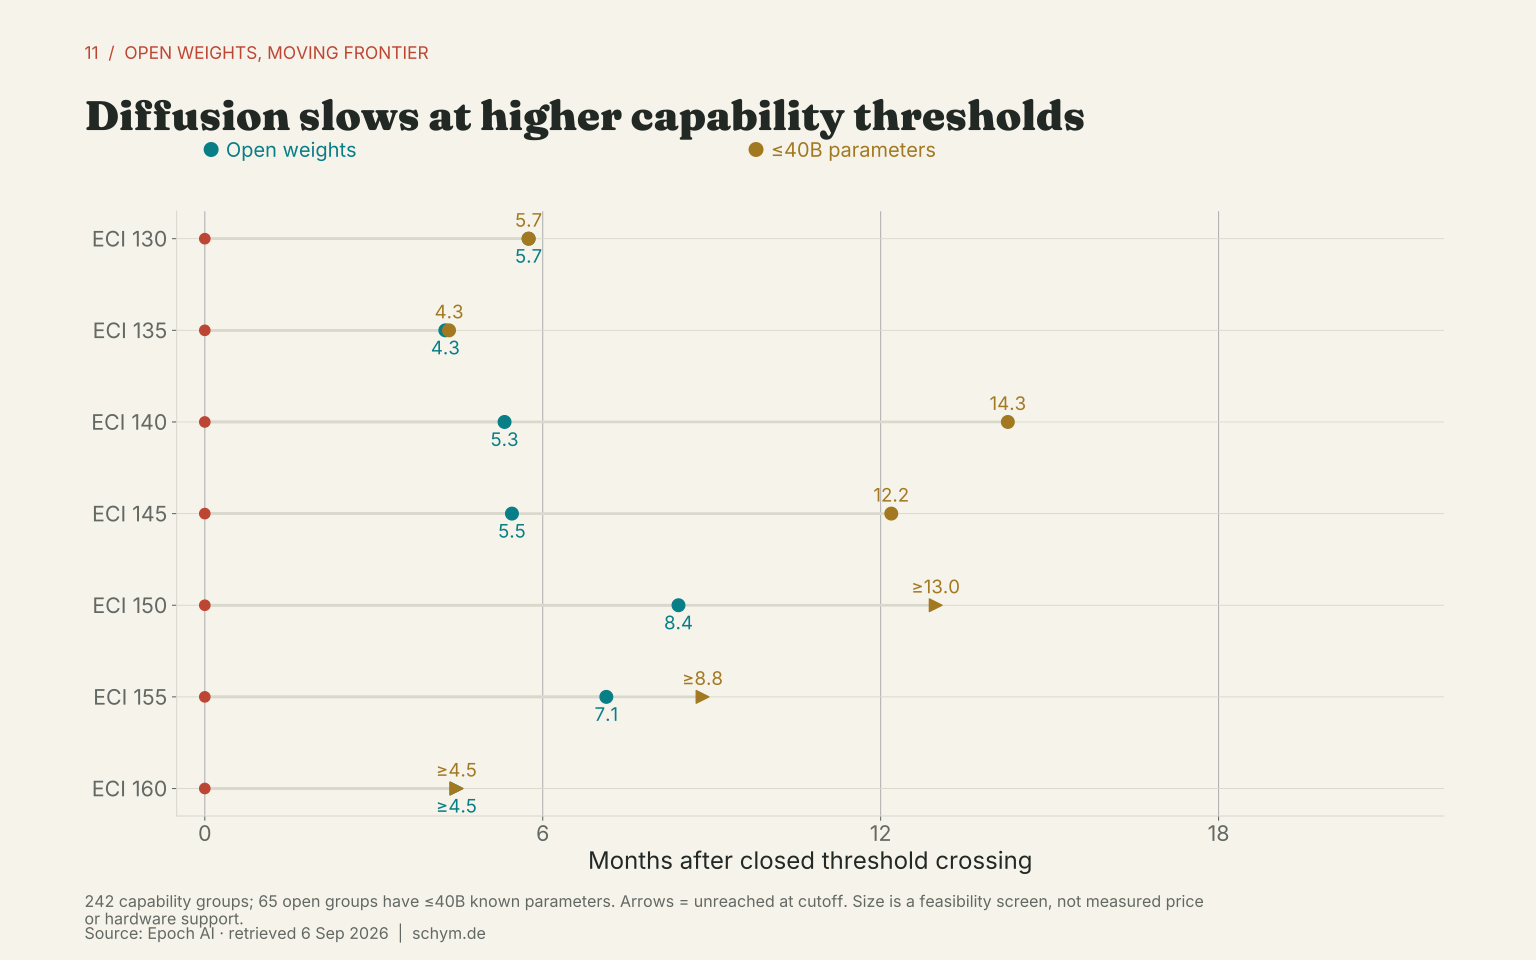
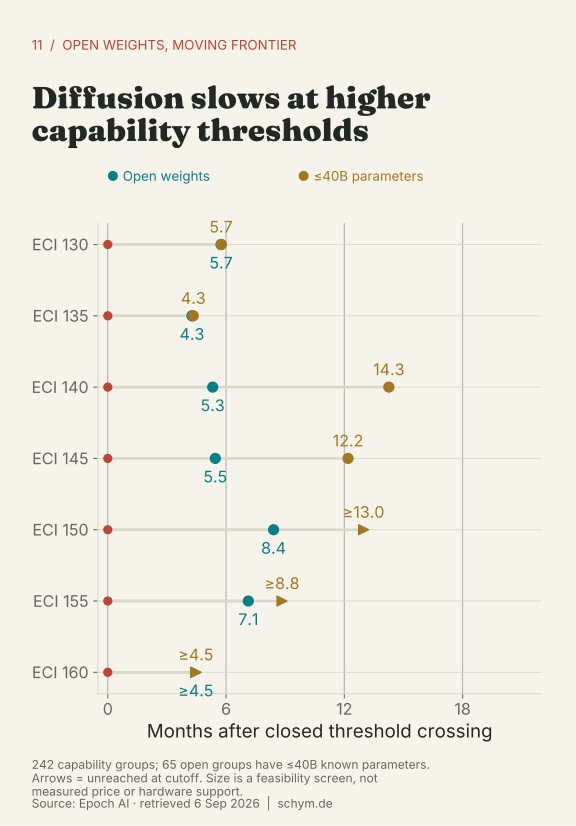
Exact values and sample counts
| threshold | closed_date | closed_model | closed_score | open_date | open_model | open_score | small_date | small_model | small_score | unrestricted_date | unrestricted_model | unrestricted_score | open_months_from_closed | small_months_from_closed | unrestricted_months_from_closed | small_months_after_open | small_censored | open_censored | unrestricted_censored | closed_crossing_left_censored |
|---|---|---|---|---|---|---|---|---|---|---|---|---|---|---|---|---|---|---|---|---|
| 120 | 2023-03-15 | GPT-4 (Mar 2023) | 125.88 | 2024-04-17 | Mixtral 8x22B | 121.98 | 2024-04-23 | phi-3-small 7.4B | 121.79 | 2024-04-17 | Mixtral 8x22B | 121.98 | 13.109 | 13.306 | 13.109 | 0.197 | — | — | — | True |
| 125 | 2023-03-15 | GPT-4 (Mar 2023) | 125.88 | 2024-06-07 | Qwen2-72B | 125.26 | 2024-09-17 | Qwen2.5-32B | 128.53 | 2024-06-07 | Qwen2-72B | 125.26 | 14.784 | 18.136 | 14.784 | 3.351 | — | — | — | True |
| 130 | 2024-06-20 | Claude 3.5 Sonnet | 130 | 2024-12-12 | Phi-4 | 130.43 | 2024-12-12 | Phi-4 | 130.43 | 2024-12-12 | Phi-4 | 130.43 | 5.749 | 5.749 | 5.749 | 0 | — | — | — | False |
| 135 | 2024-09-12 | o1-mini | 135.84 | 2025-01-20 | DeepSeek-R1 | 138.99 | 2025-01-22 | DeepSeek-R1-Distill-Qwen-32B | 137.44 | 2025-01-20 | DeepSeek-R1 | 138.99 | 4.271 | 4.337 | 4.271 | 0.066 | — | — | — | False |
| 140 | 2024-12-17 | o1 | 141.9 | 2025-05-28 | DeepSeek-R1 (May 2025) | 141.32 | 2026-02-24 | Qwen3.5-35B-A3B | 142.54 | 2025-05-28 | DeepSeek-R1 (May 2025) | 141.32 | 5.322 | 14.259 | 5.322 | 8.936 | — | — | — | False |
| 145 | 2025-04-16 | o3 | 146.91 | 2025-09-29 | DeepSeek-V3.2-Exp | 145.06 | 2026-04-22 | Qwen3.6 27B | 146.46 | 2025-09-29 | DeepSeek-V3.2-Exp | 145.06 | 5.454 | 12.189 | 5.454 | 6.735 | — | — | — | False |
| 150 | 2025-08-07 | GPT-5 | 150 | 2026-04-20 | Kimi K2.6 | 150.98 | — | — | — | 2026-04-20 | Kimi K2.6 | 150.98 | 8.411 | 12.977 | 8.411 | — | True | — | — | False |
| 155 | 2025-12-11 | GPT-5.2 Pro | 155.3 | 2026-07-16 | Kimi K3 | 157.62 | — | — | — | 2026-08-13 | DeepSeek V4 Pro 0813 | 155.42 | 7.129 | 8.838 | 8.049 | — | True | — | — | False |
| 160 | 2026-04-23 | GPT-5.5 Pro | 162.03 | — | — | — | — | — | — | — | — | — | 4.468 | 4.468 | 4.468 | — | True | True | True | False |
| 165 | 2026-09-03 | GPT-6 Astra | 169.23 | — | — | — | — | — | — | — | — | — | 0.099 | 0.099 | 0.099 | — | True | True | True | False |
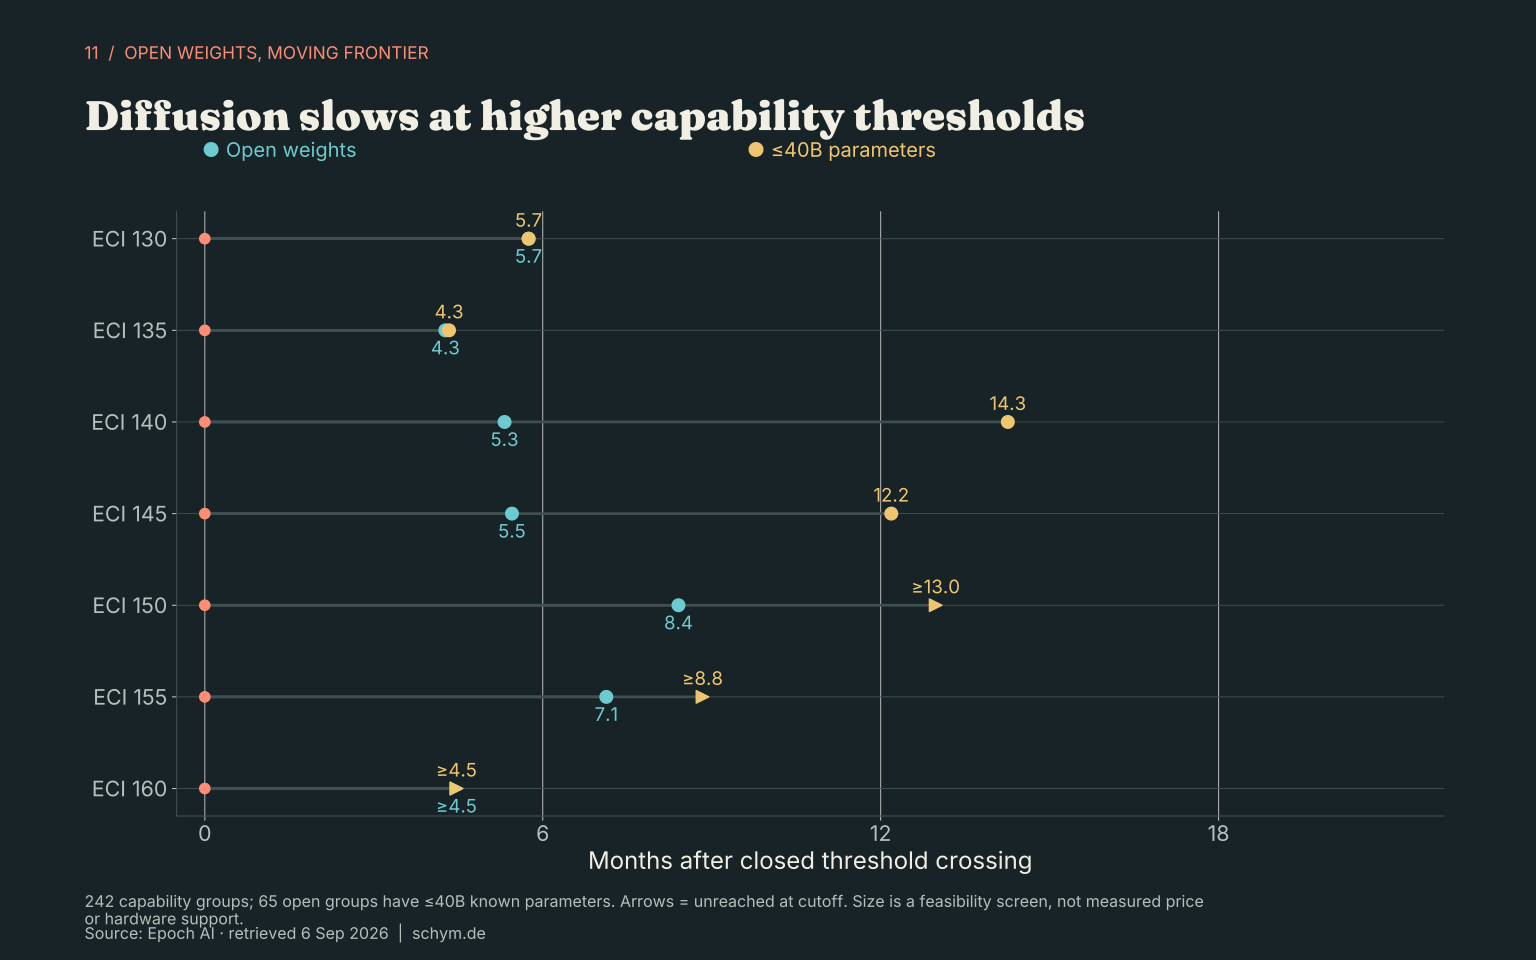
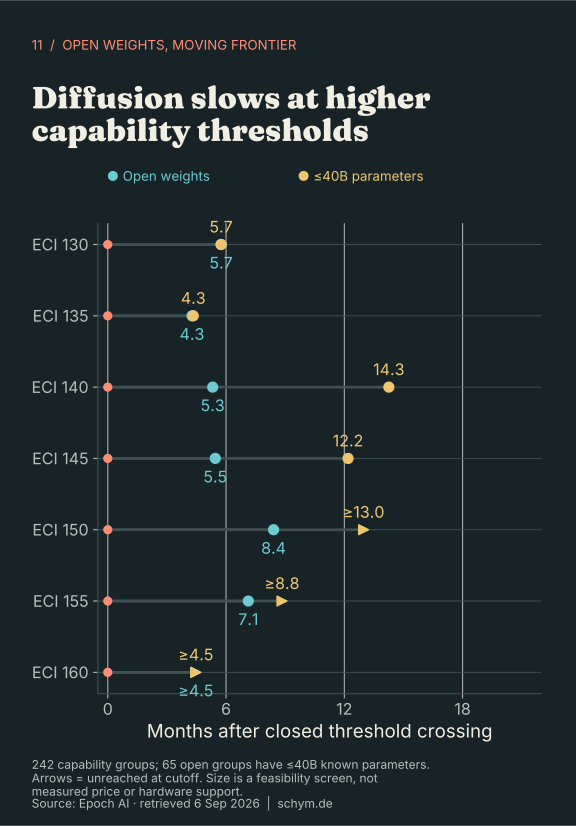
The first open crossings of ECI 130–145 arrived about 4.3–5.7 months after the corresponding closed crossings. The ECI-150 threshold took 8.4 months; ECI 155 took 7.1 months. These higher thresholds therefore did not diffuse faster in the observed record. ECI 160 remains unreached by an open group at the cutoff and is shown as a censored wait.
A second stage asks when an open model with no more than forty billion total parameters crossed the same threshold. ECI 140 took about 14.3 months from the closed crossing; ECI 145 took 12.2 months. The smaller-model stage has not crossed ECI 150. This is a bounded size comparison, not a claim that every qualifying model runs well on a consumer GPU or is economically cheaper for a particular workload.
Exact values and sample counts
| group | date | year | access | eci | distance_at_release |
|---|---|---|---|---|---|
| Claude Fable 5.1 | 2026-09-01 | 2026 | Closed weights | 162.88 | 0.02 |
| GPT-4o mini | 2024-07-18 | 2024 | Closed weights | 126.56 | 3.44 |
| GPT-4o (Aug 2024) | 2024-08-06 | 2024 | Closed weights | 128.78 | 1.22 |
| GPT-4.1 nano | 2025-04-14 | 2025 | Closed weights | 129.63 | 14.57 |
| GPT-4.1 mini | 2025-04-14 | 2025 | Closed weights | 135.03 | 9.17 |
| GPT-4.1 | 2025-04-14 | 2025 | Closed weights | 136.82 | 7.38 |
| o3-mini | 2025-01-31 | 2025 | Closed weights | 140.38 | 1.52 |
| o1 | 2024-12-17 | 2024 | Closed weights | 141.9 | 0 |
| Muse Spark 1.1 | 2026-07-09 | 2026 | Closed weights | 154.65 | 8.25 |
| Claude 3 Opus | 2024-03-04 | 2024 | Closed weights | 126.9 | 0 |
| GLM-5.3 | 2026-08-14 | 2026 | Closed weights | 155.3 | 7.6 |
| Qwen3.5-35B-A3B | 2026-02-24 | 2026 | Open weights | 142.54 | 13.86 |
| Qwen3-32B | 2025-04-29 | 2025 | Open weights | 138.53 | 8.38 |
| Qwen3-30B-A3B-Thinking (Jul 2025) | 2025-07-30 | 2025 | Open weights | 139.66 | 7.8 |
| Qwen3-30B-A3B-Instruct (Jul 2025) | 2025-07-29 | 2025 | Open weights | 137.44 | 10.02 |
| Qwen3-30B-A3B | 2025-04-29 | 2025 | Open weights | 136.2 | 10.71 |
| Qwen3-14B | 2025-04-29 | 2025 | Open weights | 138.26 | 8.65 |
| Qwen2.5-7B | 2024-09-19 | 2024 | Open weights | 118.44 | 17.4 |
| Qwen2.5-32B | 2024-09-17 | 2024 | Open weights | 128.53 | 7.31 |
| phi-3-mini 3.8B | 2024-04-23 | 2024 | Open weights | 117.24 | 10.01 |
| Mistral Small 3.2 | 2025-06-20 | 2025 | Open weights | 131.75 | 15.71 |
| Mistral Small 3.1 | 2025-03-17 | 2025 | Open weights | 127.48 | 14.42 |
| Mistral Small 3 | 2025-01-30 | 2025 | Open weights | 127.07 | 14.83 |
| Mistral 7B v0.3 | 2023-10-10 | 2023 | Open weights | 108.75 | 17.13 |
| Magistral Small 1.2 | 2025-09-18 | 2025 | Open weights | 131.42 | 18.58 |
| Llama 3.2 1B | 2024-09-24 | 2024 | Open weights | 102.43 | 33.41 |
| Llama 3-8B | 2024-04-18 | 2024 | Open weights | 116.33 | 10.92 |
| Llama 2-7B | 2023-07-18 | 2023 | Open weights | 98.61 | 27.27 |
| Gemini 3.1 Flash-Lite | 2026-03-03 | 2026 | Closed weights | 144.51 | 11.89 |
| Qwen 3.6 35B-A3B | 2026-04-14 | 2026 | Open weights | 143.88 | 15.01 |
First 30 of 242 rows shown. The CSV contains all rows.
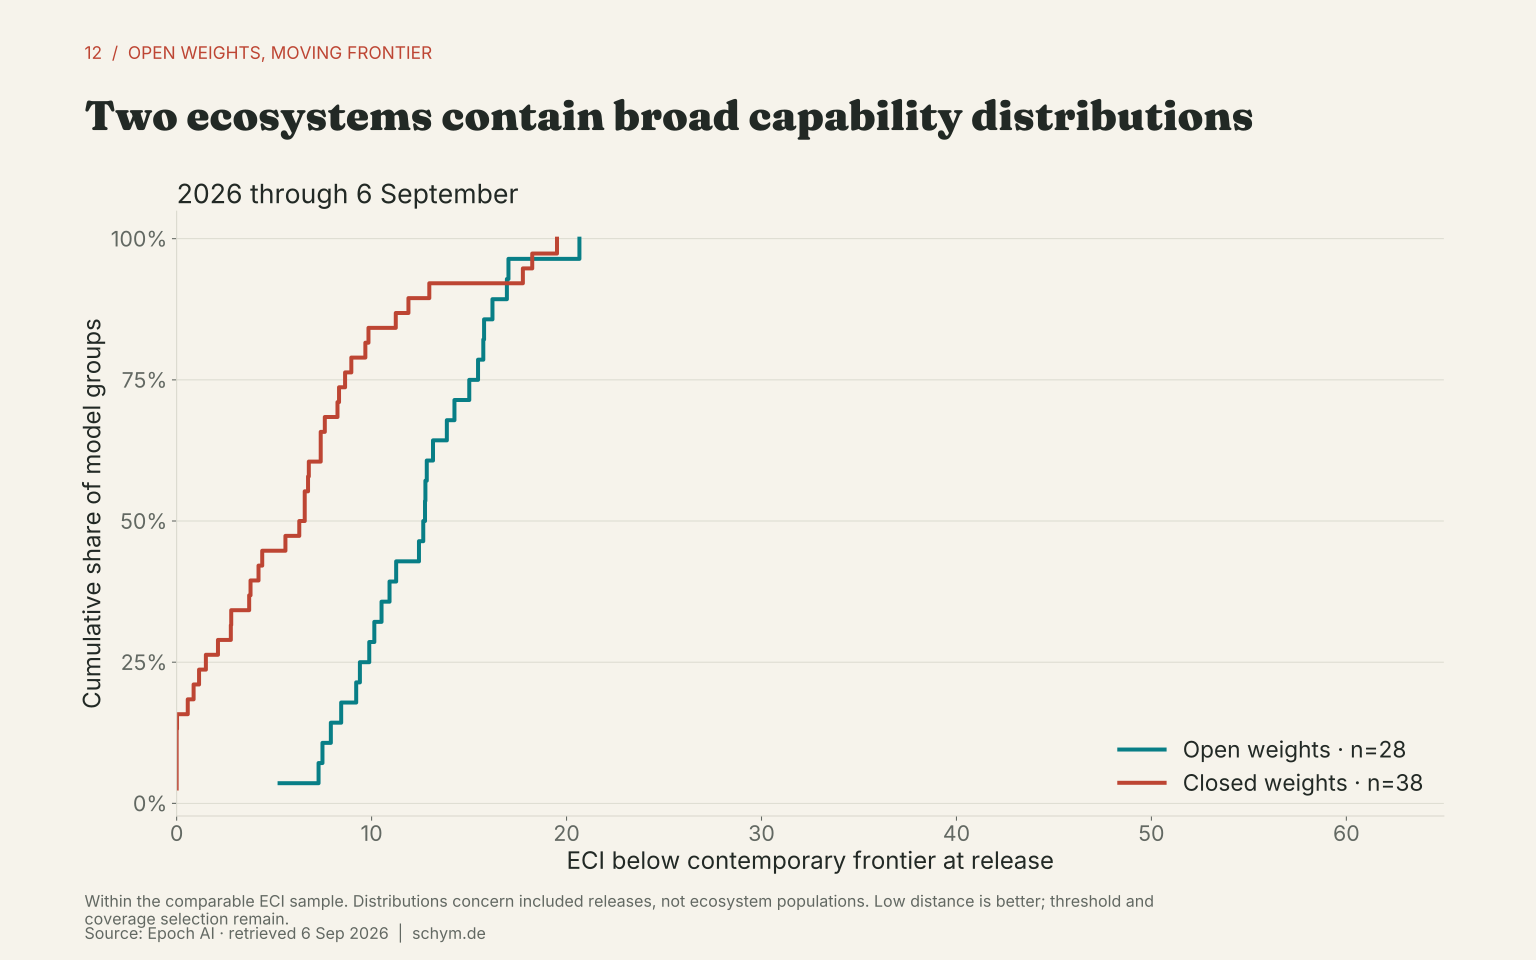
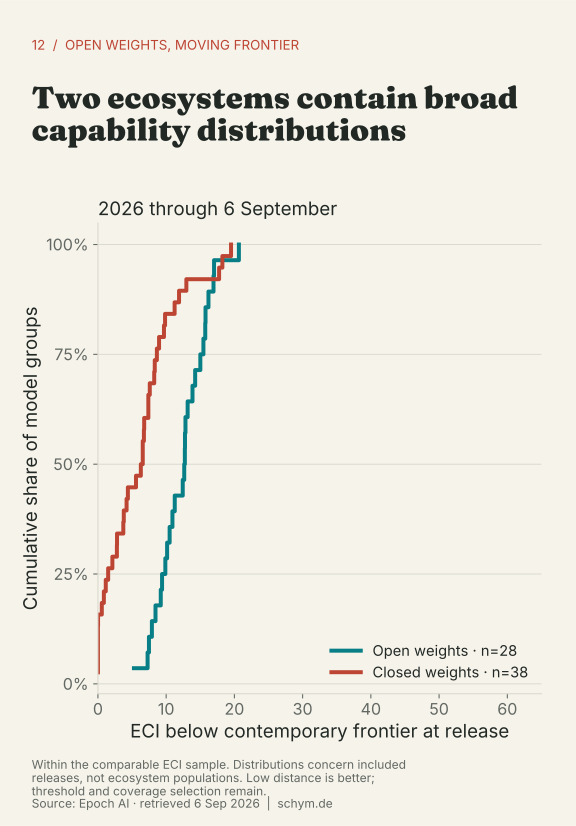
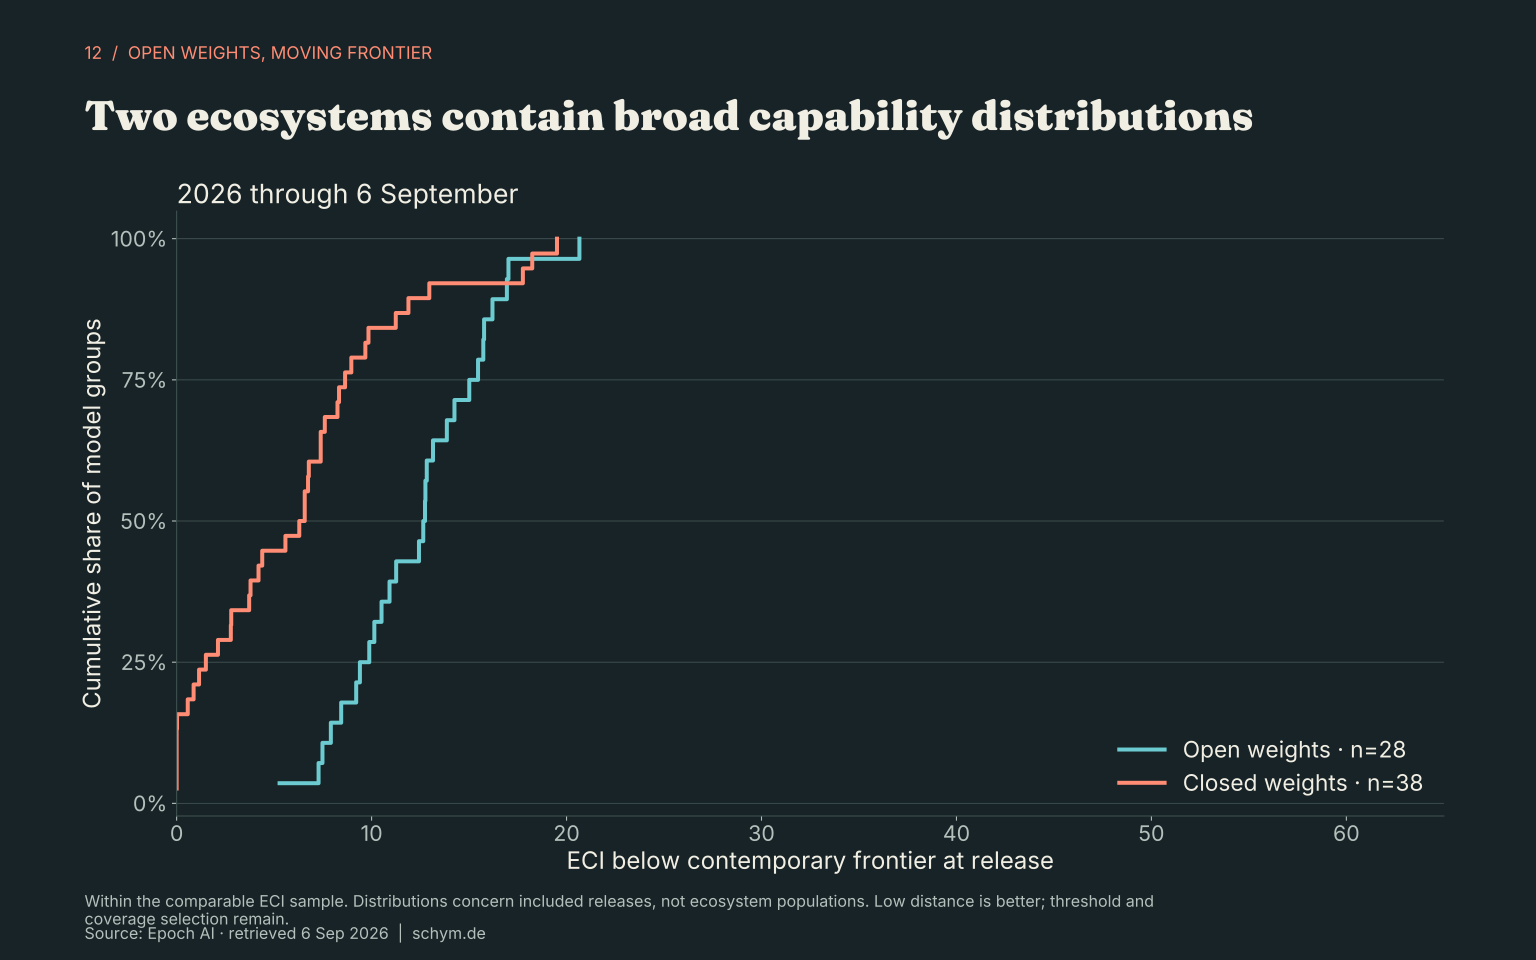
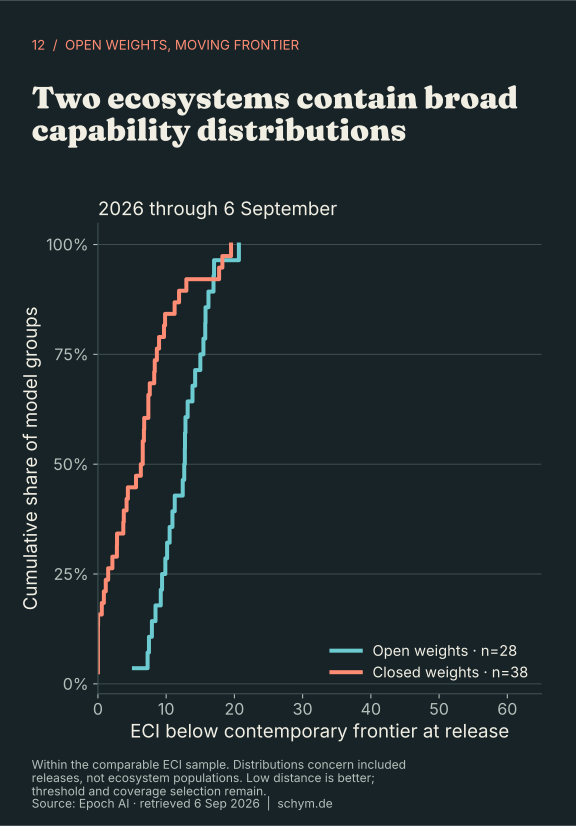
Download values as CSVThe two record lines also conceal two distributions. The 2026 ECI sample includes 28 open and 38 closed groups, spanning wide distances from their release-date frontier. Those distributions describe evaluated groups, not all released models. A frontier race is a comparison of extremes; the usefulness of the broader ecosystem depends on the capabilities, access terms and deployment needs of individual users.
What survives the checks
The full public ECI sample, notable-only sample and exact-name metadata matches retain the same current leaders and gap. Restricting to unrestricted weights increases the gap. Tight capability-relevance screens enlarge it further by excluding models that arrive farther behind; this is a change of universe, not a bias correction. The strict reported-compute sample is too small for a capability race. Latest-version dating tests one chronology choice without claiming to reconstruct historical evaluation conditions.
The analysis cannot answer capability-lag questions before 2023, infer true market shares from curated release counts, or turn absent metadata into evidence of deliberate secrecy. ECI is one fitted benchmark-based capability indicator, subject to benchmark selection and model uncertainty. Training costs are modeled; the recent compute frontier is partly undisclosed. Historical coverage and survivorship change the composition of the sample.
Open-weight AI is catching portions of the frontier through consequential releases. It is not catching it continuously in this record. The defensible interpretation is a sequence of compressions and reopenings, with access restrictions and uneven disclosure shaping what “catching up” means. Whether that process becomes permanently more capital intensive remains a question for better cost and compute evidence.
Sources and reproducibility
Primary source: Epoch AI, AI Models, downloaded 6 September 2026 at 04:54:06.958785 UTC; 3,601 rows and 57 original fields. Snapshot SHA-256: 7f8d767be1e91b844b66d9d8ea0788f831219e7887f656e17c64fe1e2fbedab6.
Capability supplement: Epoch AI, Benchmarked models, downloaded 6 September 2026 at 04:57:41.668057 UTC. Snapshot SHA-256: b798c025fcc3a973b7267817581471d256fc15c41f57d7a79f6f4774a168f987.
Epoch did not expose a semantic dataset version; these timestamped content hashes identify the exact versions used. Raw CSVs, original fields, per-analysis sample counts, transformations, regression coefficients, sensitivity tables and source receipts accompany the story. Data credit: Epoch AI; calculations, editorial analysis and figures: Michael Schymura.
Open the evidence ledger
Every estimate has a sample and a boundary. The full tables retain missing cells and original source fields.
Methods and exact snapshot versions
Data and methods
Frozen acquisition and version identity
The analysis uses the downloadable Epoch AI model CSVs, retrieved on 6 September 2026 UTC. The all-model snapshot contains 3,601 records and 57 original fields. The primary 2020–6 September 2026 study contains 2,749 dated records. Weight accessibility is known for 2,334: 1,269 open-weight and 1,065 closed-weight records; 415 remain unknown. No original field or original CSV byte is overwritten.
Epoch did not expose a semantic version number or a Last-Modified header for these CSV responses. The dataset version used here is the timestamped, SHA-256-identified snapshot below, not an invented database release number. The source page described the all-model data as updated 6 September; subset snapshots displayed 3 September. Do not assume the five files were generated atomically. Preserve each receipt and original response separately.
| File | Retrieved UTC | SHA-256 |
|---|---|---|
| all_ai_models.csv | 2026-09-06T04:54:06.958785+00:00 | 7f8d767be1e91b844b66d9d8ea0788f831219e7887f656e17c64fe1e2fbedab6 |
| notable_ai_models.csv | 2026-09-06T04:54:06.719768+00:00 | 59b5155a167f0019e79433961cd9a1af30dd50bef60978f7beaa5ca8c0367d9c |
| frontier_ai_models.csv | 2026-09-06T04:54:06.677360+00:00 | 146aa9db5515df8da624537987f854c259260b4dfc86217cb7316f0432ab477a |
| large_scale_ai_models.csv | 2026-09-06T04:54:06.597856+00:00 | a7246354b42fab3d70cbd565bd2c2bd9c14e507d62d948a081410511f279ed58 |
| benchmarked_models.csv | 2026-09-06T04:57:41.668057+00:00 | b798c025fcc3a973b7267817581471d256fc15c41f57d7a79f6f4774a168f987 |
The ECI supplement is a separate Epoch data product. Its 927 version/configuration rows contain 657 scored rows, which collapse to 250 model groups with identical group scores. Six groups have unknown accessibility. Two unreleased closed groups are excluded from the public capability race, leaving 242 groups (128 open, 114 closed). There are 216 exact group-to-main-CSV name matches before those exclusions and 211 after them. Unmatched capability groups retain their ECI-side metadata, but missing model-CSV fields stay missing. There is no fuzzy match or external license enrichment.
Taxonomy and universes
- Frontier closed/proprietary: Epoch Frontier model flag true and weight accessibility API, hosted without API, or unreleased.
- Frontier open-weight: same flag and any Epoch category beginning “Open weights”.
- Non-frontier open-weight: open weights and no positive flag; this is operationally “not flagged”, not proof of non-frontier capability.
- Non-frontier closed: closed weights and no positive flag, with the same qualification.
Unknown accessibility is a fifth audit stratum, excluded from binary contrasts. Closed does not necessarily mean a for-profit proprietor: the organization field separately identifies industry, academia and other combinations. Unreleased records are included in the broad metadata/compute census but excluded from the public ECI race. “Open weights (unrestricted)”, “Open weights (restricted use)” and “Open weights (non-commercial)” remain distinguishable. Downloadable weights are never equated with open source. The main CSV provides training-code accessibility but no structured complete-model open-source, recipe, training-data-license or reproducibility census. Dataset size is not data disclosure. License categories are descriptive Epoch metadata, not legal verification.
Epoch’s flag is a compute-frontier proxy, not a benchmark ranking. It marks 49 records in this study: seven open and 42 closed. No 2026 record is flagged. We therefore separately define capability-relevant as within five ECI points of the best publicly accessible score on the recorded release date (sensitivity: three and ten points). This is an analyst threshold, not an Epoch designation. A reconstructed known-compute top-ten screen ranks each dated record against all earlier or same-day records with known compute across the full historical CSV; ties are included. It is coverage-dependent and is never called a capability score.
Capability, chronology and uncertainty
Only the current fitted Epoch Capabilities Index is used for cross-family capability comparisons. ECI combines benchmark information statistically; it is a modeled indicator, not an observed universal ability. Its scale is not a percentage, economic productivity unit or human-intelligence scale. We do not merge older ECI fits, incompatible benchmark results, or parameter counts into it. Benchmark choice, evaluation harnesses, inference configurations, contamination, group-level pooling and missing evaluations all limit interpretation. The earliest scored group is dated 24 February 2023; there is no support for a comparable capability-lag estimate in 2020–22.
For each group, the primary availability date is the later of Publication date and the earliest dated Version release date in the current benchmark file. This prevents public-announcement dates from placing o3 ahead of its April 2025 release and avoids assigning September 2024 Gemini versions to February. The latest-version-date sensitivity instead uses the latest recorded version in the group. Neither correction reconstructs when every evaluation was performed or when weights first became downloadable. Accessibility is a present snapshot, not a historical license panel. Later-opened models can still be backdated; this remains a limitation.
At each day, the closed/open frontier is the maximum ECI among released, known-access groups in that class. The overall frontier is the maximum of both. Gap = overall maximum minus open maximum. The “backward clock” measures elapsed time since the closed frontier first strictly exceeded the current open point score. A tie is considered reached. Daily dates imply one-day resolution; 30.4375 days define one month. This is distinct from the forward delay of a fixed threshold. If the earliest observed closed model already exceeds the open score, the backward clock is left-censored; those early lower bounds are omitted from the lag chart. Annual lag summaries before July 2024 must not be interpreted as exact averages. Annual capability gaps are daily weighted, with 2023 and 2026 partial years.
The download supplies marginal 90% ECI intervals. These are shown for selected models. Subtracting interval endpoints produces a descriptive envelope, not a joint confidence interval for the gap or an interval for the selected maximum. The latest envelope is 4.72–18.96 ECI. Paired bootstrap score draws and their covariance are not supplied here; therefore we cannot reproduce Epoch’s paired-bootstrap tie rule or assign a confidence interval to our month estimate. A May 2026 Epoch essay reported a shorter lag under another cutoff and statistical rule. That figure is not a contradiction of this September strict point-score clock and is not silently reused.
Diffusion and release events
For ECI thresholds 130, 135, 140, 145, 150, 155 and 160, find the first dated closed group, first open group, and first open group with known total parameters ≤40 billion. The earlier 120/125 thresholds are retained only in audit tables because closed first crossing is left-censored. Unreached thresholds are right-censored at 6 September 2026 and shown with lower bounds, never assigned a synthetic completion date. The 65 qualifying smaller groups provide a size screen only: we do not claim a specific consumer GPU, inference price or availability to every user. Total rather than active mixture-of-experts parameters avoids pretending inactive weights occupy no memory. No supported cheap-model cost series is available.
Rank breakthroughs by the positive jump in the open record, measured against the same-day overall frontier. The first observed open record has no prior comparator and no jump rank. Equal scores are not new records. Seven jumps are at least two ECI points; five largest account for 48.3% of total observed open-record improvements after the first observation. Because maxima are step functions by construction, step-shaped plots alone do not prove a burst mechanism. The useful evidence is the size of particular contractions, reopenings in the following 90 days, and the non-monotonic annual mean gap. We make no causal claim about secrecy, releases or commercial strategy.
Compute, cost, parameters, data and power
Training FLOP are taken from Epoch with original estimation-method, confidence, notes, lower and upper bounds retained. There are 1,077 positive compute entries among 2,749 study records; 986 have known weight accessibility. “Reported” is a strict single-category screen: 55 records, 48 with known accessibility. Developer reported does not mean independently observed or metered. Mixed “Reported” plus estimation categories do not pass the strict screen. Missingness is never imputed. Neither Epoch’s confidence label nor the presence of an exact-looking number converts an estimate into a measurement.
For each year and class, annual release statistics include median, pandas linear-interpolated 90th percentile, maximum and non-missing N. Additional rows restrict to frontier-flagged records. Separate cumulative maximum tables show the known compute record up to year-end, with the model and release date. The proprietary/open ratio divides those two cumulative maxima within the selected universe; annual ratios are also available from annual maxima. A carried maximum stays visible as an old observation. Log scales handle orders of magnitude. The true undisclosed frontier may be higher. Epoch lower/upper compute bounds are retained, but no comparable comprehensive uncertainty distribution is assumed.
Training cost is Epoch’s estimated training compute cost in constant 2023 USD. All 165 populated cost entries are treated as modeled estimates; none is rebranded observed expenditure. We do not infer costs for missing models, count inference or post-training budgets as pretraining compute, or equate estimated training cost with total R&D. Recent estimates are particularly sparse: nine in 2024, nine in 2025 and one in 2026. Parameters and training power are reported alongside source notes where present. Architecture is operationalized only by the Approach field. Dataset-size availability is comparable as metadata; dataset-size magnitudes are not pooled across tokens, images and other domains.
Concentration and recurrent producers
Normalize the documented organization aliases, then split one release credit equally across its listed unique organizations. Countries are handled separately and fractionally. A model therefore contributes one total credit to each attributed level. Missing attribution is excluded from that denominator and counted. HHI = 10,000 × sum of squared credit shares. Report top-three, top-five, top-ten shares and all organization/country shares by year and pooled window. Alphabetical ties do not affect summed shares. Parent-group aliases are a sensitivity choice: organization-level concentration can change with co-development conventions and corporate restructuring. Country refers to the organization’s recorded country, not the training datacenter, employee nationality or origin of all inputs.
Two frontier universes are reported, with their very different denominators. The top-three open share is 71.4% among seven Epoch-flagged releases and 85.7% among fourteen groups within five ECI of the release-date frontier. The corresponding closed shares are 59.5% among 42 flags and 92.9% among 56 comparable near-frontier groups. Such counts are database-release shares, not model usage, revenue, market power, innovation rates or a representative census. The five-point screen produces no open entrant in 2026: this is a threshold result, not disappearance of the ecosystem.
Recurrent high-compute open producers are counted among records with known training compute ≥10^24 FLOP. Counts measure included model records and may include variants or derivative training; they do not identify independent from-scratch training investments.
Logistic regression and disclosure
Estimate unpenalized logistic regressions for current open weights on log10 training compute, log10 parameters, linear publication year, organization type and country. Fit compute-only, parameter-only and joint specifications within all, notable, Epoch-frontier, reported-compute, capability-complete, known-compute-top-ten and Language subsets. Categorical organization types: industry-only, academia-only (reference), mixed/other. Countries: China (reference), USA, other/multinational. Rows missing any required variable are excluded and enumerated; there is no imputation. Organization clustering uses the normalized full co-organization set. This groups identical collaborators rather than creating fractional regression observations.
The joint all-model specification uses 897 complete cases and 364 clusters, excluding 1,852 study records. Maximum likelihood is solved with analytic gradient; a Hessian condition number above 10^12 or absolute coefficient above 30 blocks the fit. Fewer than 70 complete cases or fewer than 15 observations in either accessibility class blocks estimation. We retain convergence diagnostics, counts and exclusions for every attempted fit. Coefficient 95% intervals use organization-cluster sandwich covariance and finite-sample correction. Average marginal effects use sample-averaged derivatives for continuous covariates and discrete changes for indicators; delta-method intervals include covariance. These are conditional associations in a selected sample. Reporting selection, organization practices, release strategy, domain and correlated compute/parameter scale prevent causal interpretation. The Language restriction is a sensitivity check, not a comprehensive task or architecture adjustment.
Transparency is the eight-field unweighted metadata-availability score described in disclosure.md. Estimates count as available data; code marked Unreleased counts as a known code status. Separate reported-compute and actual code-available rates avoid confusing a known negative status with access. A field’s absence means missing here, not necessarily secrecy by its producer. The composite is not a full open-source score.
Sensitivity and failure boundaries
All 242 public ECI groups, 101 notable groups and 211 exact metadata-matched groups give the same current leading models and 11.61-point gap. The ten-point release-relevance screen (148 groups) does too. The five-point screen (70 groups) and three-point screen (48 groups) exclude later open releases that arrive farther from the frontier, and mechanically enlarge the current subset gap to 23.44 and 30.24. The flag-only ECI universe has just fourteen groups and stale leaders; it is unsuitable as a correction to the current capability frontier. The four strictly reported-compute ECI groups cannot support a two-sided comparison. This failure is itself substantive disclosure evidence.
Latest-version dating yields annual average gaps of 5.90 ECI in 2024, 5.78 in 2025 and 9.18 in 2026 to date, compared with 5.94, 5.82 and 9.18 under the primary date rule. The current 11.61-point gap and 6.08-month clock are unchanged. This date sensitivity retains the episodic interpretation without combining scores from different index fits. The three/five/ten-point screens test how the definition of relevance affects concentration. Availability sensitivity excludes restricted and non-commercial weights. Compute analyses include the strict reported-only sample, all models, notable models, flags, reconstructed top ten and complete capability/accessibility cases; all cell denominators are exported. The 2026 compute and cost observations do not support a strong contemporaneous capital-divergence conclusion.
The central supported statement is descriptive: several large open releases materially narrowed the modeled capability distance, followed by renewed widening. Continuous catch-up is not supported over the observed 2023–26 window. Nor does this establish permanent divergence. Historical coverage changes, survivorship, selection into Epoch, differential benchmark inclusion, statistical model fitting, licensing changes and missing high-end compute remain material. Raw release counts are never interpreted as innovation rates.
Major frontier and open releases by year
Major models
The early years use known training compute as a relevance screen, not a capability ranking. Later years use the best comparable ECI scores. Missing values remain missing.
| Year | Model | Organization | Release date | FLOP | Parameters | ECI | Gap at release | Selection |
|---|---|---|---|---|---|---|---|---|
| 2,020.00 | mT5-XXL | Google,Google Research | 2020-10-20 | 8.2e+22 | 1.3e+10 | — | — | Known-compute relevance; no comparable ECI |
| 2,020.00 | LUKE | University of Washington,National Institute of Informatics | 2020-10-02 | 1.81e+22 | 4.83e+08 | — | — | Known-compute relevance; no comparable ECI |
| 2,021.00 | Switch | 2021-01-11 | 8.22e+22 | 1.57e+12 | — | — | Known-compute relevance; no comparable ECI | |
| 2,021.00 | ByT5-XXL | Google,Google Research | 2021-05-28 | 8.1e+22 | 1.29e+10 | — | — | Known-compute relevance; no comparable ECI |
| 2,022.00 | BlenderBot 3 | McGill University,Meta AI,Mila - Quebec AI (originally Montreal Institute for Learning Algorithms) | 2022-08-10 | 4.3e+23 | 1.75e+11 | — | — | Known-compute relevance; no comparable ECI |
| 2,022.00 | OPT-175B | Meta AI | 2022-05-02 | 4.3e+23 | 1.75e+11 | — | — | Known-compute relevance; no comparable ECI |
| 2,023.00 | Mixtral 8x7B | Mistral AI | 2023-12-11 | 7.74e+23 | 4.67e+10 | 118.38 | 8.08 | Highest ECI that year |
| 2,023.00 | Yi-34B | 01.AI | 2023-11-02 | 6.1e+23 | 3.4e+10 | 117.28 | 8.60 | Highest ECI that year |
| 2,023.00 | Stable Beluga 2 | Stability AI | 2023-07-20 | — | 7e+10 | 116.98 | 8.90 | Highest ECI that year |
| 2,024.00 | DeepSeek-V3 | DeepSeek | 2024-12-26 | 3.3e+24 | 6.71e+11 | 132.36 | 9.54 | Highest ECI that year |
| 2,024.00 | Phi-4 | Microsoft Research | 2024-12-12 | 9.32e+23 | 1.4e+10 | 130.43 | 5.41 | Highest ECI that year |
| 2,024.00 | Qwen2.5-72B | Alibaba | 2024-09-19 | 7.8e+24 | 7.27e+10 | 129.00 | 6.84 | Highest ECI that year |
| 2,025.00 | DeepSeek-V3.2 | DeepSeek | 2025-12-01 | 4.2e+24 | — | 146.21 | 6.73 | Highest ECI that year |
| 2,025.00 | Kimi K2 Thinking | Moonshot | 2025-11-06 | 4.2e+24 | 1e+12 | 145.79 | 4.51 | Highest ECI that year |
| 2,025.00 | DeepSeek-V3.2-Exp | DeepSeek | 2025-09-29 | 4.18e+24 | 6.71e+11 | 145.06 | 4.94 | Highest ECI that year |
| 2,026.00 | Kimi K3 | Moonshot | 2026-07-16 | 2e+25 | 2.8e+12 | 157.62 | 5.28 | Highest ECI that year |
| 2,026.00 | DeepSeek V4 Pro 0813 | DeepSeek | 2026-08-13 | — | — | 155.42 | 7.48 | Highest ECI that year |
| 2,026.00 | DeepSeek V4 Flash 0731 | DeepSeek | 2026-07-31 | 2.5e+24 | 2.84e+11 | 154.46 | 8.44 | Highest ECI that year |
Closed comparison releases
| group | organization | date | eci | distance_at_release | compute | parameters |
|---|---|---|---|---|---|---|
| GPT-6 Astra | OpenAI | 2026-09-03 | 169.23 | 0.00 | — | — |
| Claude Fable 5 | Anthropic | 2026-06-09 | 162.90 | 0.00 | — | — |
| Claude Fable 5.1 | Anthropic | 2026-09-01 | 162.88 | 0.02 | — | — |
| GPT-5.2 Pro | OpenAI | 2025-12-11 | 155.30 | 0.00 | — | — |
| GPT-5.2 | OpenAI | 2025-12-11 | 153.43 | 1.87 | — | — |
| Gemini 3 Pro | Google DeepMind | 2025-11-18 | 152.94 | 0.00 | — | — |
| o1 | OpenAI | 2024-12-17 | 141.90 | 0.00 | — | — |
| o1-mini | OpenAI | 2024-09-12 | 135.84 | 0.00 | — | — |
| o1-preview | OpenAI | 2024-09-12 | 134.79 | 1.05 | — | — |
| GPT-4 Turbo (Nov 2023) | OpenAI | 2023-11-06 | 126.46 | 0.00 | — | — |
| GPT-4 (Mar 2023) | OpenAI | 2023-03-15 | 125.88 | 0.00 | 2.1e+25 | 1.8e+12 |
| GPT-4 (Jun 2023) | OpenAI | 2023-06-13 | 123.09 | 2.79 | 2.1e+25 | 1.8e+12 |
Ranked breakthrough releases
Ranked open-weight breakthroughs
Ranking criterion: largest reduction in the same-day point-estimate gap when an open record was released. It measures an ECI contraction, not broader historical importance.
| Rank | Model | Date | ECI gain | Gap before | Gap after | Share compressed |
|---|---|---|---|---|---|---|
| 1.00 | DeepSeek-R1 | 2025-01-20 | 6.63 | 9.54 | 2.91 | 69.5% |
| 2.00 | Kimi K3 | 2026-07-16 | 5.64 | 10.92 | 5.28 | 51.6% |
| 3.00 | Llama 2-70B | 2023-07-18 | 3.70 | 15.97 | 12.27 | 23.2% |
| 4.00 | Mixtral 8x22B | 2024-04-17 | 3.60 | 8.87 | 5.27 | 40.6% |
| 5.00 | Llama 3.1-405B | 2024-07-23 | 3.49 | 4.74 | 1.25 | 73.6% |
| 6.00 | Stable Beluga 2 | 2023-07-20 | 3.37 | 12.27 | 8.90 | 27.5% |
| 7.00 | Qwen3-235B-A22B-Thinking (Jul 2025) | 2025-07-25 | 2.56 | 6.14 | 3.58 | 41.7% |
| 8.00 | DeepSeek-R1 (May 2025) | 2025-05-28 | 1.94 | 7.53 | 5.59 | 25.8% |
| 9.00 | DeepSeek-V3 | 2024-12-26 | 1.93 | 11.47 | 9.54 | 16.8% |
| 10.00 | DeepSeek-V2 (MoE-236B, May 2024) | 2024-05-07 | 1.87 | 4.35 | 2.48 | 43.0% |
Organization and country concentration
Concentration
Each model receives one fractional release credit, divided equally between listed organizations or countries after documented alias normalization. These are shares of selected database releases, not market shares. Empty denominators are missing, not zero. HHI is on a 0–10,000 scale.
| scope | access | level | n_models | n_entities | top3 | top5 | top10 | hhi |
|---|---|---|---|---|---|---|---|---|
| epoch_frontier | Open weights | organization | 7.00 | 5.00 | 71.43 | 100.00 | 100.00 | 2,244.90 |
| epoch_frontier | Open weights | country | 7.00 | 2.00 | 100.00 | 100.00 | 100.00 | 7,551.02 |
| epoch_frontier | Closed weights | organization | 42.00 | 19.00 | 59.52 | 71.43 | 83.33 | 1,570.29 |
| epoch_frontier | Closed weights | country | 42.00 | 6.00 | 92.86 | 97.62 | 100.00 | 5,986.39 |
| capability_near5 | Open weights | organization | 14.00 | 5.00 | 85.71 | 100.00 | 100.00 | 2,653.06 |
| capability_near5 | Open weights | country | 14.00 | 3.00 | 100.00 | 100.00 | 100.00 | 4,591.84 |
| capability_near5 | Closed weights | organization | 56.00 | 5.00 | 92.86 | 100.00 | 100.00 | 3,507.65 |
| capability_near5 | Closed weights | country | 56.00 | 2.00 | 100.00 | 100.00 | 100.00 | 9,649.23 |
| access | level | entity | fractional_credits | share |
|---|---|---|---|---|
| Open weights | organization | DeepSeek | 4.00 | 0.29 |
| Open weights | organization | Alibaba | 3.00 | 0.21 |
| Open weights | organization | Moonshot | 1.00 | 0.07 |
| Open weights | organization | Meta | 5.00 | 0.36 |
| Open weights | organization | Mistral AI | 1.00 | 0.07 |
| Open weights | country | China | 8.00 | 0.57 |
| Open weights | country | United States of America | 5.00 | 0.36 |
| Open weights | country | France | 1.00 | 0.07 |
| Closed weights | organization | Anthropic | 15.00 | 0.27 |
| Closed weights | organization | OpenAI | 28.00 | 0.50 |
| Closed weights | organization | 9.00 | 0.16 | |
| Closed weights | organization | xAI | 3.00 | 0.05 |
| Closed weights | organization | Mistral AI | 1.00 | 0.02 |
| Closed weights | country | United States of America | 55.00 | 0.98 |
| Closed weights | country | France | 1.00 | 0.02 |
Coefficients, marginal effects and exclusions
Descriptive logistic regression
All-model joint specification: 897 complete cases; 1,852 exclusions from 2,749 dated records; 364 organization clusters. The response is current open-weight status. Continuous scale variables are log10, centred over the fitted sample. The year coefficient is linear since 2020. Reference categories are academia-only organizations and China. Intervals are 95%, based on a finite-sample corrected cluster sandwich covariance. Binary-factor effects are average discrete changes; continuous effects are average derivatives.
| term | coefficient | ci_low | ci_high | ame | ame_low | ame_high | n | clusters |
|---|---|---|---|---|---|---|---|---|
| Intercept | 0.70 | -0.15 | 1.55 | — | — | — | 897.00 | 364.00 |
| log10_compute | 0.48 | 0.31 | 0.65 | 0.09 | 0.06 | 0.11 | 897.00 | 364.00 |
| log10_parameters | -0.60 | -0.89 | -0.32 | -0.11 | -0.16 | -0.06 | 897.00 | 364.00 |
| year_since_2020 | 0.37 | 0.19 | 0.55 | 0.07 | 0.04 | 0.10 | 897.00 | 364.00 |
| organization_type_Industry only | -0.81 | -1.58 | -0.05 | -0.14 | -0.27 | -0.01 | 897.00 | 364.00 |
| organization_type_Mixed / other | 0.28 | -0.37 | 0.93 | 0.05 | -0.06 | 0.16 | 897.00 | 364.00 |
| country_group_Other / multinational | -0.81 | -1.54 | -0.08 | -0.15 | -0.28 | -0.02 | 897.00 | 364.00 |
| country_group_USA | -0.55 | -1.24 | 0.14 | -0.10 | -0.22 | 0.02 | 897.00 | 364.00 |
The main model has no domain controls; the Language sensitivity limits the domain and reports a separate fit. Joint scale effects should not be read as unadjusted group differences or as causal effects.
Sample accounting
| scope | spec | status | n | excluded | n_open | clusters | hessian_condition | max_gradient | log10_compute_parameter_correlation | aic |
|---|---|---|---|---|---|---|---|---|---|---|
| all | compute | fit | 980.00 | 1,769.00 | 663.00 | 404.00 | 394.49 | 0.00 | — | 1,132.61 |
| all | parameters | fit | 1,611.00 | 1,138.00 | 1,101.00 | 556.00 | 376.68 | 0.00 | — | 1,873.17 |
| all | joint | fit | 897.00 | 1,852.00 | 615.00 | 364.00 | 392.17 | 0.00 | 0.81 | 977.14 |
| notable | compute | fit | 323.00 | 282.00 | 195.00 | 158.00 | 563.06 | 0.00 | — | 402.82 |
| notable | parameters | fit | 422.00 | 183.00 | 252.00 | 192.00 | 437.59 | 0.00 | — | 537.64 |
| notable | joint | fit | 292.00 | 313.00 | 183.00 | 146.00 | 541.92 | 0.00 | 0.86 | 355.18 |
| epoch_frontier | compute | not fit: too few complete cases | 38.00 | 11.00 | — | — | — | — | — | — |
| epoch_frontier | parameters | not fit: too few complete cases | 31.00 | 18.00 | — | — | — | — | — | — |
| epoch_frontier | joint | not fit: too few complete cases | 31.00 | 18.00 | — | — | — | — | — | — |
| reported_only | compute | not fit: too few complete cases | 46.00 | 9.00 | — | — | — | — | — | — |
| reported_only | parameters | not fit: too few complete cases | 47.00 | 8.00 | — | — | — | — | — | — |
| reported_only | joint | not fit: too few complete cases | 45.00 | 10.00 | — | — | — | — | — | — |
| capability_complete | compute | not fit: too few complete cases | 101.00 | 112.00 | — | — | — | — | — | — |
| capability_complete | parameters | not fit: too few complete cases | 127.00 | 86.00 | — | — | — | — | — | — |
| capability_complete | joint | not fit: too few complete cases | 94.00 | 119.00 | — | — | — | — | — | — |
| known_compute_top10 | compute | not fit: too few complete cases | 65.00 | 1.00 | — | — | — | — | — | — |
| known_compute_top10 | parameters | not fit: too few complete cases | 54.00 | 12.00 | — | — | — | — | — | — |
| known_compute_top10 | joint | not fit: too few complete cases | 54.00 | 12.00 | — | — | — | — | — | — |
| language | compute | fit | 710.00 | 1,003.00 | 480.00 | 269.00 | 431.72 | 0.00 | — | 788.16 |
| language | parameters | fit | 1,244.00 | 469.00 | 869.00 | 405.00 | 369.98 | 0.00 | — | 1,367.86 |
| language | joint | fit | 686.00 | 1,027.00 | 474.00 | 262.00 | 389.10 | 0.00 | 0.84 | 704.33 |
Disclosure and missingness
Metadata availability and disclosure
The eight-field score is the unweighted mean of non-missing indicators for parameters, training compute, dataset size, cost estimate, approach, hardware, power estimate and code status. A known unreleased-code status contributes to metadata availability but not code availability. Estimates count as populated fields, not developer disclosure. No training-data or recipe disclosure is inferred from the dataset-size number.
| year | access | field | n_models | n_available | n_missing | rate |
|---|---|---|---|---|---|---|
| 2020-2026 | Open weights | Parameters | 1,269.00 | 1,123.00 | 146.00 | 0.88 |
| 2020-2026 | Open weights | Training compute | 1,269.00 | 669.00 | 600.00 | 0.53 |
| 2020-2026 | Open weights | Dataset size | 1,269.00 | 531.00 | 738.00 | 0.42 |
| 2020-2026 | Open weights | Training cost estimate | 1,269.00 | 103.00 | 1,166.00 | 0.08 |
| 2020-2026 | Open weights | Architecture / approach | 1,269.00 | 108.00 | 1,161.00 | 0.09 |
| 2020-2026 | Open weights | Hardware | 1,269.00 | 602.00 | 667.00 | 0.47 |
| 2020-2026 | Open weights | Power estimate | 1,269.00 | 400.00 | 869.00 | 0.32 |
| 2020-2026 | Open weights | Training code status | 1,269.00 | 1,068.00 | 201.00 | 0.84 |
| 2020-2026 | Open weights | Reported compute only | 1,269.00 | 28.00 | 1,241.00 | 0.02 |
| 2020-2026 | Open weights | Training code available | 1,269.00 | 441.00 | 828.00 | 0.35 |
| 2020-2026 | Closed weights | Parameters | 1,065.00 | 513.00 | 552.00 | 0.48 |
| 2020-2026 | Closed weights | Training compute | 1,065.00 | 317.00 | 748.00 | 0.30 |
| 2020-2026 | Closed weights | Dataset size | 1,065.00 | 257.00 | 808.00 | 0.24 |
| 2020-2026 | Closed weights | Training cost estimate | 1,065.00 | 62.00 | 1,003.00 | 0.06 |
| 2020-2026 | Closed weights | Architecture / approach | 1,065.00 | 97.00 | 968.00 | 0.09 |
| 2020-2026 | Closed weights | Hardware | 1,065.00 | 308.00 | 757.00 | 0.29 |
| 2020-2026 | Closed weights | Power estimate | 1,065.00 | 188.00 | 877.00 | 0.18 |
| 2020-2026 | Closed weights | Training code status | 1,065.00 | 954.00 | 111.00 | 0.90 |
| 2020-2026 | Closed weights | Reported compute only | 1,065.00 | 20.00 | 1,045.00 | 0.02 |
| 2020-2026 | Closed weights | Training code available | 1,065.00 | 136.00 | 929.00 | 0.13 |
| 2020-2026 | Unknown | Parameters | 415.00 | 183.00 | 232.00 | 0.44 |
| 2020-2026 | Unknown | Training compute | 415.00 | 91.00 | 324.00 | 0.22 |
| 2020-2026 | Unknown | Dataset size | 415.00 | 91.00 | 324.00 | 0.22 |
| 2020-2026 | Unknown | Training cost estimate | 415.00 | 0.00 | 415.00 | 0.00 |
| 2020-2026 | Unknown | Architecture / approach | 415.00 | 12.00 | 403.00 | 0.03 |
| 2020-2026 | Unknown | Hardware | 415.00 | 127.00 | 288.00 | 0.31 |
| 2020-2026 | Unknown | Power estimate | 415.00 | 92.00 | 323.00 | 0.22 |
| 2020-2026 | Unknown | Training code status | 415.00 | 15.00 | 400.00 | 0.04 |
| 2020-2026 | Unknown | Reported compute only | 415.00 | 7.00 | 408.00 | 0.02 |
| 2020-2026 | Unknown | Training code available | 415.00 | 7.00 | 408.00 | 0.02 |
Mean score: open weights 45.35/100; closed weights 31.64; unknown access 18.40. Equal weights are a transparent convention, not a validated latent openness index. The separate field rates carry more meaning than the composite.