Executive synthesis
The second pass through the machine
The first Solow After the Machine essay began with a theoretical warning: do not confuse tokens with factors, capital deepening with technical change, or task acceleration with system productivity. This sequel begins where that warning becomes testable. It takes a workbook built from the 1997–2024 integrated BEA–BLS production account, reconstructs its calculations across 63 industries, and asks whether the empirical headline survives contact with growth accounting.[1]
At first glance, the verdict is spectacular. Across 61 market industries from 2021 to 2024, the workbook’s value-added-weighted digital-capital proxy—software, research and development, and IT equipment—grew by 7.83% a year. Integrated total factor productivity grew by 0.57%. The subtraction yields a 7.26 percentage-point “accumulation gap.”
The arithmetic is correct. The economics is not. Capital quantity growth and TFP growth are not rival claims on the same unit of output. Capital enters growth accounting after multiplication by its income share. TFP is already the residual contribution left after measured inputs have been removed. Once the units are made comparable, the gap contracts from 7.26 points to 0.03.
That is the thesis of Part II. The puzzle has moved from accumulation to translation. AI makes a cognitive intermediate cheaper: code, text, forecasts, candidate molecules, decisions waiting to be checked. Firms sell something else—verified, integrated, compliant, shipped, and demanded output. Once generation becomes abundant, the shadow price migrates to the organization around it.
Three statements · three evidence levels
Separate what the data show from what the story wants them to show.
7.83% a year
AI-adjacent digital capital accumulated rapidly from 2021 to 2024.
A chain-weighted sensitivity measure returns 7.54%, so the investment-wave result is not an endpoint-weight artifact.
Weighted R² ≈ 0.02
Faster digital-capital growth did not reliably predict faster industry TFP.
The cross-section is useful for rejecting a simple translation story, not for estimating AI’s causal effect.
Not identified
The workbook cannot establish that AI raised aggregate technical efficiency.
There is no direct AI variable, the post-2021 window is short, and TFP absorbs utilization and measurement error.
Section 01
Correct the units before interpreting the gap
Growth accounting starts from a simple decomposition. Output growth equals the contribution of capital growth, the contribution of labor growth, and growth in total factor productivity. The contribution is the input’s growth rate multiplied by its share in income. TFP already occupies the contribution side of the account.
Raw capital growth becomes a contribution only after weighting by its income share. TFP is already a residual contribution.
The workbook’s 7.83% is a quantity growth rate. Its 0.57% is growth in an integrated TFP index. Subtracting one from the other is like comparing the speed of a conveyor belt with the share of factory output not explained by measured inputs. Both are rates. They are not the same economic object.
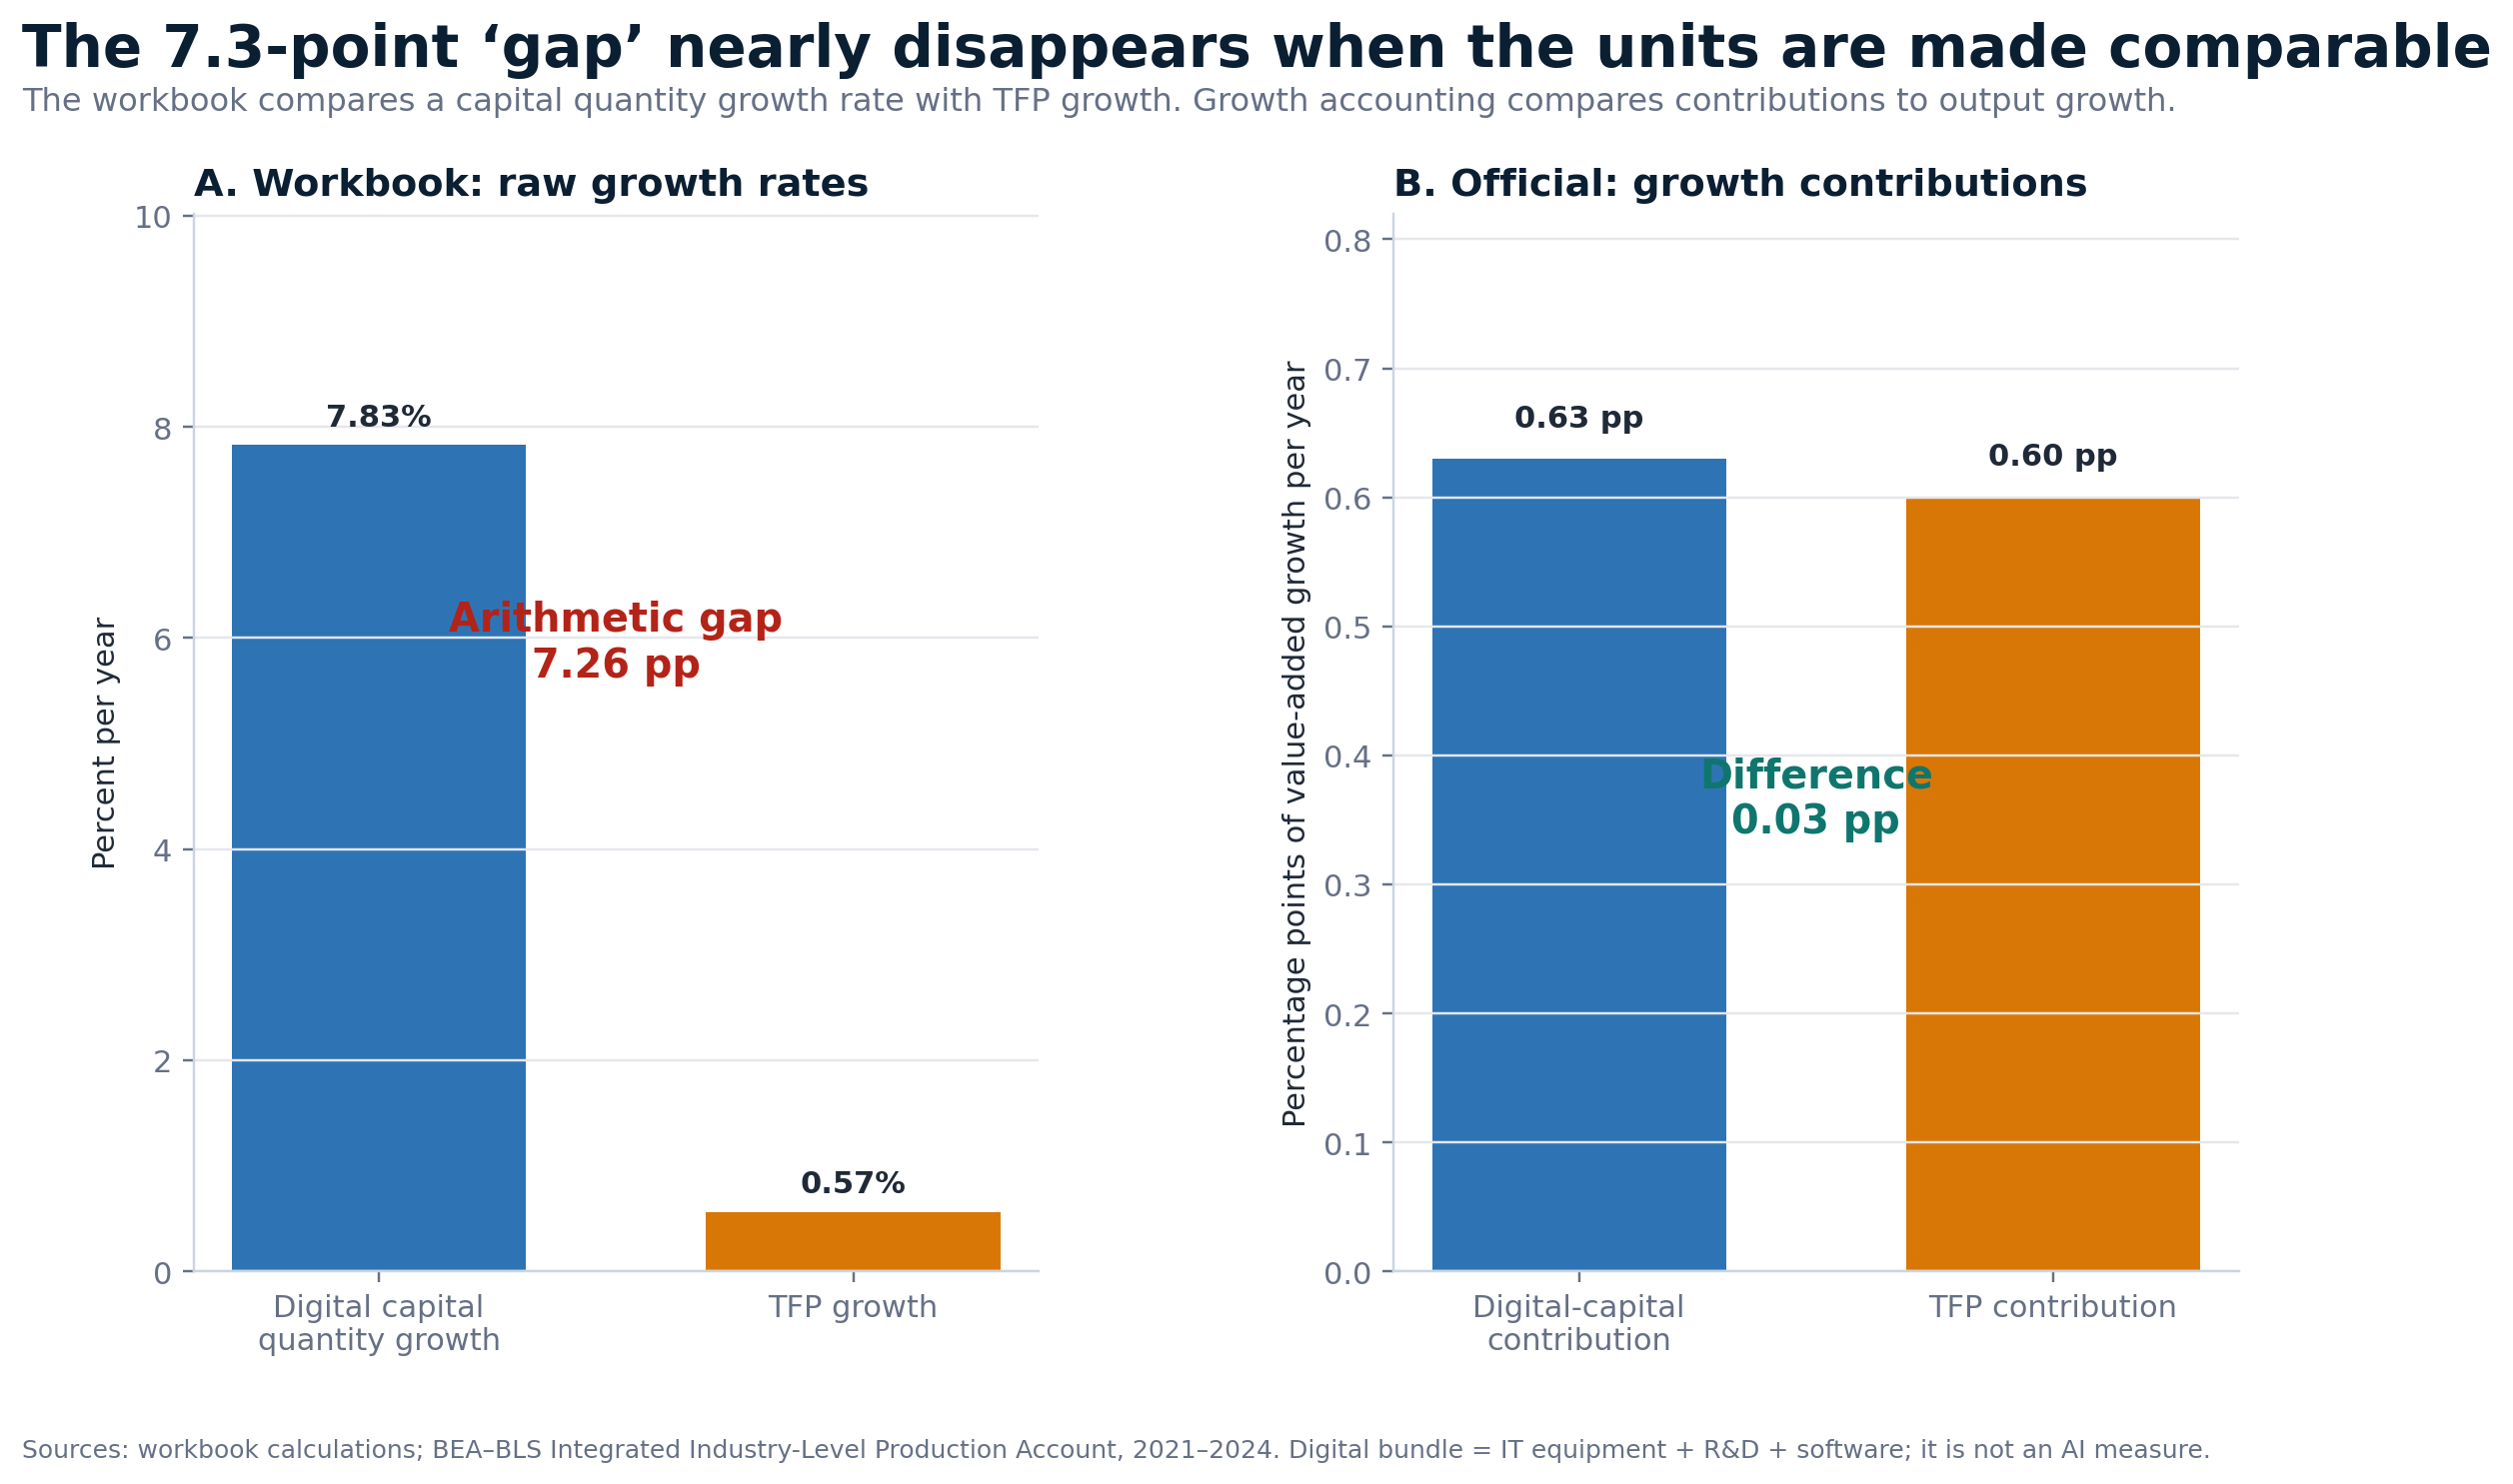
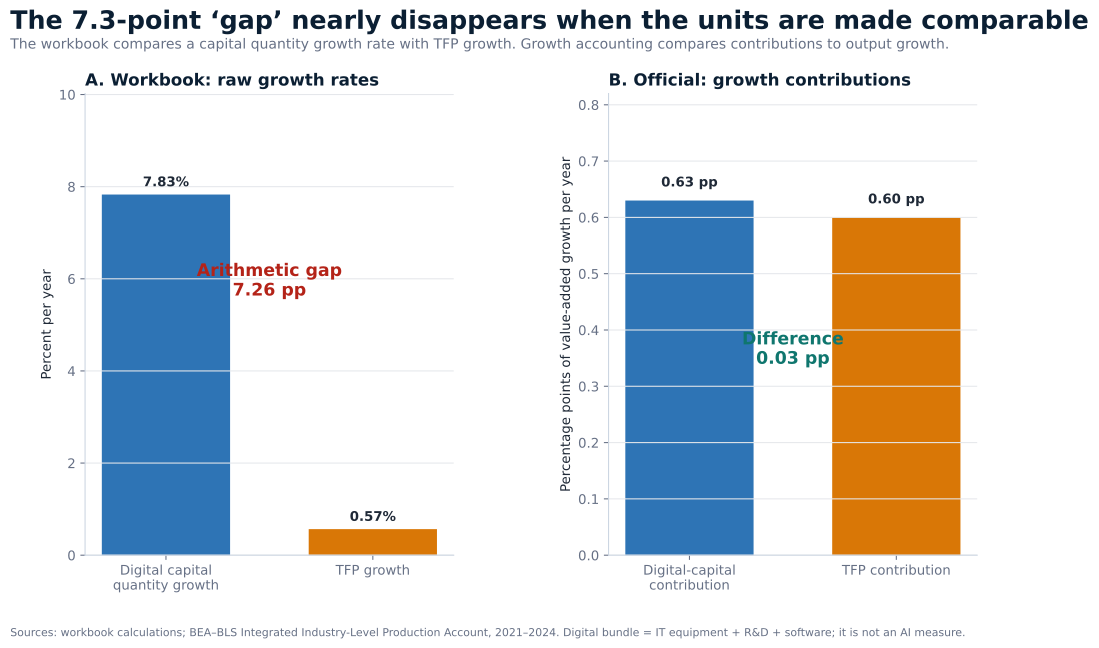
The official BEA–BLS contribution account supplies the comparable exercise. Between 2021 and 2024, IT equipment, R&D, and software together contributed about 0.63 percentage points to annual value-added growth. TFP contributed 0.60 points. The difference is 0.03 points—not 7.26.[2]
Evidence figure
DescriptiveThe 7.3-point gap nearly disappears when the units are comparable
The left panel reproduces the seductive subtraction. The right panel moves both objects into growth-contribution units.
Raw rates compared with growth-accounting contributions
The raw comparison subtracts digital-capital quantity growth of 7.83 percent from TFP growth of 0.57 percent. After both are expressed as contributions, digital capital contributes 0.63 percentage points and TFP contributes 0.60 percentage points.
Seductive comparison
Raw annual rates
Arithmetic difference
7.26 pp
Correct subtraction. Wrong economic comparison.
Unit repair
Rate × income share
Move capital growth onto the contribution side of the account.
Growth accounting
Comparable contributions
Comparable difference
0.03 pp
The category error disappears; the causal question remains.
Chart summary · Two-panel comparison showing a 7.26 percentage-point raw-rate difference and a 0.03-point difference after converting digital capital and TFP to comparable growth contributions.
View the underlying rate and contribution table
| Measure | Digital capital | TFP | Difference | Interpretation |
|---|---|---|---|---|
| Workbook raw growth rates | 7.83% | 0.57% | 7.26 pp | Unlike units |
| Official growth contributions | 0.63 pp | 0.60 pp | 0.03 pp | Comparable units |
The correction does not prove an AI productivity boom. Equality between the two contributions is not a theoretical benchmark, and the digital bundle contains conventional software and non-AI R&D while missing AI purchased as cloud and business services. It does something more basic and more valuable: it prevents a category error from becoming a theory of economic failure.
A separate approximation reinforces the scale. Applying adjacent-period compensation shares to the industry asset growth rates yields a digital-capital contribution proxy of about 0.68 points. That is close to the official 0.63, though the methods are not interchangeable. Read as: the capital wave matters, but it matters through shares and services—not through raw quantity growth alone.
Section 02
What the workbook measures—and what it does not
The source is the integrated industry-level production account jointly maintained by BEA and BLS. It links gross output, value added, capital services, labor, intermediate inputs, and productivity for 63 industries from 1997 through 2024. The reconstruction excludes Federal and State and local government from market aggregates, leaving 61 industries. The raw package is preserved, its files are hashed, and every web table is generated from validated CSV or JSON rather than live spreadsheet formulas.
Unit of observation
An industry-year quantity index or nominal value. The cross-section uses 2021–2024 CAGRs and 2024 value added.
Digital-capital proxy
Software, R&D, and IT quantity indexes combined with compensation shares. It is broader than AI and misses purchased AI services.
Aggregation lens
Fixed 2024 value-added weights produce a transparent descriptive mean. Official KLEMS contributions use a different aggregation system.
Identification limit
The workbook describes accumulation, co-movement, and sensitivity. It does not identify an AI treatment effect.
The workbook’s headline digital index uses each industry’s 2024 compensation shares to combine the three asset CAGRs. A chain-weighted Törnqvist-style alternative instead averages adjacent-period shares year by year. The result moves from 7.83% to 7.54%. That proximity is important: the accumulation result is robust to a better index. The causal story is not.
TFP requires equal care. It is the residual after measured input contributions have been removed. Under restrictive assumptions, it represents technical efficiency. In practice, it also absorbs capacity utilization, unmeasured quality, new varieties, markups, input error, reallocation, and aggregation choices. The sectors in which AI may matter most—finance, retail, wholesale, and professional services—are precisely those in which output and quality are difficult to measure.
Section 03
The investment wave is unambiguous. The J-curve is not.
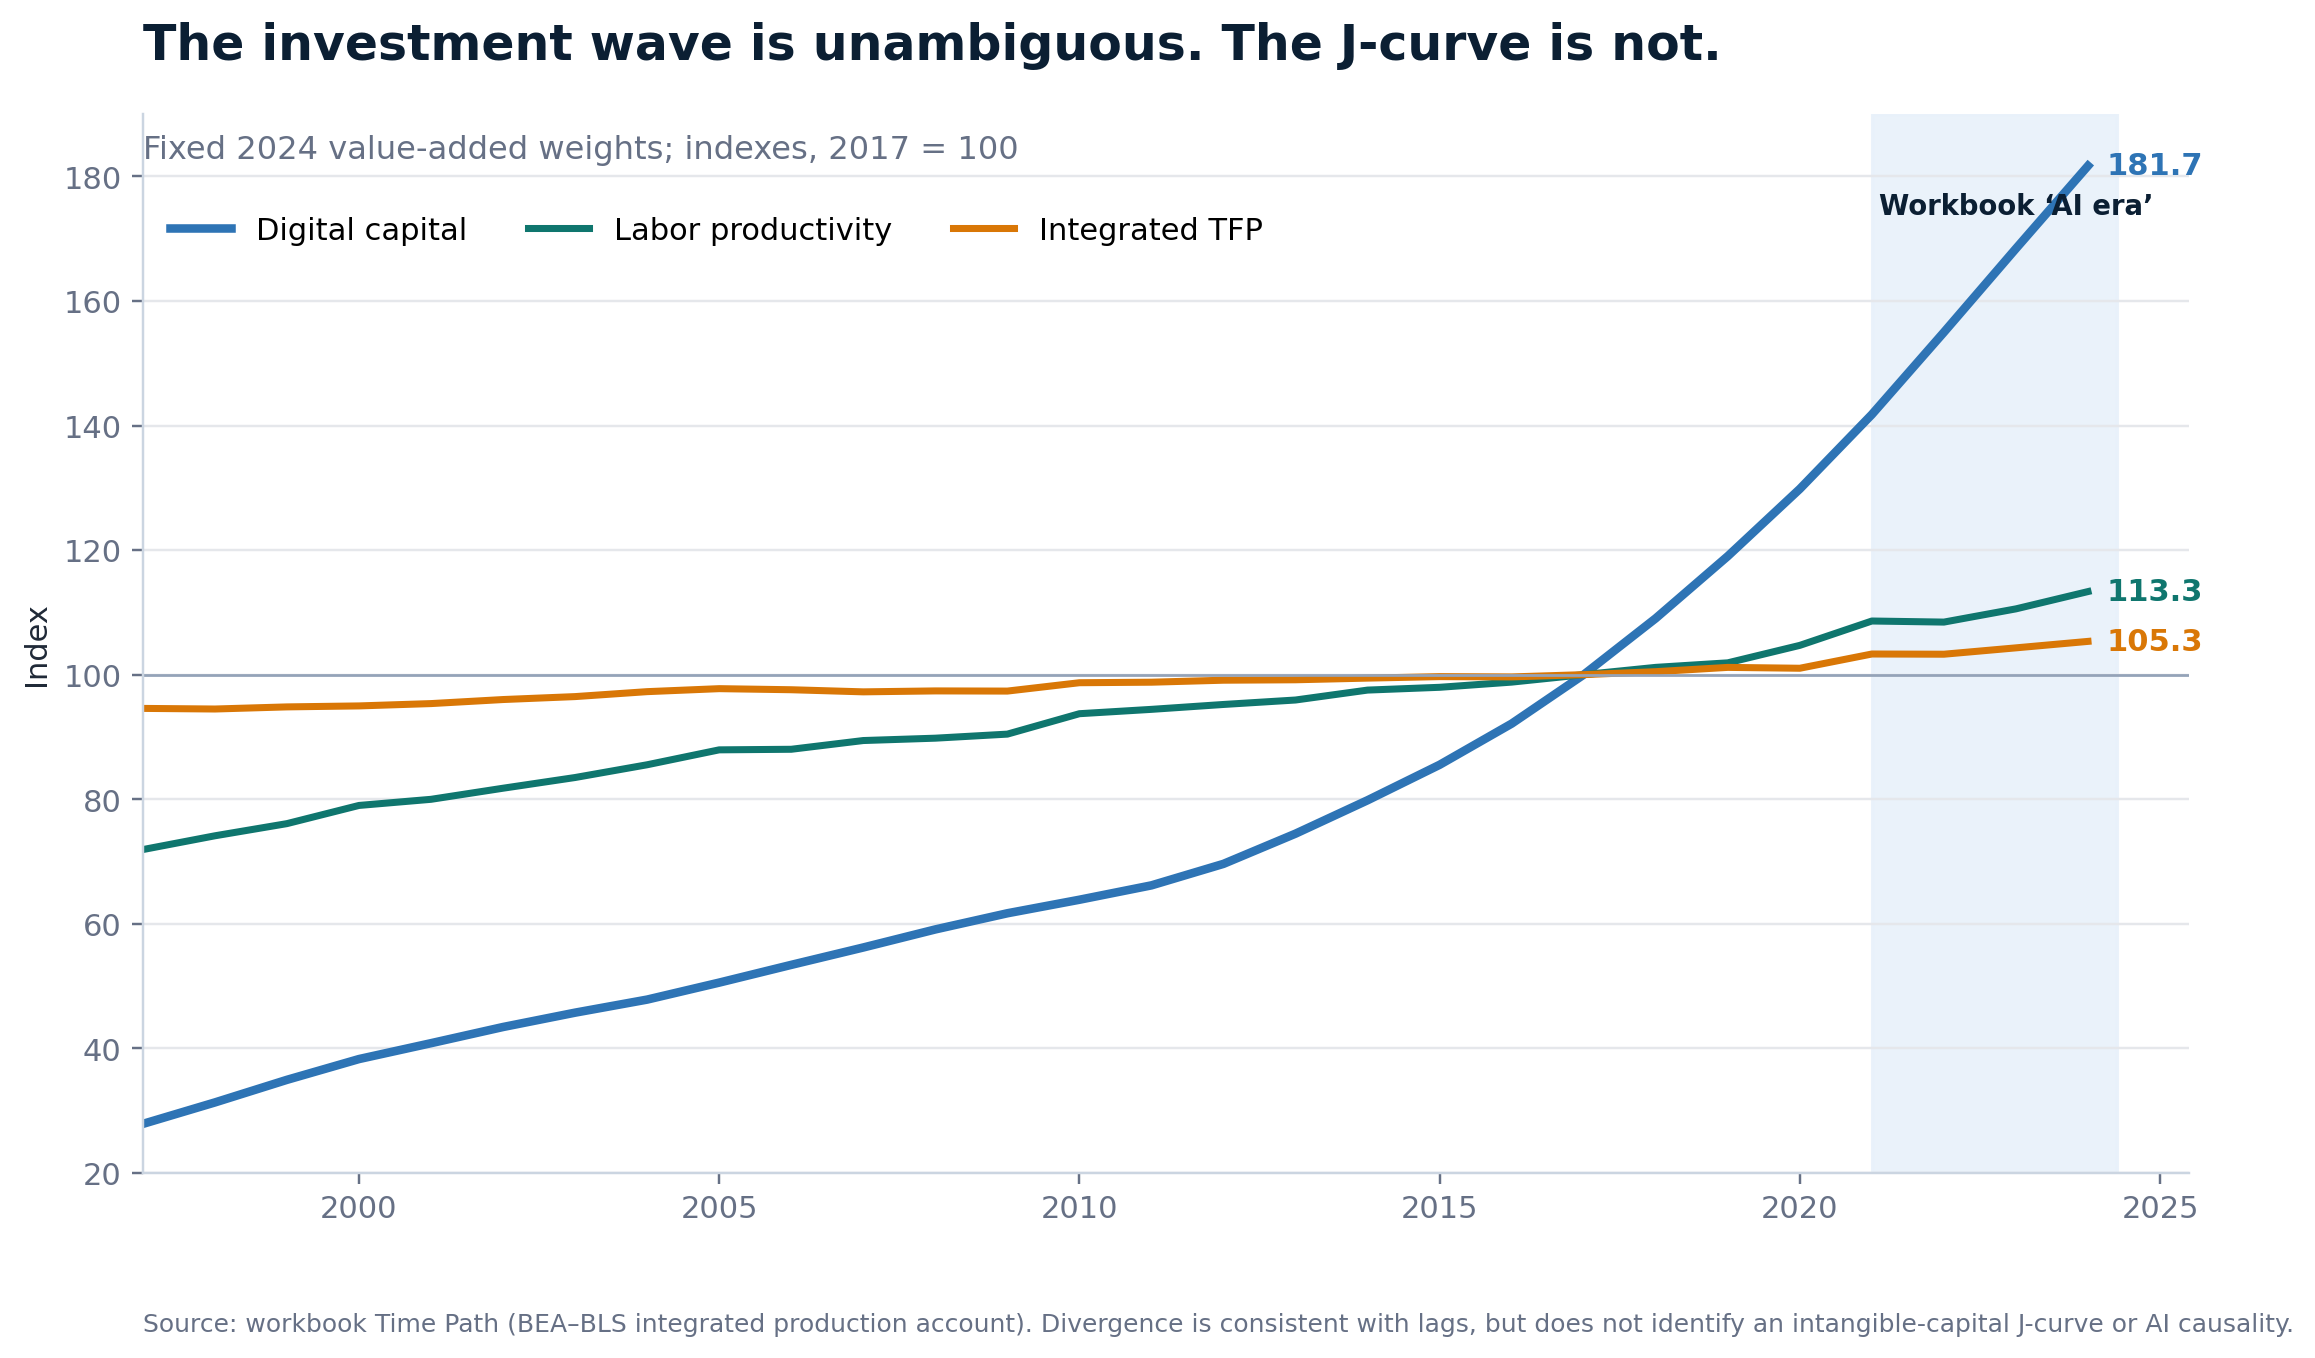
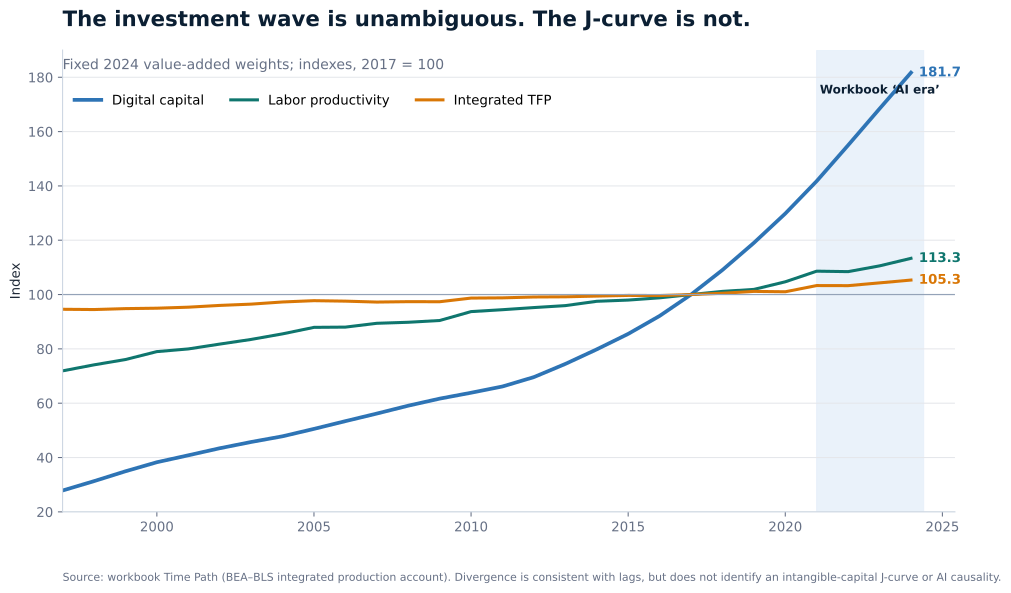
Normalize 2017 to 100 and the visual divergence is immediate. By 2024, digital capital reaches 181.7. Labor productivity reaches 113.3. Integrated TFP reaches 105.3. From 2017 to 2024, those paths imply annualized growth of 8.91%, 1.80%, and 0.75%, respectively.
The pattern is consistent with delayed productivity effects. It does not identify a productivity J-curve. The formal J-curve is a claim about complementary intangible investment: firms divert resources into process redesign, data, training, and organizational capital; measured productivity can fall while an unmeasured stock accumulates, then rise when the stock begins to produce.[3] A widening line chart shows accumulation and timing. It does not observe the complementary stock, the adjustment cost, or the later harvest.
Evidence figure
DescriptiveThe investment wave is unambiguous. The J-curve is not.
Fixed 2024 value-added weights, indexed to 2017. Annotation reveals the timing without animating the lines from zero or implying causality.
Indexed path · 2017 = 100
Inspect the divergence year by year
The domain stays fixed when series are toggled. The shaded interval marks the workbook’s 2021–2024 “AI era”; it is a timing annotation, not a treatment boundary.
Static snapshot: 2024 ends at digital capital 181.7, labor productivity 113.3, and integrated TFP 105.3, with 2017 equal to 100. Enable JavaScript to inspect individual years or toggle series.
- Capital
- 181.7
- Labor productivity
- 113.3
- TFP
- 105.3
Chart summary · Indexed time paths from 1997 to 2024 showing digital capital rising to 181.7 while labor productivity reaches 113.3 and integrated TFP reaches 105.3, with 2017 equal to 100.
View selected years as a table
| Year | Digital capital | TFP | Labor productivity | Gross output | Energy |
|---|---|---|---|---|---|
| 2017 | 100.0 | 100.0 | 100.0 | 100.0 | 100.0 |
| 2021 | 141.8 | 103.3 | 108.6 | 111.2 | 99.2 |
| 2024 | 181.7 | 105.3 | 113.3 | 122.6 | 98.4 |
The disciplined conclusion is therefore narrower than either camp wants. The United States is accumulating the substrate of an AI economy faster than it is demonstrating a durable efficiency dividend. That can be the first half of a J-curve. It can also be capital deepening, pandemic-era utilization, a measurement problem, or a mix of all three. A visual lag is a hypothesis generator, not a causal design.
Section 04
The baseline can reverse the conclusion
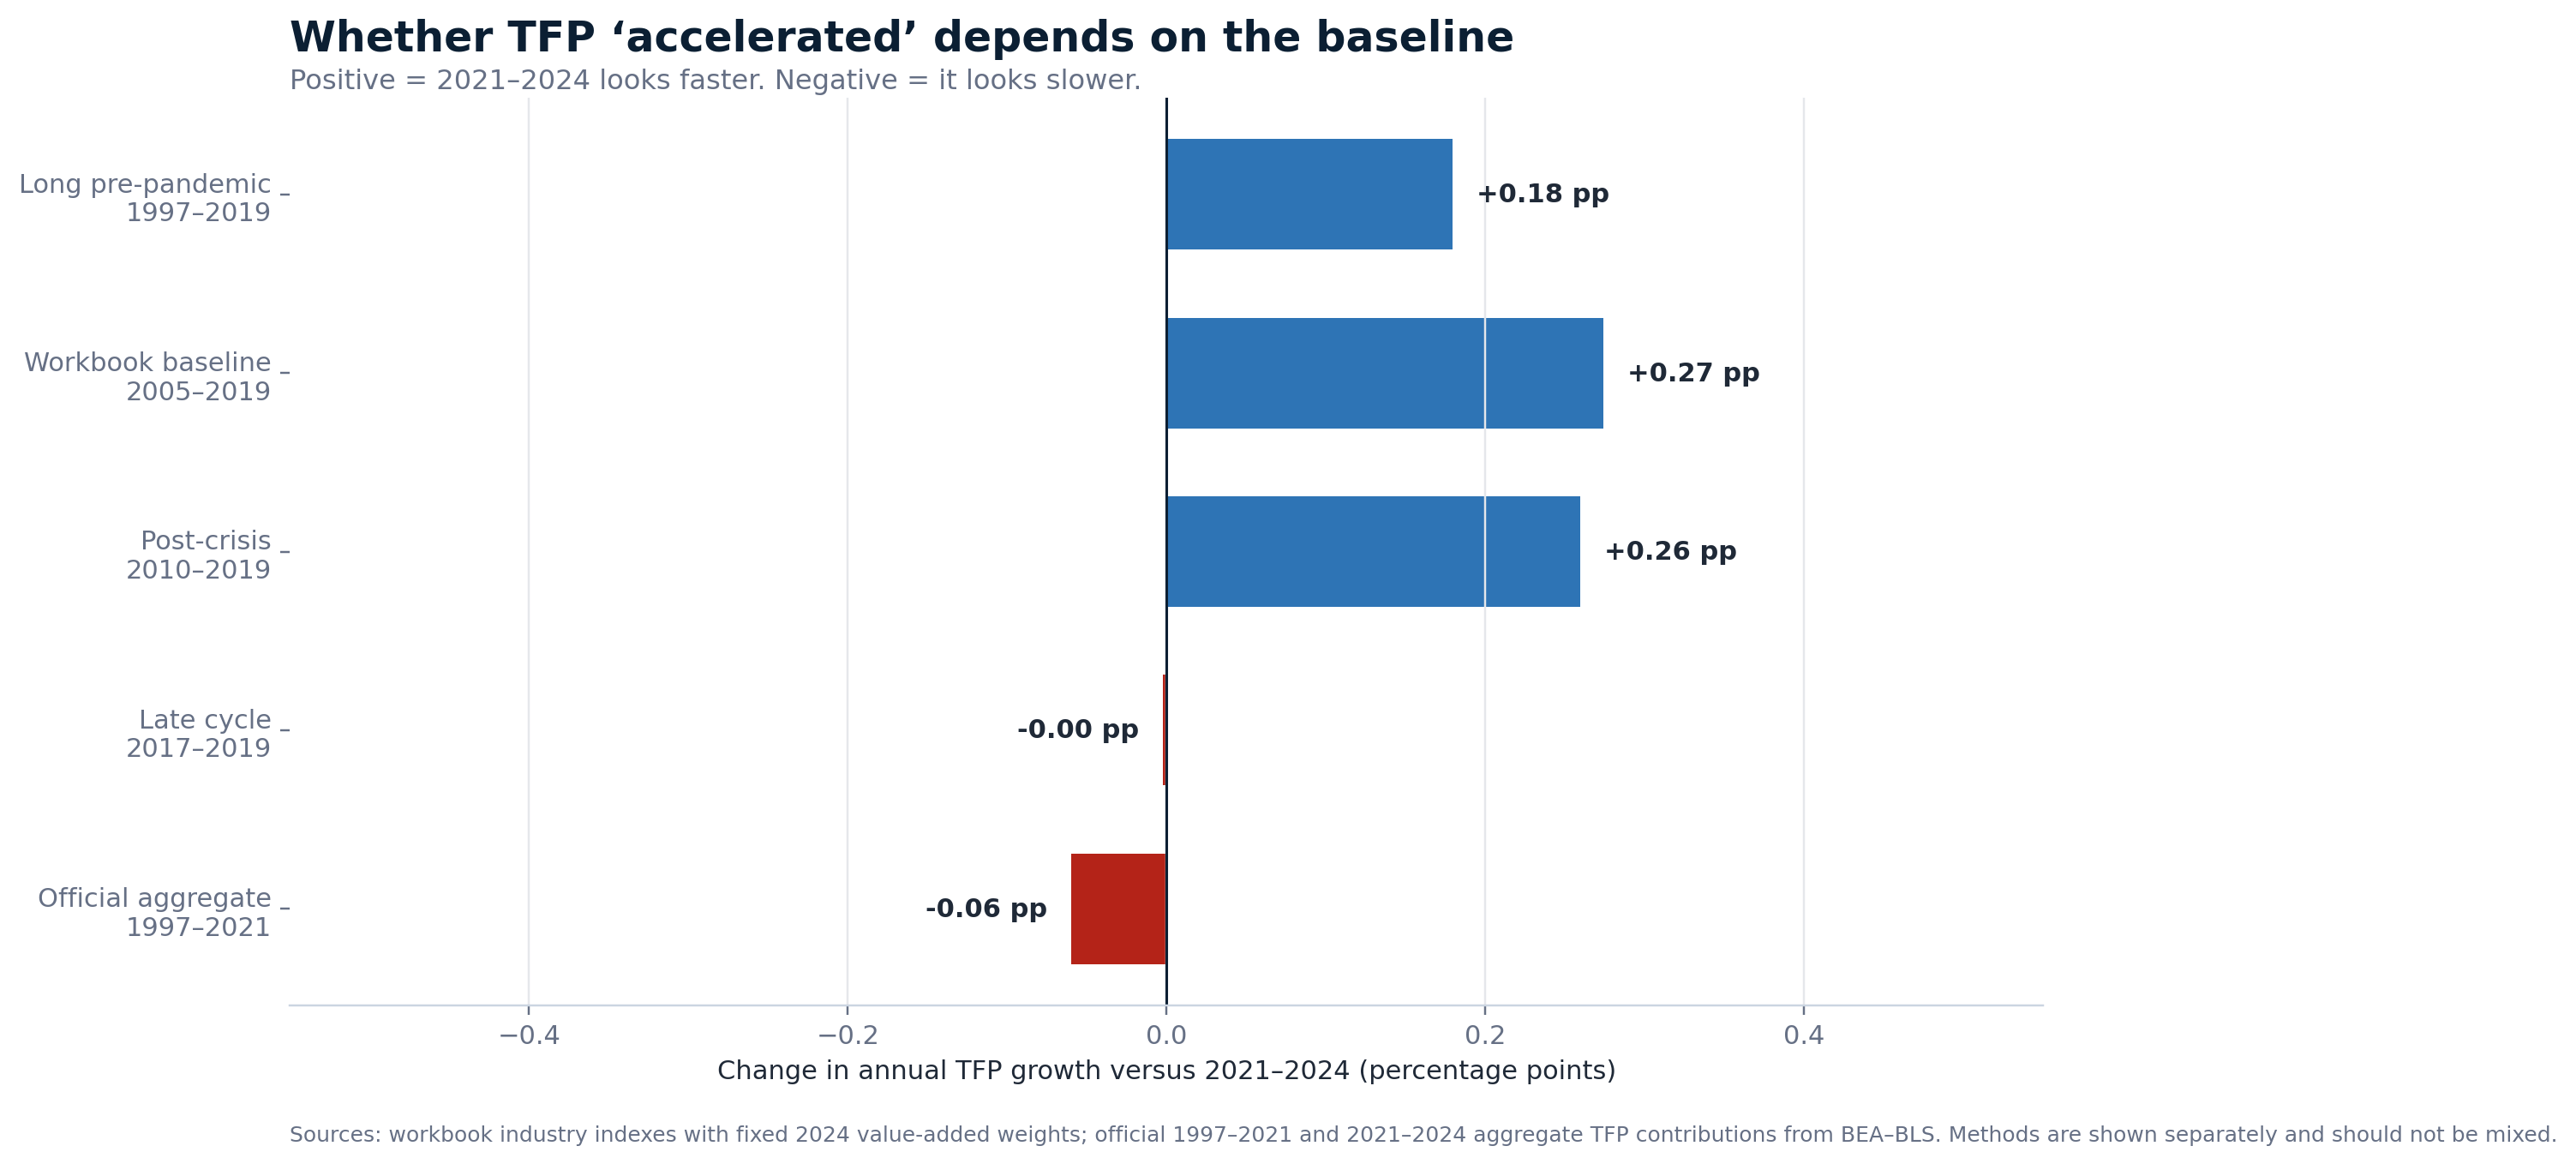
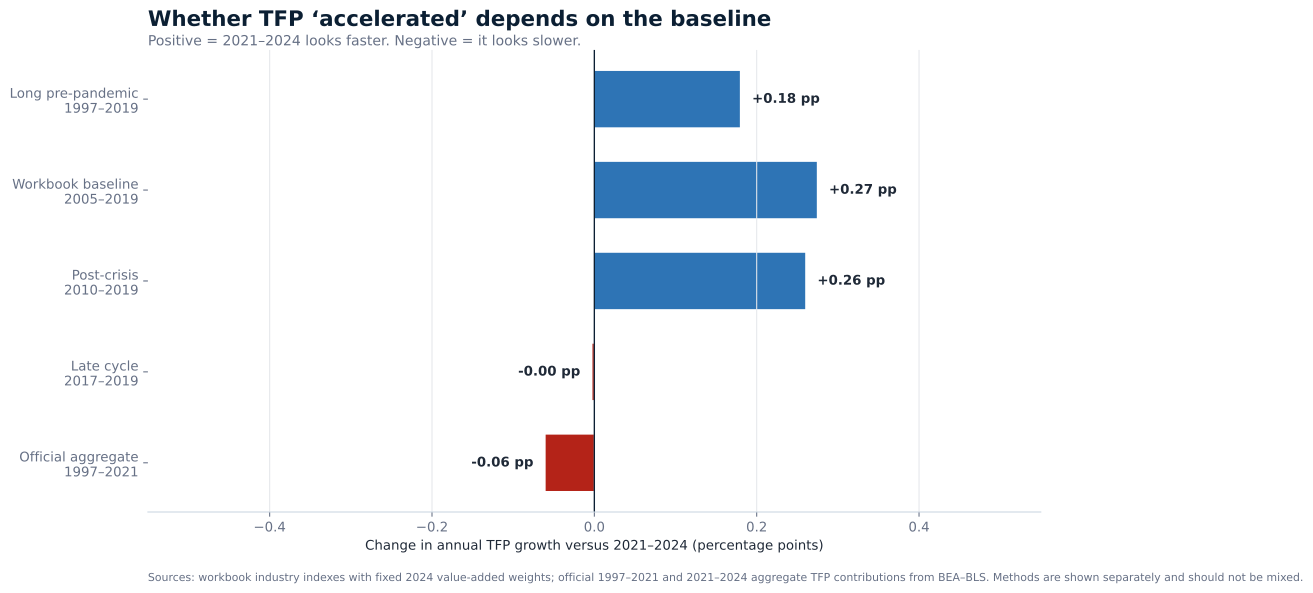
The workbook reports that value-added-weighted TFP growth accelerated from 0.29% in 2005–2019 to 0.57% in 2021–2024, a gain of 0.27 percentage points. The calculation is correct under that definition. It is not invariant to the counterfactual.
Against 1997–2019, the gain is about 0.18 points. Against 2010–2019, it is 0.26. Against the late-cycle years 2017–2019, it is effectively zero. In the separate official aggregate account, TFP contribution falls from 0.66% over 1997–2021 to 0.60% over 2021–2024. Those series should not be spliced together. Their disagreement is the finding: “acceleration” is a methodological choice before it becomes an economic conclusion.
Evidence figure
DescriptiveWhether TFP accelerated depends on the baseline
Positive values make 2021–2024 look faster. The official aggregate is shown separately because its aggregation method differs from the workbook series.
Interactive baseline laboratory
Choose the counterfactual before choosing the headline.
Each button replaces the pre-period while holding the workbook’s 2021–2024 TFP estimate fixed. The calculation is descriptive and uses fixed 2024 value-added weights.
Static comparison: Workbook baseline 2005–2019. The fixed 2021–2024 estimate is shown at right; enable JavaScript to test the other pre-periods.
2021–2024 looks
faster
Baseline TFP
0.29%
2021–2024 TFP
0.57%
Change
+0.27 pp
The signal is positive against long and post-crisis baselines, but disappears against the late cycle. A counterfactual is part of the result—not a footnote attached afterward.
Chart summary · Horizontal bars showing that estimated post-2021 TFP acceleration is positive against long pre-pandemic and post-crisis baselines, approximately zero against 2017 to 2019, and negative in the separate official aggregate comparison.
View every pre-period comparison
| Pre-period | Baseline TFP | 2021–2024 TFP | Change |
|---|---|---|---|
| Long pre-pandemic 1997–2019 | 0.39% | 0.57% | +0.18 pp |
| Workbook baseline 2005–2019 | 0.29% | 0.57% | +0.27 pp |
| Post-crisis 2010–2019 | 0.31% | 0.57% | +0.26 pp |
| Late cycle 2017–2019 | 0.57% | 0.57% | -0.00 pp |
The newest official evidence increases the need for caution. BLS estimates private nonfarm business TFP growth of 0.8% in 2025, down from 1.5% in 2024.[5] Boyle, Fernald, and Li estimate that higher utilization explains much of the recent output-per-hour surge and may account for essentially all measured TFP growth since early 2024 in their framework.[6]Running existing people and capital harder is not the same thing as moving the production frontier.
Section 05
The industry scatter is the result
If fast digital-capital accumulation were already translating reliably into measured technical change, industries with more digital-capital growth should show systematically higher TFP growth. They do not. Across 61 market industries, the Pearson correlation is -0.18, with p = 0.18. The rank correlation is 0.02. The 2024 value-added-weighted correlation is 0.14, and the weighted regression explains only 0.02 of the variance.
An absent slope does not prove an absent effect. Adoption is selected, the window is short, inputs and outputs are measured with error, and industries face different shocks. But it does reject the simplest translation story. The workbook does not contain a stable one-for-one—or even reliably positive—cross-sectional relationship waiting to be named “AI productivity.”
Evidence figure
AssociationalMore digital capital is not reliably associated with faster industry TFP
Bubble area scales with 2024 value added. The 3% threshold is descriptive, and the missing parity line is deliberate: TFP has no reason to equal capital-stock growth.
Interactive · associational evidence
Sixty-one industries. No simple translation function.
Change the exposure proxy, outcome, weighting, and labels. The axes rescale and announce the selected units. Every point remains a cross-sectional association—not an estimate of AI causality.
Static view: endpoint-weighted digital-capital growth against integrated TFP, with 2024 value-added weighting. Chemical products is highlighted; the complete data table remains available below.
Regression slope
0.07
R²
0.02
Chemical products
Fast K + positive TFP- Digital capital
- 5.22%
- TFP
- 0.62%
- Labor productivity
- 1.39%
- Gross output
- 2.43%
- Labor hours
- 1.02%
- 2024 value added
- $548.8bn
View the plotted data table (61 industries)
| Industry | Digital-capital CAGR (%) | Integrated TFP CAGR (%) | Value added ($bn) | Regime |
|---|---|---|---|---|
| Farms | 13.18 | 1.24 | 222.9 | Fast K + positive TFP |
| Forestry, fishing, and related activities | 3.65 | 1.45 | 52.9 | Fast K + positive TFP |
| Oil and gas extraction | 11.03 | 6.59 | 235.4 | Fast K + positive TFP |
| Mining, except oil and gas | 13.25 | -2.60 | 76.7 | Capital race |
| Support activities for mining | 8.10 | 5.73 | 70.6 | Fast K + positive TFP |
| Utilities | 8.46 | 0.16 | 414.9 | Fast K + positive TFP |
| Construction | 9.05 | -1.28 | 1302.4 | Capital race |
| Wood products | 8.38 | 0.50 | 60.0 | Fast K + positive TFP |
| Nonmetallic mineral products | 2.88 | -3.67 | 77.3 | Dormant |
| Primary metals | 2.23 | 2.94 | 76.3 | Other sources |
| Fabricated metal products | 2.72 | -2.63 | 188.8 | Dormant |
| Machinery | 3.13 | -1.67 | 208.3 | Capital race |
| Computer and electronic products | 2.62 | -1.57 | 299.1 | Dormant |
| Electrical equipment, appliances, and components | 3.15 | -2.19 | 80.6 | Capital race |
| Motor vehicles, bodies and trailers, and parts | 4.13 | 0.61 | 185.5 | Fast K + positive TFP |
| Other transportation equipment | 1.74 | 1.19 | 197.1 | Other sources |
| Furniture and related products | -0.09 | -1.25 | 34.4 | Dormant |
| Miscellaneous manufacturing | 3.18 | -1.06 | 113.4 | Capital race |
| Food and beverage and tobacco products | 3.29 | -0.14 | 345.8 | Capital race |
| Textile mills and textile product mills | 7.14 | -0.95 | 16.3 | Capital race |
| Apparel and leather and allied products | 1.23 | 1.24 | 12.4 | Other sources |
| Paper products | 3.25 | -1.39 | 74.3 | Capital race |
| Printing and related support activities | 0.18 | -3.48 | 41.2 | Dormant |
| Petroleum and coal products | 2.26 | 2.24 | 194.3 | Other sources |
| Chemical products | 5.22 | 0.62 | 548.8 | Fast K + positive TFP |
| Plastics and rubber products | 2.11 | -1.74 | 100.4 | Dormant |
| Wholesale trade | 8.90 | -1.92 | 1396.3 | Capital race |
| Retail trade | 12.23 | 3.19 | 1542.0 | Fast K + positive TFP |
| Air transportation | 7.56 | 1.89 | 145.9 | Fast K + positive TFP |
| Rail transportation | 5.89 | -0.76 | 56.7 | Capital race |
| Water transportation | 10.75 | -3.02 | 24.0 | Capital race |
| Truck transportation | 7.11 | -0.77 | 256.7 | Capital race |
| Transit and ground passenger transportation | -3.70 | 5.19 | 82.1 | Other sources |
| Pipeline transportation | 2.34 | -0.51 | 48.4 | Dormant |
| Other transportation and support activities | 10.19 | -1.35 | 215.7 | Capital race |
| Warehousing and storage | 6.99 | -4.10 | 127.8 | Capital race |
| Publishing industries, except internet (includes software) | 11.80 | 1.24 | 441.3 | Fast K + positive TFP |
| Motion picture and sound recording industries | 1.66 | 4.36 | 117.7 | Other sources |
| Broadcasting and telecommunications | 6.98 | -0.83 | 463.2 | Capital race |
| Data processing, internet publishing, and other information services | 16.90 | 2.97 | 526.2 | Fast K + positive TFP |
| Federal Reserve banks, credit intermediation, and related activities | 8.96 | -2.24 | 1009.9 | Capital race |
| Securities, commodity contracts, and investments | 18.12 | 0.52 | 394.3 | Fast K + positive TFP |
| Insurance carriers and related activities | 8.13 | -0.18 | 752.5 | Capital race |
| Funds, trusts, and other financial vehicles | 43.14 | -5.22 | 27.9 | Capital race |
| Real estate | 7.02 | 1.52 | 3712.5 | Fast K + positive TFP |
| Rental and leasing services and lessors of intangible assets | 1.44 | 3.24 | 347.8 | Other sources |
| Legal services | -3.39 | 0.10 | 366.3 | Other sources |
| Computer systems design and related services | 8.18 | 4.05 | 513.1 | Fast K + positive TFP |
| Miscellaneous professional, scientific, and technical services | 7.58 | 0.87 | 1435.1 | Fast K + positive TFP |
| Management of companies and enterprises | 6.62 | 2.03 | 542.2 | Fast K + positive TFP |
| Administrative and support services | 9.00 | 0.48 | 813.3 | Fast K + positive TFP |
| Waste management and remediation services | 9.10 | -2.21 | 85.8 | Capital race |
| Educational services | 5.69 | 1.21 | 333.4 | Fast K + positive TFP |
| Ambulatory health care services | 9.55 | 2.08 | 1076.3 | Fast K + positive TFP |
| Hospitals and nursing and residential care facilities | 4.77 | -0.24 | 894.4 | Capital race |
| Social assistance | 9.54 | 1.08 | 224.6 | Fast K + positive TFP |
| Performing arts, spectator sports, museums, and related activities | 10.05 | 1.71 | 183.9 | Fast K + positive TFP |
| Amusements, gambling, and recreation industries | 10.70 | -0.32 | 112.7 | Capital race |
| Accommodation | 6.30 | 0.15 | 218.5 | Fast K + positive TFP |
| Food services and drinking places | 7.91 | -0.53 | 620.1 | Capital race |
| Other services, except government | 7.11 | -1.86 | 606.8 | Capital race |
Chart summary · Bubble scatter plot of 61 market industries showing no robust relationship between digital-capital growth and integrated TFP growth from 2021 to 2024.
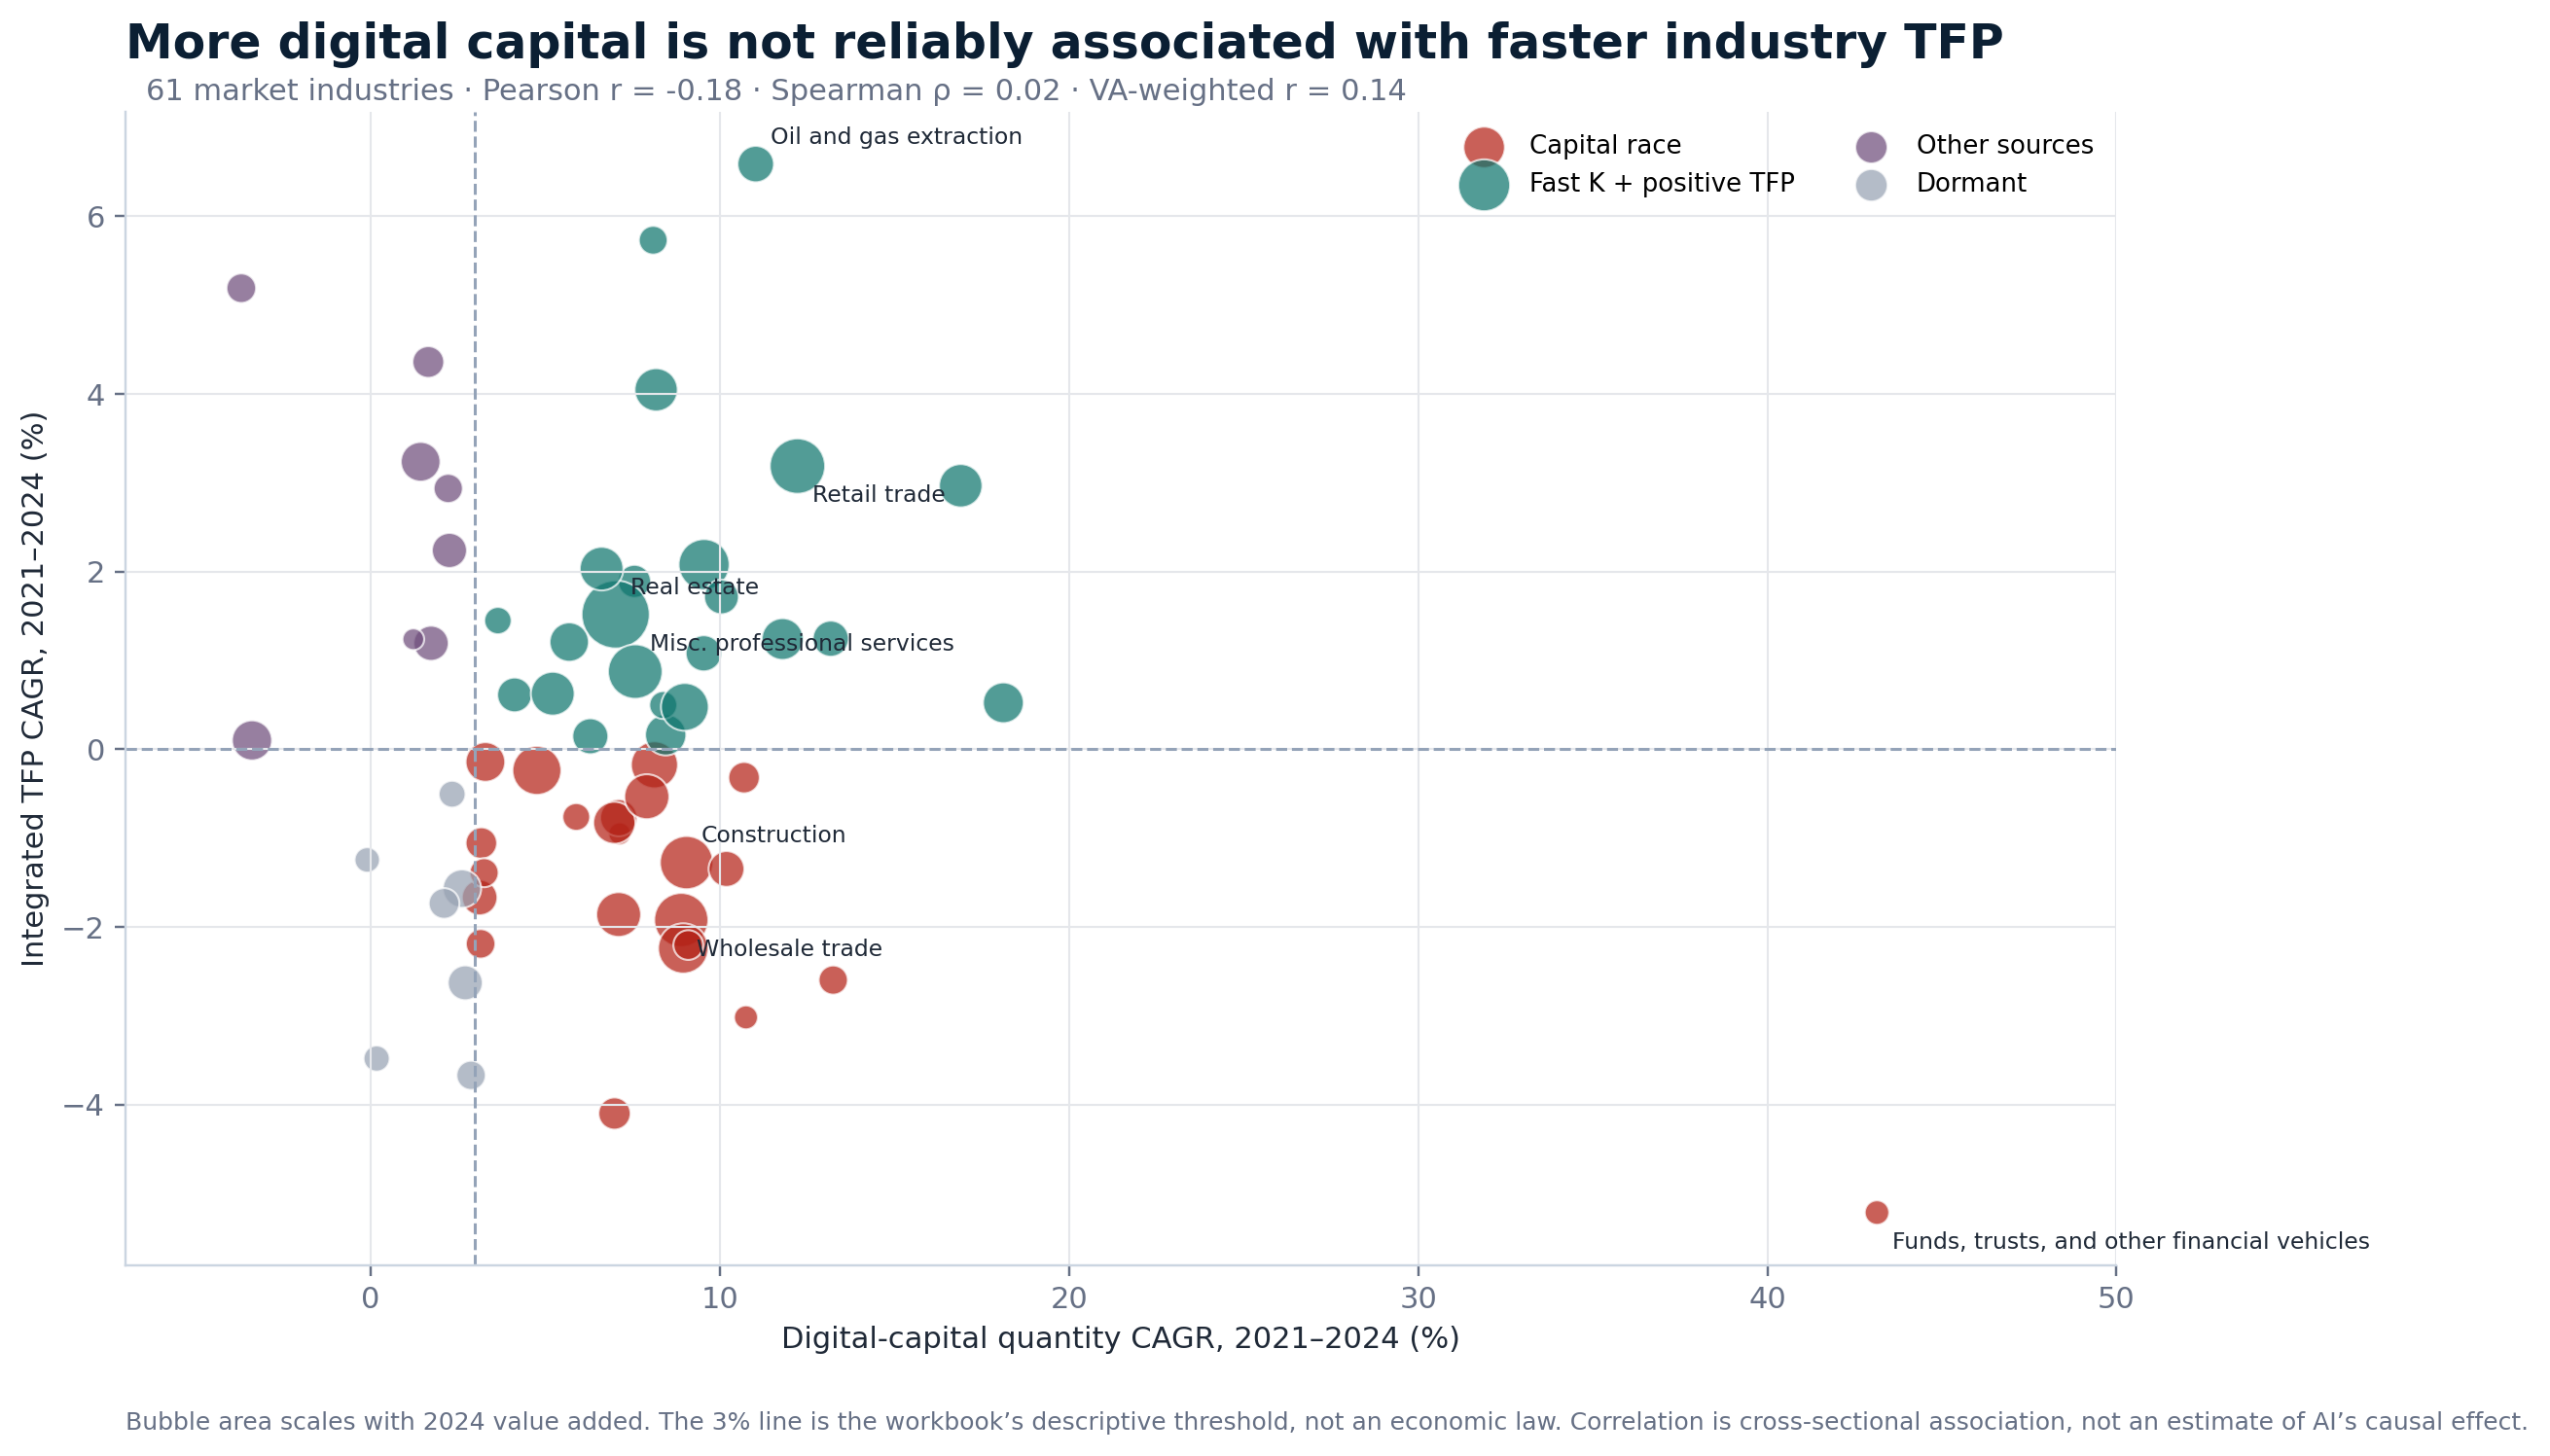
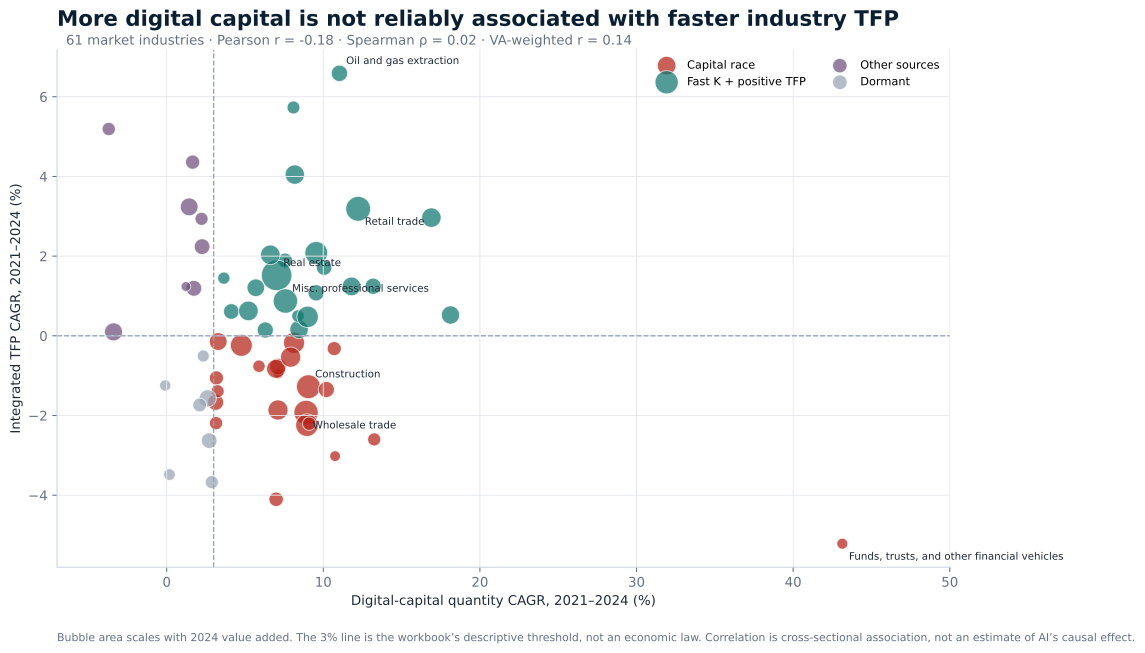
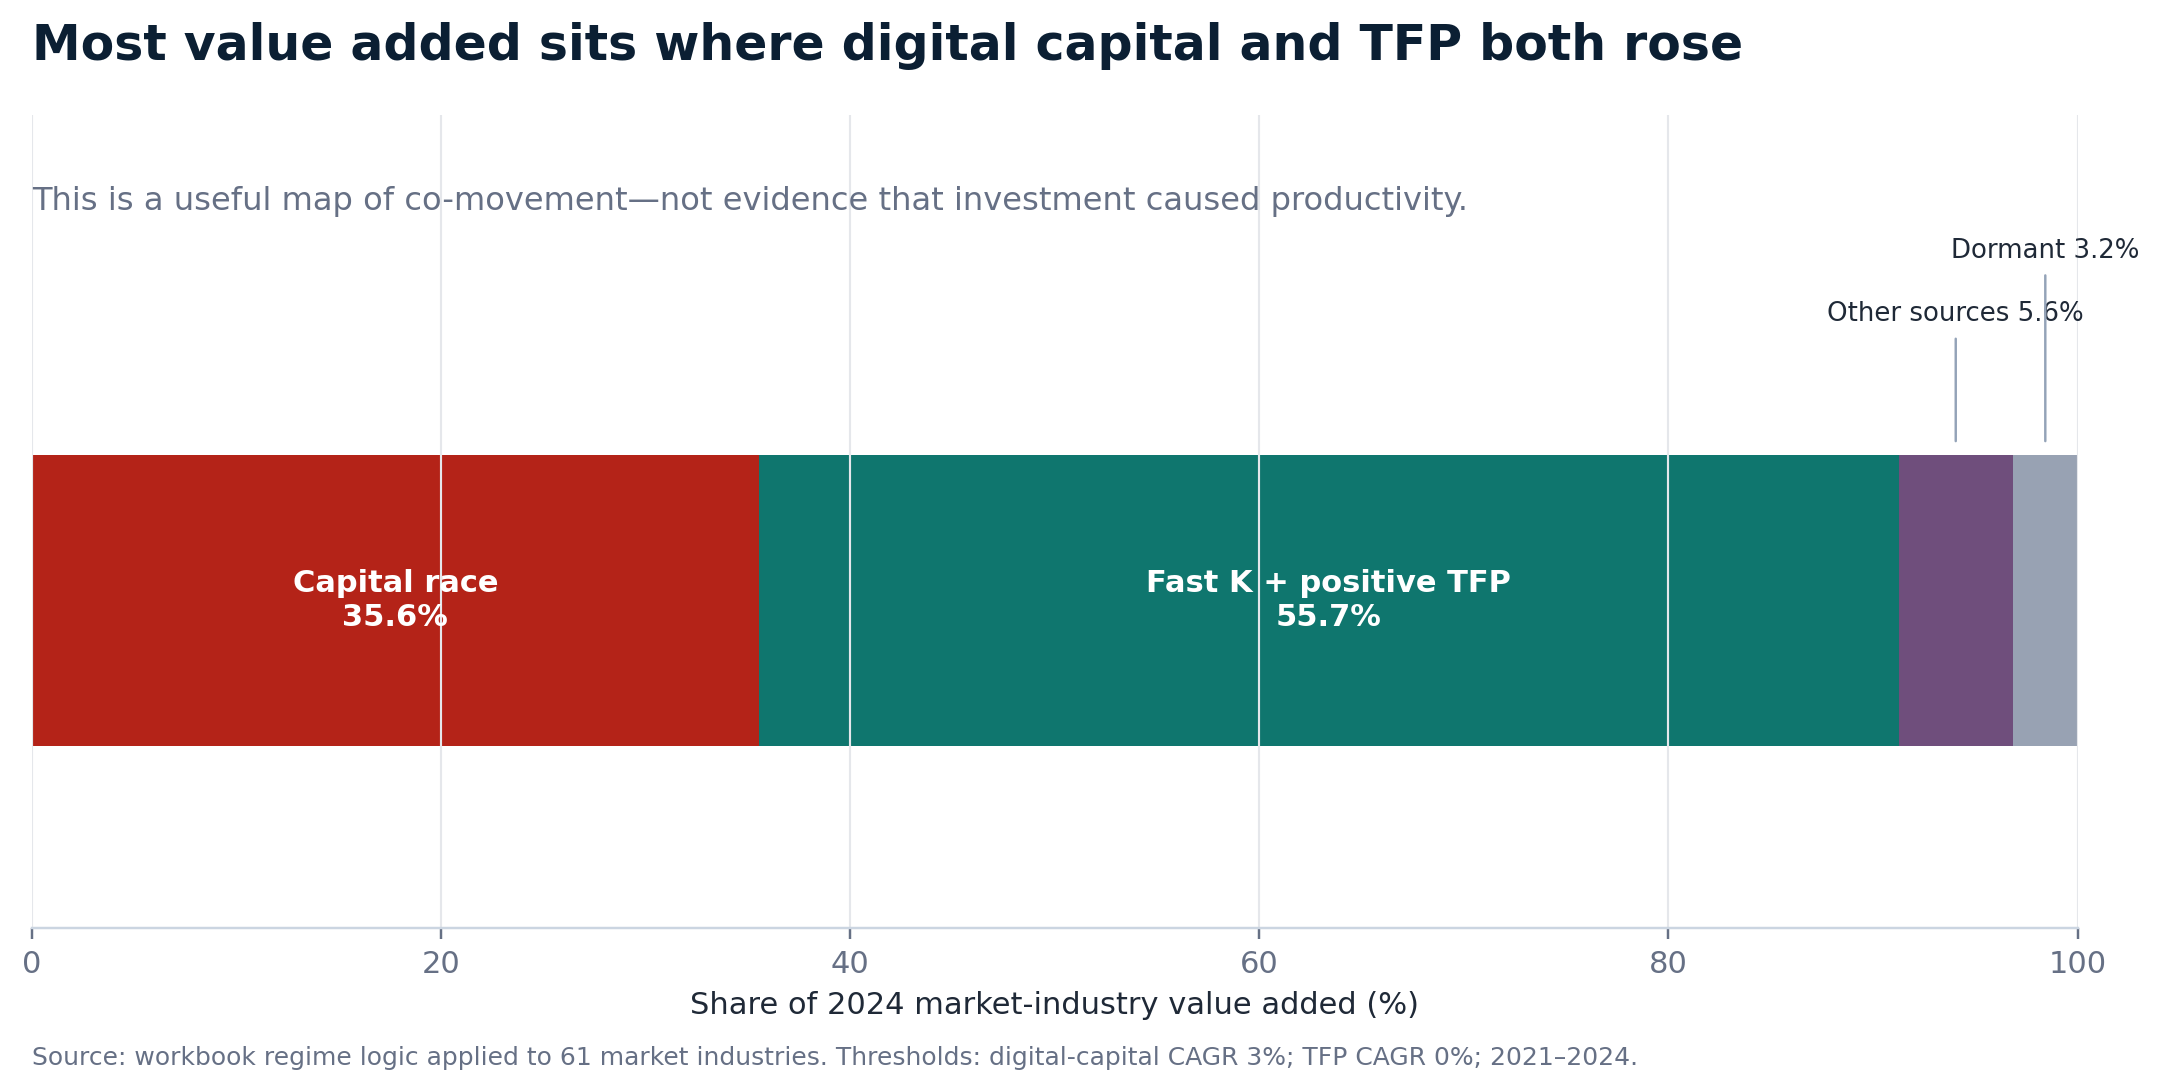
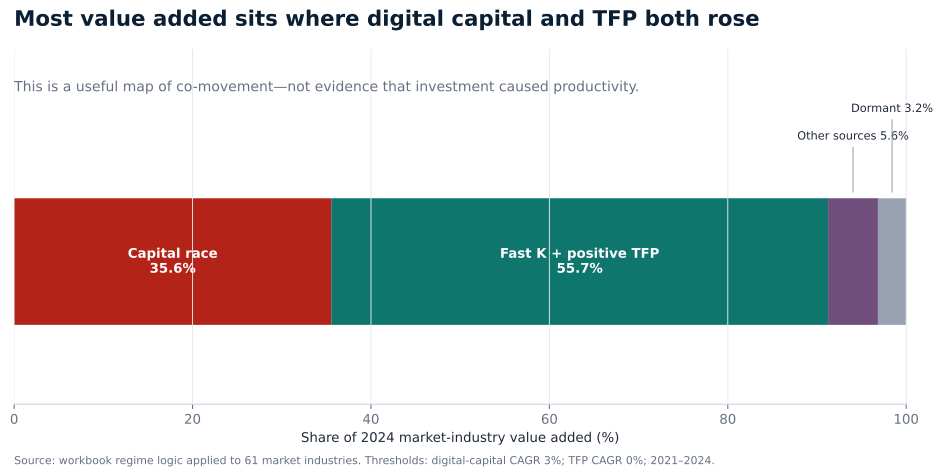
The regime map reveals why co-movement and a weak slope can coexist. Industries with digital-capital growth of at least 3% and positive TFP account for 55.7% of market value added. The “capital race”—fast digital capital with negative TFP—accounts for 35.6%. The remaining 8.8% sits in slower-capital regimes. Large industries can dominate the positive-positive quadrant while variation within and across the other quadrants destroys a stable linear relationship.
Evidence figure
AssociationalMost value added sits where digital capital and TFP both rose
A useful map of co-movement, not evidence that investment caused productivity. Each category is defined by transparent descriptive thresholds.
Value-added map · descriptive thresholds
Four regimes, one weak cross-industry slope
The cards classify co-movement; their area is not scaled. The bar below restores economic weight by showing each regime’s share of 2024 market-industry value added.
Fast K + positive TFP
Fast capital · positive TFP
55.7%
- Industries
- 23
- Value added
- $13.89tn
Capital race
Fast capital · negative TFP
35.6%
- Industries
- 23
- Value added
- $8.87tn
Other sources
Slow capital · positive TFP
5.6%
- Industries
- 8
- Value added
- $1.39tn
Dormant
Slow capital · negative TFP
3.2%
- Industries
- 7
- Value added
- $0.79tn
Share of 2024 market value added
The economy is concentrated in the two fast-capital regimes.
- Fast K + positive TFP · 55.7%
- Capital race · 35.6%
- Other sources · 5.6%
- Dormant · 3.2%
Chart summary · Stacked value-added shares showing 55.7 percent in industries with fast digital capital and positive TFP, 35.6 percent in the capital-race regime, 5.6 percent in other sources, and 3.2 percent dormant.
View regime counts and value-added shares
| Regime | Industries | 2024 value added | Share |
|---|---|---|---|
| Capital race | 23 | $8.87tn | 35.6% |
| Fast K + positive TFP | 23 | $13.89tn | 55.7% |
| Other sources | 8 | $1.39tn | 5.6% |
| Dormant | 7 | $0.79tn | 3.2% |
Section 06
The chemical-products lens: constructive, not causal
Chemical products sit in the positive-positive quadrant. From 2021 to 2024, the workbook reports digital-capital growth of 5.22%, TFP growth of 0.62%, labor-productivity growth of 1.39%, gross-output growth of 2.43%, and hours growth of 1.02%. The Törnqvist sensitivity measure for digital capital is nearly identical at 5.21%.
Sector lens · 2021–2024
$548.8bn
2024 industry value added
Fast K + positive TFP| Variable | CAGR | Interpretation |
|---|---|---|
| Digital capital | 5.22% | AI-adjacent capital proxy |
| Integrated TFP | 0.62% | Residual technical-change measure |
| Labor productivity | 1.39% | Output per labor input |
| Gross output | 2.43% | Industry production including intermediates |
| Labor hours | 1.02% | Input utilization |
This is constructive co-movement, not AI attribution. Chemical production combines process automation, scientific R&D, enterprise software, capacity utilization, energy shocks, product-mix changes, regulation, and long validation cycles. A quadrant cannot identify which mechanism did the work. It can identify the next research design: follow model suggestions into experiments, validated results, process changes, plant throughput, quality, energy use, and saleable output.
The sector also demonstrates why organizational complements become physical. A model can generate a molecule or operating recommendation quickly. Wet-lab capacity, safety review, regulatory acceptance, shutdown windows, control-system integration, and customer qualification remain slow. The machine makes one stage abundant and reveals the scarcity of the rest.
Section 07
The bottleneck has moved downstream
AI lowers the marginal cost of producing a cognitive intermediate. Firms do not sell intermediates. They sell verified, integrated, compliant, discoverable, and demanded products and services. The relevant production process is therefore a chain, and the chain is governed by complements.
The translation production function
The frontier model is getting cheaper. The organization is not.
KAI
AI capital
Compute, models, data, services
Corg
Complements
Skills, workflows, controls, decision rights
Oflow
Operational flow
Review, integration, exceptions, recovery
Yship
Shipped output
Release, adoption, quality, demand
A*
Frontier shift
Persistence beyond utilization and mix
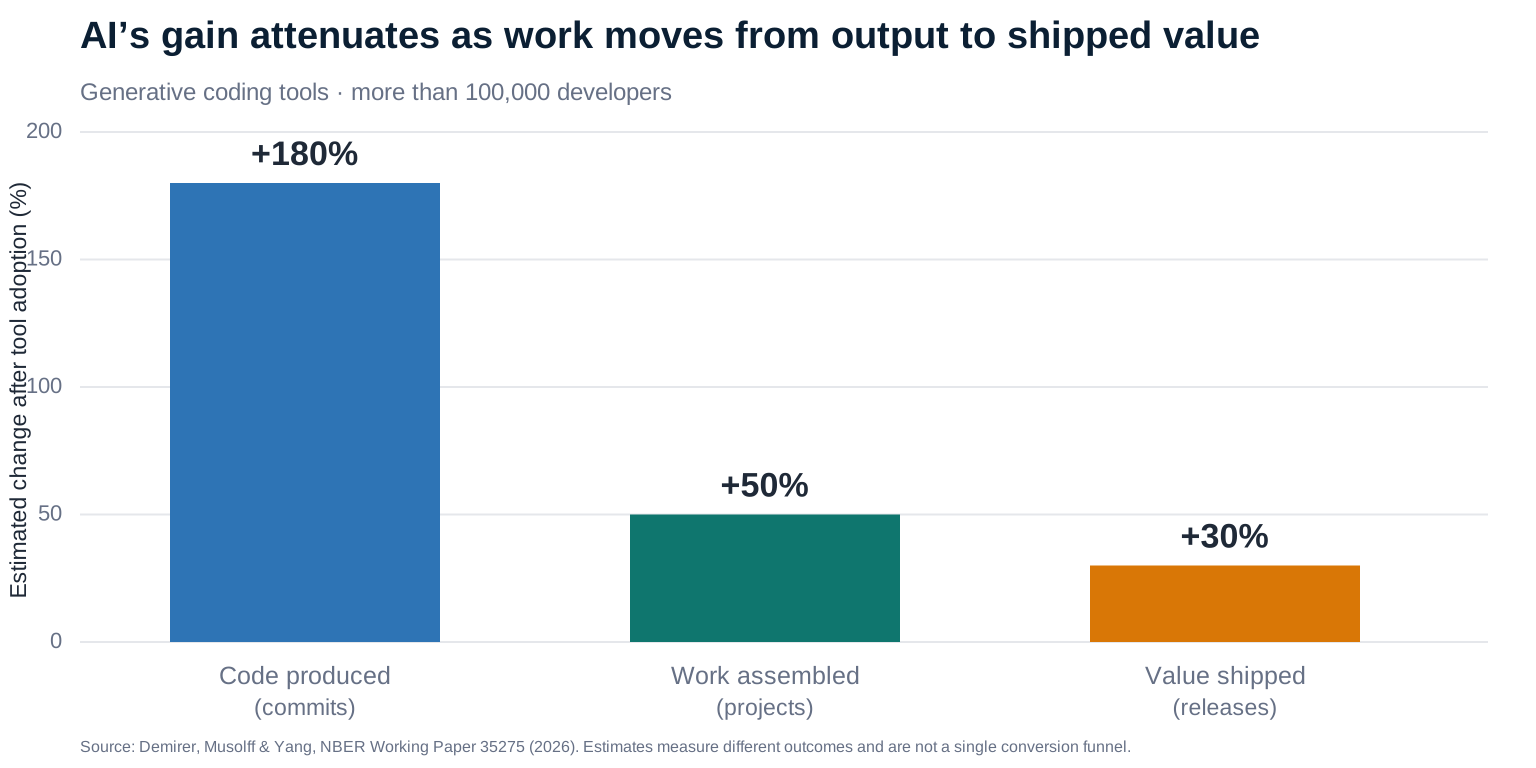
Software development makes the attenuation visible because its production stages are unusually observable. A 2026 study of more than 100,000 developers estimates that successive generations of AI coding tools increased commits cumulatively by 180%. The gain fell to 50% for projects and 30% for releases, with no detectable increase in total app usage.[9] The output did not vanish. It queued at review, integration, testing, release, product judgment, and demand. The estimates describe observed adopters and production stages; they should not be generalized to every developer, firm, or workflow without accounting for selection into tool use.
Evidence figure
CausalAI’s gain attenuates as work moves from output to shipped value
The three estimates describe different production outcomes, not a literal conversion funnel. Usage remains a separate endpoint because no precisely comparable bar is identified.
Production hierarchy · causal estimates
Generation scales faster than the system around it
Each row is a separate estimated outcome after coding-tool adoption—not a literal conversion rate. The queue label names the next constraint exposed as work moves downstream.
Code produced (commits)
Next queue · Review and integration
Estimated change+180%Work assembled (projects)
Next queue · Testing and release coordination
Estimated change+50%Value shipped (releases)
Next queue · Adoption, attention, and customer value
Estimated change+30%Total app usage
Next queue · Demand realization
Estimated changeNo detectable increase
Code became abundant
The largest measured gain appears at the narrowest production stage.
Coordination stayed scarce
Review, integration, testing, and release absorb the new output.
Demand is a separate test
More shipped artifacts do not guarantee more usage or customer value.
Chart summary · Bars showing estimated AI coding-tool effects attenuating from 180 percent for commits to 50 percent for projects and 30 percent for releases.
View the estimates and downstream constraints
| Stage | Estimated effect | What becomes scarce next |
|---|---|---|
| Code produced (commits) | +180% | Review and integration |
| Work assembled (projects) | +50% | Testing and release coordination |
| Value shipped (releases) | +30% | Adoption, attention, and customer value |
| Total app usage | No detectable increase | Demand realization |
Firm evidence shows the same wedge in a different account. A 2026 survey of nearly 750 corporate executives finds that AI-investing firms report labor-productivity gains 2.4 percentage points higher than non-investors in 2025, while the gain implied by revenue and employment is only 1.0 point higher.[8] The difference may contain expected quality, future revenue, intermediate-input changes, markups, accounting timing, and attribution bias—not organizational friction alone. It is evidence that experienced capability and measured output are not the same object.
Industrial microdata add the mechanism. Census-linked research presented at the 2026 AEA meeting finds causal J-curves in manufacturing: short-run productivity and profit losses followed by longer-run gains, with worse initial outcomes among older establishments. Growth-oriented strategy and within-firm spillovers mitigate the losses; abandoning structured production-management practices explains a meaningful share of the short-run damage among older plants.[10]
Section 08
From the Solow residual to the translation residual
The classic Solow residual asks how much output growth remains after measured capital and labor have been accounted for. The machine economy needs a second residual: how much of demonstrated model capability survives the passage through the organization?
Capability × task coverage × adoption intensity × workflow integration × demand realization. This is a diagnostic identity, not a calibrated production function.
Each term lies between zero and one. If a model doubles performance on the covered task, but only half the workflow is covered, half the workforce uses it, integration captures half the potential, and customers value half the additional output, the realized effect is 6.25% before equilibrium feedbacks. The arithmetic is not a forecast. It is a guardrail against additive thinking.
The translation residual reconciles facts that look inconsistent only when the stages are collapsed: spectacular benchmark gains, rapid digital-capital accumulation, modest firm-level outcomes, and ambiguous aggregate TFP. All four can be true if the cheap stage expands faster than the scarce stages around it.
Section 09
Measure the queue, not only the machine
The next AI dashboard should stop asking whether “AI productivity” has arrived as one number. It should follow the translation chain. At each stage, measure one outcome and one queue. The outcome shows what moved. The queue shows where the bottleneck migrated.
Capital requires share-weighted contributions and full service cost, not licence counts alone. Complements require redesigned-workflow coverage and the training or data backlog. Operational flow requires end-to-end cycle time and review wait. Shipped output requires quality-adjusted revenue, releases, experiments, or operational completion. A frontier shift requires utilization adjustment, persistence, and survival through model migration.
Interactive diagnostic
Audit the translation chain.
Classify the evidence at each stage. The result is deliberately not a vanity score. It names the least observed link—the place where capability can disappear without appearing in the dashboard.
Current diagnosis
Weakest evidence: Shipped output + Durable productivity
Stop at the customer outcome—not the generated artifact. Only 1 of 5 stages currently has measured evidence.
The scorecard deliberately refuses to compress five weakly measured stages into one attractive percentage. A measured capital input beside anecdotal workflow evidence is not “60% ready.” It is a specific diagnosis: the organization knows what it bought and does not yet know what changed. The next investment should follow that diagnosis.
In software, trace prompt to code, code to pull request, pull request to release, and release to usage. In chemicals, trace suggestion to experiment, experiment to validated result, result to process change, process change to throughput, and throughput to saleable output. At every transition, record machine cost, human effort, rejection, rework, delay, error severity, and final acceptance. A local gain that disappears downstream is not a null. It has identified the weak link.
Section 10
What the newest macro evidence actually permits
The 2025–2026 evidence strengthens the accumulation story while complicating the productivity story. BLS estimates private-business software investment growth of 11.1% a year from 2019 to 2024, faster than R&D at 5.2%.[4] The St. Louis Fed estimates that information-processing equipment, software, R&D, and data centers contributed 0.97 percentage points—39%—of real GDP growth in the first nine months of 2025.[7] The contribution then fell as investment growth slowed. A high capital level is not a continuing growth contribution.
At the same time, official TFP growth slowed in 2025, utilization-adjusted research warns that recent measured productivity may reflect intensity more than efficiency, firm surveys find positive but modest realized gains, and industrial microdata find genuine J-curves conditional on age, strategy, spillovers, and management practice. These results are not mutually exclusive. They occupy different points in the translation chain.
That synthesis is more demanding than “AI is everywhere except the statistics” and more defensible than “the productivity boom has arrived.” It treats accumulation as observed, association as weak, causation as local where identified, and aggregate projection as conditional. The evidence becomes useful precisely when it is prevented from saying more than it knows.
Reproducibility · variables · downloads
How the analysis was constructed
The reconstruction reads cached values from the integrated BEA–BLS workbook, calculates 2021–2024 industry CAGRs, excludes two government industries from market aggregates, and uses 2024 value added as a transparent fixed weight. The digital bundle combines software, R&D, and IT. A Törnqvist-style sensitivity index replaces endpoint shares with adjacent-period average shares. Official contribution data are kept in a separate panel and never spliced into the fixed-weight industry index.
1
Reconstruct
Load 63 industry series for capital quantities, compensation, output, hours, value added, and productivity.
2
Transform
Compute CAGRs, endpoint-weighted and Törnqvist digital indexes, contribution proxies, and 2024 weights.
3
Stress-test
Change pre-periods, compare weighting methods, separate official aggregates, and keep government selectable.
4
Associate
Estimate Pearson, rank, weighted correlation, and weighted regression without causal interpretation.
5
Diagnose
Map regimes and trace the chemical-products row without turning quadrant membership into attribution.
6
Publish
Validate row counts and representative values, hash sources, and generate typed JSON plus downloadable tables.
Variable dictionary
| Web variable | Source column | Unit | Definition | Caution |
|---|---|---|---|---|
| industry | industry | BEA–BLS industry title | Industry classification used in the integrated production account. | The analysis uses industry aggregates, not firms or establishments. |
| tfpCagr | tfp_cagr | annual decimal growth rate | CAGR of the integrated BEA–BLS total factor productivity index. | A residual containing efficiency, utilization, quality, markups, and measurement error. |
| softwareCagr | software_cagr | annual decimal growth rate | CAGR of the software-capital quantity index. | Includes conventional software and is not a generative-AI adoption measure. |
| rdCagr | rd_cagr | annual decimal growth rate | CAGR of the research-and-development capital quantity index. | R&D contains non-AI research and can be zero or imputed in some industries. |
| itCagr | it_cagr | annual decimal growth rate | CAGR of the information-technology equipment quantity index. | Hardware quantity is AI-adjacent but neither necessary nor sufficient for productive AI use. |
| otherCapitalCagr | other_cagr | annual decimal growth rate | CAGR of capital quantities outside software, R&D, IT, and artistic originals. | Used as context, not as part of the digital-capital bundle. |
| energyCagr | energy_cagr | annual decimal growth rate | CAGR of the industry energy-input quantity index. | Quantity changes can reflect technology, prices, output mix, and cyclical utilization. |
| grossOutputCagr | gross_output_cagr | annual decimal growth rate | CAGR of the industry gross-output quantity index. | Gross output includes intermediate production and is not value added. |
| hoursCagr | hours_cagr | annual decimal growth rate | CAGR of labor hours. | Changes in utilization and labor composition can affect productivity measures. |
| laborProductivityCagr | labor_productivity_cagr | annual decimal growth rate | CAGR of integrated labor productivity. | Can rise through capital deepening or hours changes without a frontier shift. |
| digitalEndpointCagr | digital_endpoint_cagr | annual decimal growth rate | Software, R&D, and IT quantity-index CAGRs combined with each industry’s 2024 within-bundle compensation shares. | AI-adjacent proxy; not direct AI investment or adoption. |
| digitalTornqvistCagr | digital_tornqvist_cagr | annual decimal growth rate | Chain-weighted digital-capital growth using adjacent-period average compensation shares. | Preferred sensitivity measure; still an AI-adjacent proxy. |
| digitalContributionProxy | digital_contribution_proxy | annual decimal contribution | Approximate share-weighted contribution of software, R&D, and IT capital to value-added growth. | Industry-level approximation; official aggregate contributions remain separate. |
| valueAddedEnd | value_added_end | millions of current U.S. dollars | Industry value added in the final year of the selected analysis window. | For the published 2021–2024 window this equals valueAdded2024. |
| valueAdded2024 | value_added_2024 | millions of current U.S. dollars | Industry value added in 2024, used as the descriptive aggregation weight. | Fixed endpoint weights differ from official KLEMS aggregation and Domar weights. |
| market | market | Boolean | True for the 61 industries included in market aggregates. | Federal and State and local government are retained in the data but excluded by default. |
| tfpAccelerationVs2005To2019 | tfp_accel_vs_2005_2019 | annual decimal-point change | Industry 2021–2024 TFP CAGR minus its 2005–2019 TFP CAGR. | Acceleration changes when the counterfactual window changes. |
| digitalShareCapitalCompensation2024 | digital_share_capital_comp_2024 | decimal share | Software, R&D, and IT compensation as a share of measured 2024 capital compensation. | A compensation share, not the share of output caused by AI. |
| regime | regime | descriptive category | Four-way map using a 3% digital-capital-growth threshold and a 0% TFP-growth threshold. | A co-movement taxonomy, not a causal treatment classification. |
Conclusion
The new Solow test
Solow taught economics not to confuse capital accumulation with technical change. The machine age adds one more distinction: do not confuse technical capability with economic throughput. The token is not the factor. The raw growth rate is not the contribution. The quadrant is not the treatment effect. And the benchmark is not the customer outcome.
The decisive variable sits around the model: the data that make an answer relevant, the workflow that verifies it, the manager who changes decision rights, the engineer who integrates it, the regulator who accepts it, the customer who values it, and the capital market willing to finance the transition. AI will appear cleanly in productivity when those complements stop behaving like adjustment costs and start behaving like a productive stock.
Until then, the most useful question is not whether the machine became more capable. It plainly did. The question is where the gain stopped.
Which constraint became binding after AI made the previous one cheaper?
Linked bibliography
References
Research cut-off: 5 August 2026. Official statistical sources, peer-reviewed work, working papers, and conference evidence are labeled so the reader can distinguish maturity from relevance.
- 1
U.S. Bureau of Economic Analysis & Bureau of Labor Statistics (2026).
Integrated Industry-Level Production Account for the United States. 1997–2024 release, 27 April 2026.
- 2
U.S. Bureau of Economic Analysis (2026).
How Does AI Drive Growth? Explore Our Integrated Industry-Level Production Stats. BEA blog, 8 June 2026.
- 3
Brynjolfsson, Erik; Rock, Daniel & Syverson, Chad (2021).
The Productivity J-Curve. American Economic Journal: Macroeconomics, 13(1).
- 4
U.S. Bureau of Labor Statistics (2026).
AI and the Rise of Software Investment. Monthly Labor Review, May 2026.
- 5
U.S. Bureau of Labor Statistics (2026).
Total Factor Productivity, 2025. Productivity release, 19 March 2026.
- 6
Boyle, Shane; Fernald, John & Li, Huiyu (2026).
Higher Utilisation Explains the Recent Surge in Productivity Growth. CEPR / VoxEU, 16 July 2026.
Research noteSource - 7
Rubinton, Hannah & Patro, Nida (2026).
Tracking AI’s Contribution to GDP Growth. Federal Reserve Bank of St. Louis, 12 January 2026.
- 8
Baslandze, Salomé et al. (2026).
Artificial Intelligence, Productivity, and the Workforce. NBER Working Paper 34984.
Working paperSource - 9
Demirer, Mert; Musolff, Leon & Yang, Liyuan (2026).
Writing Code vs. Shipping Code: Productivity Effects Across Generations of AI Coding Tools. NBER Working Paper 35275.
Working paperSource - 10
McElheran, Kristina; Yang, Yujia; Kroff, Zachary & Brynjolfsson, Erik (2026).
The Rise of Industrial AI in America: Microfoundations of the Productivity J-curve(s). AEA Annual Meeting programme.
Conference paperSource