Executive synthesis
What did ten dollars actually buy?
In 2013, publishing Peeling the Onion was its own engineering project. The research was one problem; turning it into a stable artifact was another. A local LaTeX editor, MiKTeX, a 1,400-line source file, separate graph builds, hand-tuned crop coordinates, repeated compilation, and manual page inspection turned the production layer into days of serial work.
Thirteen years later, the scientific content had not expired. The publication system had. The goal of the modernization was therefore not to summarize, rewrite, or update the findings. It was to preserve the complete historical paper while rebuilding its interface, chart language, navigation, encoding, compatibility layer, and clean-build path.
The main agent run took 63m 35s of net execution and recorded 1,537,712 tokens. Applying GitHub’s public model rates to that telemetry yields a strict output-only floor near $3, a cache-read case just under $4, and a conservative fresh-input case of $11.10. That is why the headline says about $10, not $10.00.
Section 01
How writing worked in 2013: MiKTeX, an IDE, and days of assembly
The PDF metadata is a small time capsule: MiKTeX pdfTeX 1.40.12, created on 21 March 2013. The source used Windows-1252 encoding and early-2010s packages. The manuscript, bibliography, floating logic, labels, and compatibility choices were tightly coupled in one file; the charts lived in separate builds and arrived through crop coordinates that worked until they did not.
The old workflow was not irrational. It was the normal bargain of the time: the author paid the fixed cost of understanding the entire publication stack, then carried that knowledge from edit to edit. The expensive resource was not computer time. It was concentrated human attention repeatedly spent on low-level coordination.
| Layer | 2013 production system | 2026 production system |
|---|---|---|
| Source | One 1,400-line LaTeX file in Windows-1252 | Canonical legacy source imported non-destructively |
| Toolchain | Local editor + MiKTeX pdfTeX 1.40.12 | LuaLaTeX + deterministic UTF-8 import layer |
| Charts | Separate figure builds and hand-coded crop coordinates | Normalized chart data, common semantics, repeatable rendering |
| Debugging | Read log, locate error, edit, compile, inspect, repeat | Agent edits, builds, retries, page rasterization, visual QA |
| Coordination | Human memory carried every dependency and prior choice | Large working context carried files, decisions, diagnostics, and state |
| Elapsed production work | Days of publication engineering | 63m 35s net agent time for the main modernization run |
That distinction matters. The authors still own the empirical idea, data work, equations, and interpretation. The 2026 system inherited those irreversible scientific investments. What changed was the cost of translating a valuable but brittle source into a maintainable, inspectable artifact.
Section 02
The science stayed. The production system changed.
Preservation and redesign are not opposites. The edition retains both executive summaries, the abstract, substantive sections, equations, country analyses, regression tables, references, and appendices. The transformation is architectural: a deterministic import boundary, modern typography, accessible chart semantics, stronger hierarchy, and rendered-page quality assurance.
Interactive document curtain
Drag thirteen years across the page.
The scientific object is held fixed. The comparison isolates the production system around it: hierarchy, scale, chart semantics, navigation, and editorial rhythm.
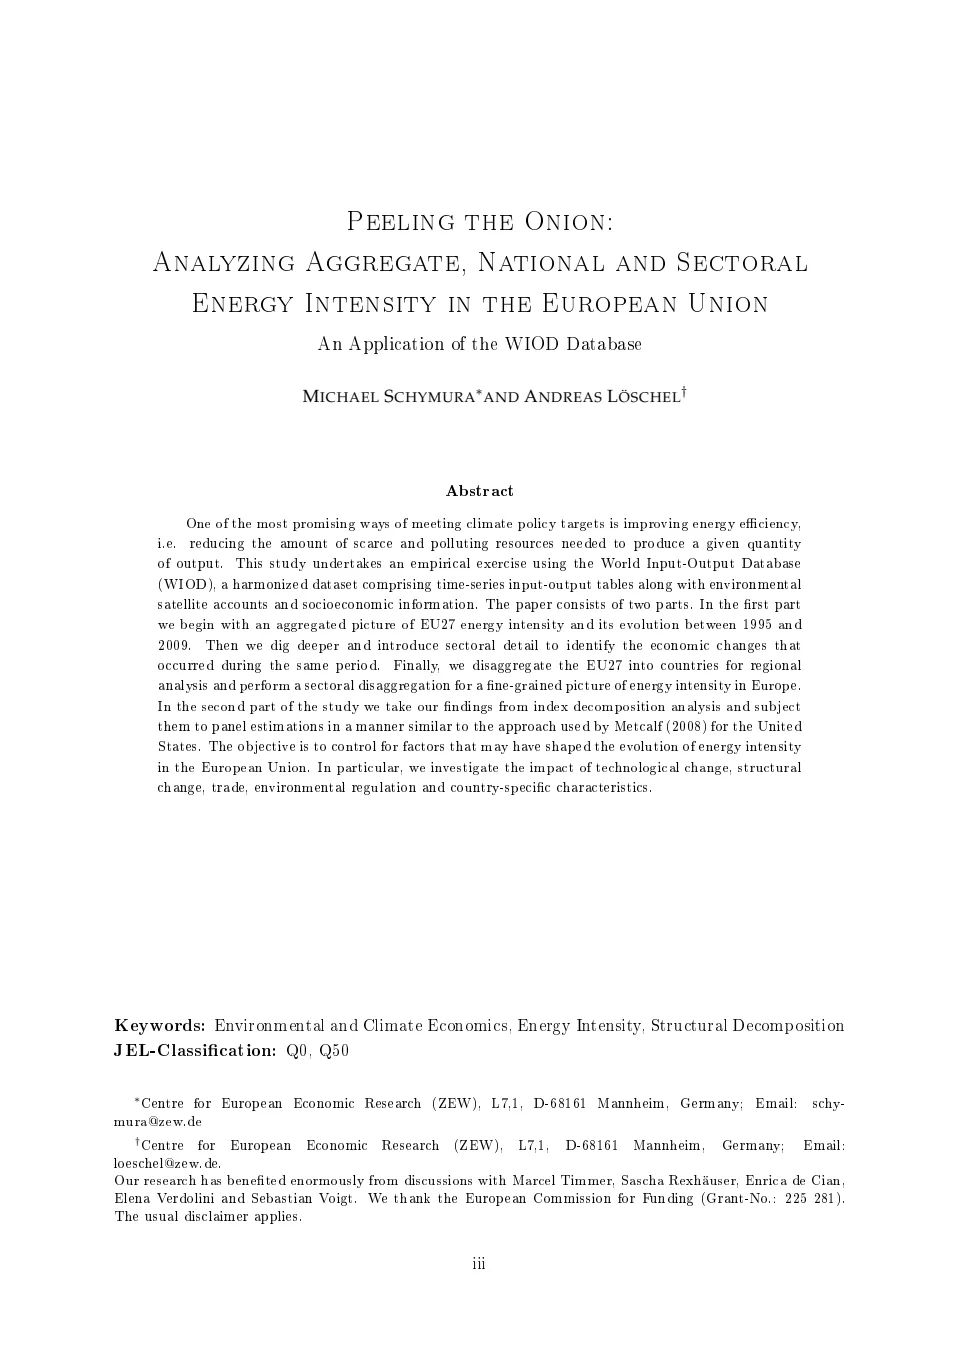
A journal title page became an editorial gateway without changing the paper’s authorship or scientific claim.
 2026 · p. 12013 · p. 3
Cover: A journal title page became an editorial gateway without changing the paper’s authorship or scientific claim.
The two artifacts
Download the science—and its new interface.
Both PDFs are offered intact. The first is the empirical source. The second is an editorial edition, not a 2026 update of the evidence.
Peeling the Onion
The scientific source: 37 pages, the original equations, evidence, tables, references, and appendices.
- Pages
- 37
- File
- PDF · 834 KB
- Producer
- MiKTeX pdfTeX 1.40.12

Peeling the Onion — 2026
The current 50-page public build: a new editorial interface around the same historical research boundary.
- Pages
- 50
- File
- PDF · 1.64 MB
- Producer
- LuaTeX 1.24.0
File hashes, source paths, page mappings, and transformations are recorded in the public provenance manifest.
Section 03
One hour—but not one prompt
“Modernize this paper” sounds like a formatting request. In practice it was a coupled sequence of reverse engineering, preservation, software migration, editorial design, visualization reconstruction, build repair, and visual verification. Each step changed the constraints on the next.
Figure · operating model
Routing chose the model. Autopilot governed the loop.
Model allocation · phase 1
Auto → GPT-5.3 Codex
Planning, prototyping, environment setup, and early build repair
20m 05s
Model allocation · phase 2
Manual → GPT-5.6 Sol · Max · long context
Full-content reconstruction, compatibility engineering, compilation, and visual QA
43m 31s
Autopilot execution policy spanned both model phases
Autonomy removed confirmation friction. It did not choose the preservation boundary, inspect the final pages on the author’s behalf, or decide when the problem definition was incomplete.
Three Copilot concepts played different economic roles. Auto was model allocation: it routed the bounded setup phase to GPT-5.3 Codex. Autopilot was execution latitude: it allowed the approved edit–build–inspect loop to continue without a confirmation at every action.The manual switch was capital allocation by the human operator: GPT-5.6 Sol with Max reasoning and long context was selected when complete-document reconstruction became the bottleneck.
This is the opposite of “always use the strongest model.” It is a routed production line: spend frontier reasoning only where the marginal probability of a coherent, validated result justifies its price. GitHub describes Auto in similar operational terms—matching task complexity and system conditions while routing along natural cache boundaries—and offers paid plans a 10% Auto model-cost discount.[4]
Section 04
Where 1.54 million tokens came from
Ninety-four percent of recorded volume was prompt context. Only six percent was generated output. That ratio is a signature of agentic work: the model repeatedly needs access to source, prior decisions, tool results, diagnostics, and review state so that step twenty remains consistent with step two.
Figure · token composition
The expensive-looking number was mostly memory.
Prompt context carried source files, prior decisions, tool results, build logs, and review state. Generated output was only six percent of recorded volume.
Model phase
Auto → GPT-5.3 Codex
Planning, prototyping, environment setup, and early build repair
Model phase
Manual → GPT-5.6 Sol · Max · long context
Full-content reconstruction, compatibility engineering, compilation, and visual QA
Source: supplied session telemetry for the main modernization run. Token counts are recorded volume, not a direct invoice and not a claim that every context token was billed as fresh input.
This is why “How long was the user prompt?” is usually the wrong cost question. The relevant object is a request sequence. Every request can contain fresh input, cache reads, cache writes, and generated output, each priced differently by model and context tier.
I is fresh input, K cached input, W cache write, and O generated output for request r on model m. The task—not a token in isolation—is the economic unit.
A million cheap cache-read tokens can cost less than a smaller volume of frontier output. A short task can become expensive through retries. A long task can stay economical when context is reused and routine work is routed away from the frontier tier. Token count is physical volume; price depends on composition.
Section 05
Why the cost was about $10
GitHub’s pricing table charges by model and by token class. At the 6 August 2026 snapshot used here, GPT-5.3 Codex default-context input, cached input, and output were $1.75, $0.175, and $14 per million tokens. GPT-5.6 Sol long-context input, cached input, cache write, and output were $10, $1, $12.50, and $45 per million.[3] The two long-context requests therefore dominate the conservative estimate even though they consumed fewer total tokens than the Auto phase.
Figure · catalog-equivalent envelope
The observed tokens support a range—not an invoice.
Scenario 01
$3.02
Output-only floor
Counts generated tokens only. Useful as a strict lower bound, not a billing estimate.
- Auto phase
- $0.44
- Manual phase
- $2.58
Scenario 02
$3.83
Cache-read scenario
Values carried context at cached-input rates and output at full output rates.
- Auto phase
- $0.56
- Manual phase
- $3.27
Scenario 03
$11.10
Fresh-input scenario
Prices each request’s prompt context as fresh input. The public headline rounds this conservative case.
- Auto phase
- $1.63
- Manual phase
- $9.47
Rates: GitHub’s public model-pricing table, accessed 6 August 2026. The Auto phase receives the documented 10% paid-plan discount. Plan allowances, cache writes, and GitHub’s final accounting can change billed cost.
| Model / tier | Input | Cached input | Cache write | Output | Session role |
|---|---|---|---|---|---|
| GPT-5.3 CodexDefault context | $1.75/M | $0.175/M | — | $14/M | Auto-selected in the setup phase; paid plans receive a 10% Auto discount. |
| GPT-5.6 SolLong context (>272K) | $10/M | $1/M | $12.5/M | $45/M | Manually selected for the two long-context reconstruction requests. |
Section 06
From premium request units to usage-based billing
Before 1 June 2026, GitHub measured paid Copilot interactions with premium request units: one interaction consumed one PRU, then a model multiplier adjusted the charge for more expensive models. From 1 June, GitHub replaced that request-based meter with usage-based billing: model choice and token consumption are converted into GitHub AI Credits, where one credit equals $0.01.[1] Existing annual Pro and Pro+ subscribers can remain on the legacy system until that annual plan ends; the new model governs the monthly usage-based plans described here.
Figure · June 2026 billing transition
From counting requests to pricing the production function.
| Economic object | Before 1 June 2026 · legacy PRUs | From 1 June 2026 · usage based |
|---|---|---|
| Meter | One premium request unit per interaction | Input, output, cached input, and cache-write tokens |
| Price differentiation | Model multiplier | Per-token rate by model and context tier |
| Allowance | Monthly premium-request quota | Monthly GitHub AI Credits allowance |
| Overage control | Request budgets and quotas | Dollar budgets, AI-credit usage, alerts, and optional hard stops |
Marginal cost
Long context and output become visible economic inputs.
Routing
Cheap models handle bounded work; frontier models handle coupled problems.
Two-part tariff
Subscription allowance preserves option value; overage prices heavy use.
FinOps
Budgets, alerts, usage attribution, and unit economics move into the workflow.
Economically, the old PRU system was a coarse quantity meter. It was not a pure flat rate—model multipliers already priced quality tiers—but it compressed short and long interactions into the same request-shaped unit. The new meter follows the underlying production inputs more closely. Long context, large output, and frontier reasoning become visible at the margin.
That change is understandable because frontier inference has high and highly variable marginal cost. A single flat seat price creates cross-subsidies: light users finance heavy agentic users, while the heaviest users have little price incentive to route tasks or constrain context. In the limit, the provider must raise the seat price, throttle access, or accept adverse selection. Usage pricing reduces that moral hazard and lets valuable heavy use continue when its expected benefit exceeds its cost.
But usage pricing creates its own friction: uncertainty, monitoring cost, and the temptation to optimize the wrong thing. GitHub therefore uses a hybrid two-part tariff rather than pure pay-as-you-go. Paid plans combine a subscription, base AI Credits, a variable flex allotment, and optional paid overage; unused included credits do not roll over.[2] The allowance preserves convenience and option value. Metered overage prices tail risk.
Code completions and next edit suggestions remain outside AI-credit billing for paid plans. The variable meter applies to model-consuming features such as Chat, CLI, cloud agents, Spaces, Spark, and third-party coding agents.[3] The economic transition is therefore from “buy a seat and count premium interactions” to “buy a seat plus an allowance and manage a variable portfolio of model work.”
Section 07
Usage pricing makes AI FinOps urgent
Under a seat-only budget, procurement asks how many users need licenses. Under usage pricing, the cost object moves inside the workflow: which model, which feature, whose context, how many repair cycles, and what validated output emerged? Monitoring is no longer an administrative afterthought. It is part of production design.
Route by marginal value
Use lightweight models for bounded edits and reserve long-context frontier reasoning for tightly coupled work.
Budget context deliberately
Keep the state required for coherence; remove irrelevant files and stale history instead of optimizing blindly for fewer tokens.
Cap sessions and overage
Set account, cost-center, and per-user budgets; use alerts and hard stops where interruption is safer than runaway spend.
Instrument the workflow
Track model, feature, context, output, cache behavior, repair cycles, and the validated outcome—not only the monthly bill.
Preserve a manual exception
A budget should govern routine consumption without preventing justified frontier work or human intervention on scope and evidence.
GitHub exposes model-level usage, included versus additional consumption, usage reports, dollar budgets, and alerts; personal and organizational budgets can notify at 75%, 90%, and 100%, while supported scopes can block additional use.[5][6] Those controls create the mechanics of AI FinOps. They do not define the objective.
Minimizing tokens can be value destroying. The objective is the lowest risk-adjusted cost for a verified outcome.
Section 08
What the $10 did not buy
It did not buy the original research. The data construction, decomposition logic, econometrics, and interpretation were inherited from the authors. It did not remove human judgment. The preservation boundary, model switch, visual inspection, and decision to publish remained human responsibilities.
It also did not buy a perfect first specification. The first edition did not treat the complete graph folder as authoritative because that source boundary had not been stated. After the missing guidance was supplied, a separate 17m 46s pass reconstructed the remaining chart families from their coordinate sources. The final public artifact includes that work; the headline telemetry does not.
Autonomy operates inside a problem definition
A polished artifact can still be incomplete when the source boundary is underspecified.
Rendered output is the real test surface
Compiler success cannot detect hierarchy, overflow, weak chart semantics, or a missing visual family.
The task is a system, not a prompt
Source migration, compatibility, charts, builds, and QA are complements; a weak layer throttles the result.
The cheapest model is not always the cheapest workflow
Retries, lost context, and latent defects can dominate the token-price advantage of a weaker model.
This is the governance layer doing its job. Autopilot reduces coordination friction; it does not abolish editorial responsibility. Metering can price model work; it cannot price the scientific content that made the artifact worth preserving.
Conclusion
The $10 is the least interesting number.
The useful result is the operating model behind it: route by task, carry only the state coherence needs, exploit cache continuity, monitor variable spend, and keep a human switch for scope, evidence, and quality.
Dollars per million tokens is an input price. Dollars per validated artifact is an economic result.
Sources and scope
Evidence behind the accounting
- 1
GitHub Docs. What changed with Copilot billing (legacy) (accessed 6 August 2026).
- 2
GitHub Docs. Usage-based billing for individuals (accessed 6 August 2026).
- 3
GitHub Docs. Models and pricing for GitHub Copilot (accessed 6 August 2026).
- 4
GitHub Docs. About Copilot auto model selection (accessed 6 August 2026).
- 5
GitHub Docs. Monitoring your GitHub AI Credits usage (accessed 6 August 2026).
- 6
GitHub Docs. Setting up budgets to control spending on metered products (accessed 6 August 2026).
Session time and token figures come from supplied telemetry. Paper metadata, byte sizes, and page counts were read from the current downloadable PDFs. The original paper’s scientific claims remain bounded to its 1995–2009 evidence. The cost analysis describes the main modernization run and excludes the later graph-source pass.