CLIM-16 / SPM.B / Research primer
What pace of emissions reduction do assessed pathways imply?
How do recent global emissions changes compare with the reduction ranges in AR6 Table SPM.1 on a compatible accounting basis?
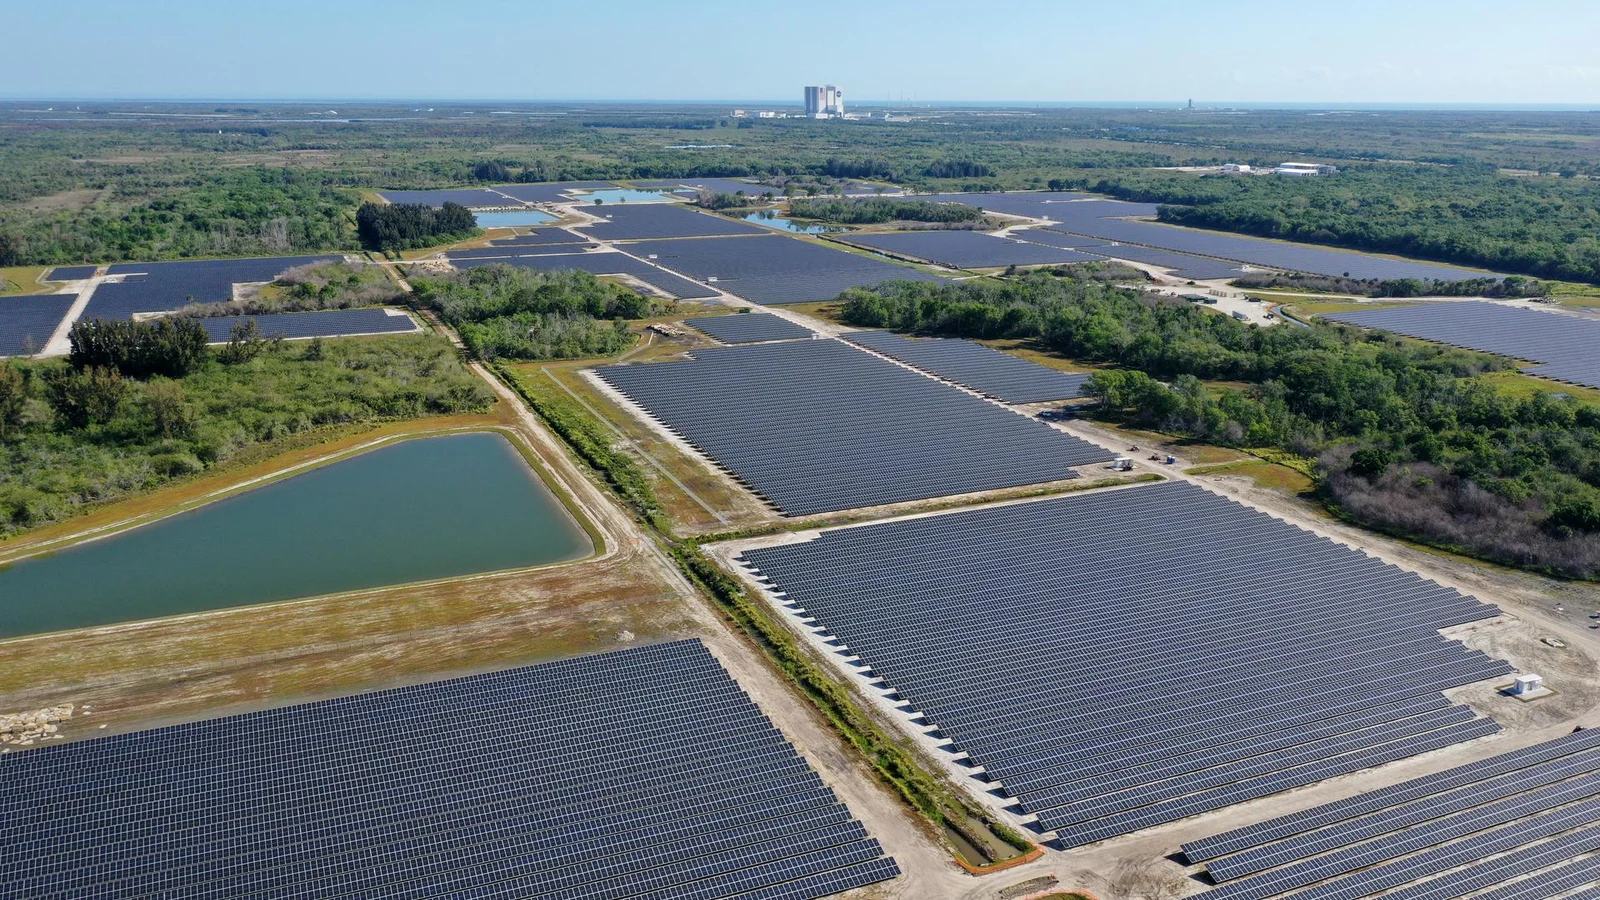
NASA/Kennedy Space Center. Electricity infrastructure at the Discovery Solar Energy Center in Florida in April 2021; energy-system context. Contextual image; not used to estimate a trend. Image credits.
The question
Pathway benchmarks describe assessed model categories, not promised outcomes. The proposed study compares their required pace with recent observations without allocating global reductions to individual countries.
Why it matters
A target year can hide the speed and continuity of change assumed along the way, especially when percentages use different starting years.
The AR6 anchor
AR6 pathways limiting warming to 1.5 degC with no or limited overshoot, or to 2 degC, involve rapid, deep reductions across sectors this decade (high confidence).
AR6 Synthesis Report (2023) / B.6; Table SPM.1.
Evidence and comparison
- Unit of analysis
- Gas-pathway-category-horizon, with a separate observed global gas-year series.
- Baseline and denominator
- Preserve Table SPM.1's 2019 reference, pathway likelihoods and percentile ranges. Match GHG scope and warming-potential conventions before indexing newer estimates to 2019.
- First descriptive test
- Compare benchmark reductions and recent percentage changes from the same base. Keep methane, CO2 and all-GHG results separate rather than summing overlapping quantities.
- Deeper analysis
- Calculate equivalent compound annual reduction rates between published endpoints where mathematically valid; label them summaries, not reconstructed trajectories or model-member paths.
- Attribution status
- projection/scenario analysis
- Uncertainty
- Assessed percentile ranges describe the selected pathway distribution, not prediction intervals or probabilities that policy commitments will be fulfilled.
Principal sources
- IPCC AR6 Table SPM.1
GHG, CO2 and methane reduction medians; Published percentile ranges; Pathway category.
Assessed 2030/2035/2040/2050 benchmarks relative to 2019; transcription checks pending. Candidate source; import and publication checks are still required. - Indicators of Global Climate Change
Global net GHG emissions; CO2 and methane emissions; Accounting convention.
Target 2019-2024 observed-inventory estimates in IGCC 2025; export checks pending. Candidate source; import and publication checks are still required.
Alternative explanations
- Emissions accounting boundaries
- Inventory revisions
- Nonrepresentative endpoints
- Pathway selection
The visual argument
Provisional: benchmark interval plot with gas and horizon selectors; annotate the 2019 baseline, likelihood category and observed-versus-scenario boundary throughout.
- Recent observed-emissions comparison
- Equivalent annual-rate table
- Gas-scope reconciliation
- Pathway-category definitions
What these data do not show
- Global benchmarks are not national burden-sharing rules.
- Table endpoints cannot reveal the full distribution of annual pathway trajectories.
Reproducibility and next release
Plan src/build.mjs and data/processed/pathway-benchmarks.csv from frozen data/raw extracts; validate double-checked table transcription, percentile ordering, 2019 reconciliation and rate arithmetic, recording hashes and rights in provenance.
- After approval: pathway-pace study
- Article and benchmark methods
- Responsive intervals and exact values
- 16:9 hero and launch copy
- Optional PDF carousel
- Chart exports and benchmark CSV