CLIM-07 / SPM.A / Research primer
Where do European weather losses and insurance gaps coincide?
How do reported economic losses and insured shares differ across European countries, and what remains hidden by national readiness scores?
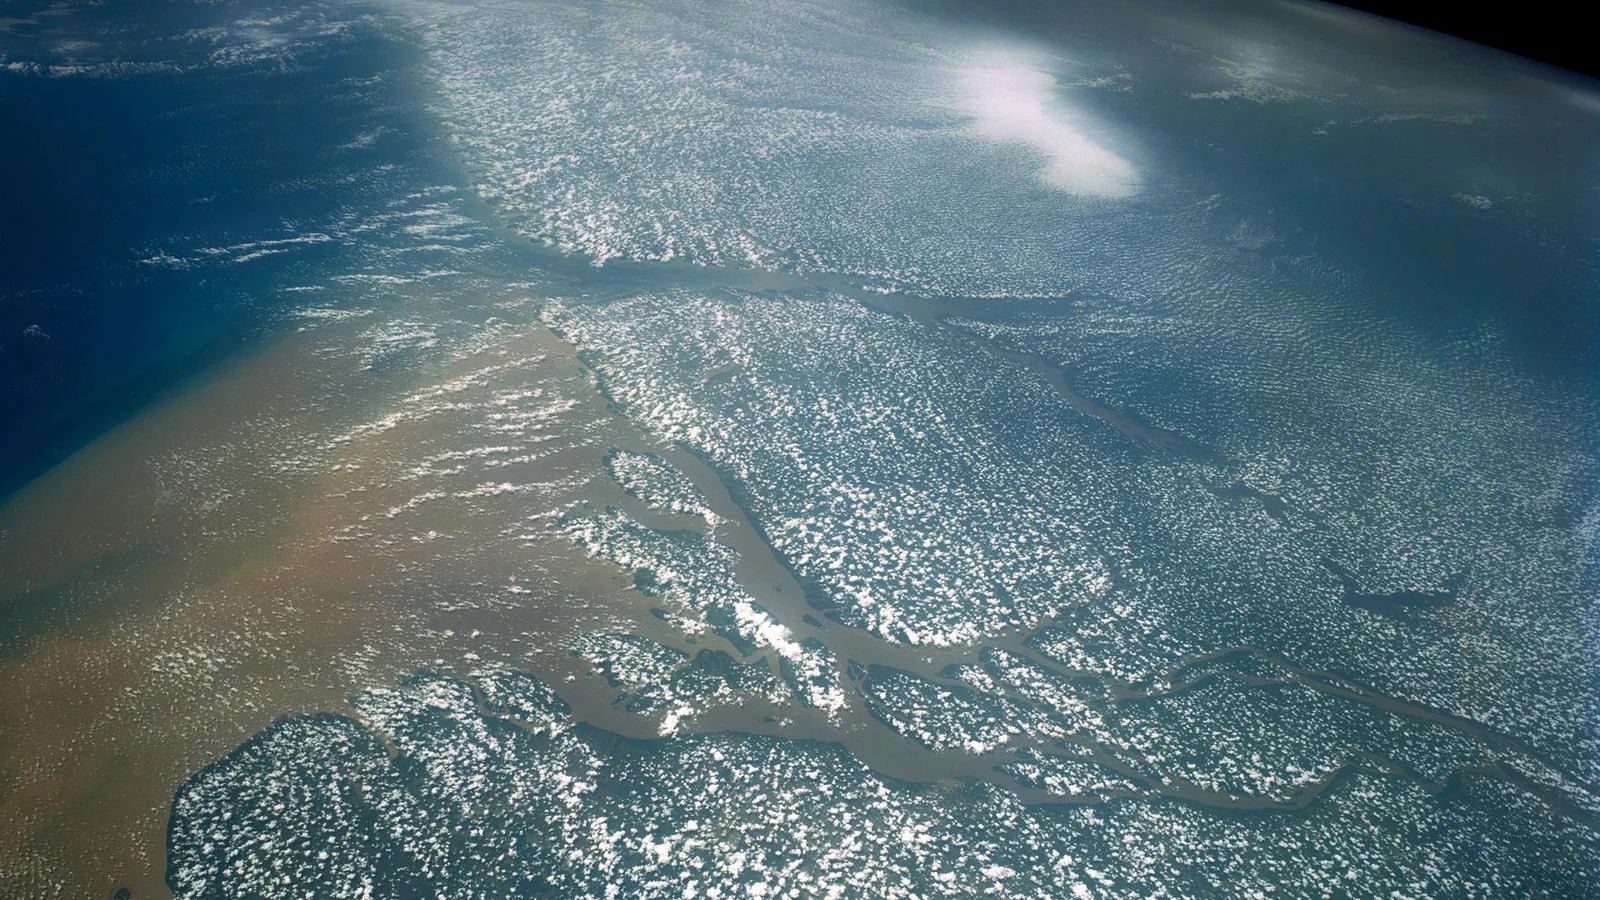
NASA/STS-43 crew. Sediment at the mouths of the Amazon River on Brazil's Atlantic coast, photographed from space in 1991. Contextual image; not used to estimate a trend. Image credits.
The question
A large loss and a large uninsured share describe different financial problems. This primer separates their geography without assuming that every difference reflects climate intensity.
Why it matters
Insurance changes who finances recovery, while prevention changes the underlying exposure; conflating them produces misleading accounts of resilience.
The AR6 anchor
AR6 assesses widespread climate-related losses and damages alongside persistent adaptation gaps and uneven effectiveness of adaptation actions (high confidence).
AR6 Synthesis Report (2023) / A.2; A.3.
Evidence and comparison
- Unit of analysis
- Country-reporting-period, with hazard groups where the aggregate permits.
- Baseline and denominator
- Keep EEA's published constant-price euro basis and exact reporting window. The uninsured share uses insured and total losses from the same source boundary.
- First descriptive test
- Plot total reported losses beside insured shares, retaining Germany as a comparison case; do not manufacture annual insurance observations from period totals.
- Deeper analysis
- Compare rank sensitivity to published per-capita normalization and hazard composition where available. Examine readiness as context, not an instrument for insurance effectiveness.
- Attribution status
- descriptive observation
- Uncertainty
- Treat unavailable insurance shares as missing, not zero. Monetary estimates and aggregate score vintages carry different uncertainties and cannot form a causal decomposition.
Principal sources
- EEA Economic Losses
Weather-related economic losses; Insured losses or insured share; Hazard group.
Target 1980-2024 published aggregates; release, currency and coverage checks pending. Candidate source; import and publication checks are still required. - ND-GAIN Country Index
Country readiness score; Infrastructure vulnerability score.
Target 2023 contextual snapshot; common-country and release checks pending. Candidate source; import and publication checks are still required.
Alternative explanations
- Asset accumulation
- Insurance penetration and deductibles
- Disaster reporting
- Hazard composition
The visual argument
Provisional: paired country dots for losses and insured share; select a hazard only where supported, annotating reporting years and missing insurance observations.
- Hazard-composition comparison
- Published normalization sensitivity
- Readiness-context panel
- Currency and coverage ledger
What these data do not show
- Reported losses alone do not identify a climate-change trend.
- Insurance coverage does not measure affordable protection or successful reconstruction.
Reproducibility and next release
Plan src/build.mjs and data/processed/europe-losses.csv from immutable data/raw tables; verify currency basis, period joins, share bounds and missingness, retaining redistribution restrictions and hashes in provenance.
- After approval: European protection-gap study
- Article and loss-accounting notes
- Responsive figures and exact table
- 16:9 hero and LinkedIn launch
- Optional PDF carousel
- Chart exports and permitted processed data