CLIM-06 / SPM.A / Research primer
How does heat change the capacity to work outdoors?
How do modeled heat-related labor-capacity losses differ across sectors and countries with different adaptation-readiness profiles?
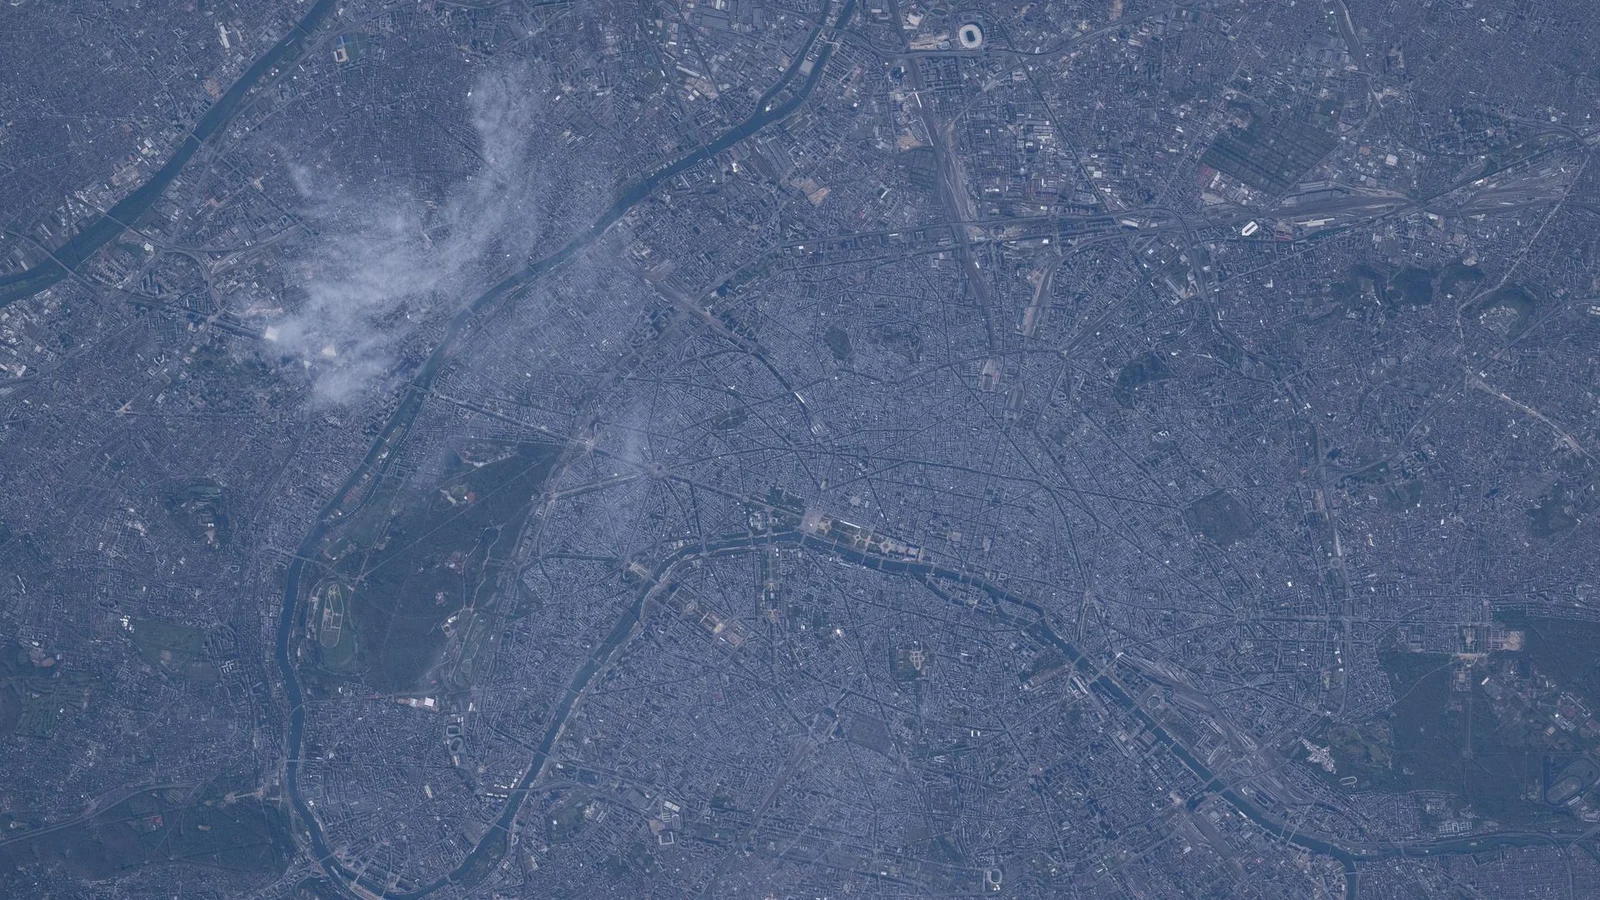
NASA/Chris Williams. Paris and the Seine photographed from the International Space Station on April 4, 2026; urban context, not a heat map. Contextual image; not used to estimate a trend. Image credits.
The question
Potential work hours lost to heat are not observed reductions in wages or production. The study would compare the modeled constraint before asking what adaptation could address.
Why it matters
Agriculture and construction face different exposure from indoor services; national averages can obscure the workers carrying the largest modeled burden.
The AR6 anchor
AR6 finds disproportionate climate impacts on vulnerable communities and assesses that support for highly vulnerable people can improve adaptation outcomes (high confidence).
AR6 Synthesis Report (2023) / A.2; C.5.
Evidence and comparison
- Unit of analysis
- Country-sector-year, with country readiness as a contextual attribute.
- Baseline and denominator
- Retain the published labor-capacity model and its work-intensity assumptions. Compare hours per worker only where the source supplies the matching sector denominator.
- First descriptive test
- Contrast agriculture, construction and other documented sectors using common-year potential hours lost; report country totals separately from normalized burdens.
- Deeper analysis
- Examine changes within a fixed country-sector panel and readiness strata. Test whether apparent rankings survive denominator choice and exclusion of poorly covered countries.
- Attribution status
- descriptive observation
- Uncertainty
- Published modeled losses depend on exposure and physiological assumptions; score differences in readiness do not constitute uncertainty intervals or measured adaptation effects.
Principal sources
- Lancet Countdown
Potential labor hours lost; Sector; Published worker denominators where available.
Target 2000-2024; sector coverage and release checks pending. Candidate source; import and publication checks are still required. - ND-GAIN Country Index
Country readiness score; Readiness components.
Target 2000-2023; latest common-year coverage pending verification. Candidate source; import and publication checks are still required.
Alternative explanations
- Work schedules
- Mechanization and occupation mix
- Informal employment
- Access to cooling
The visual argument
Provisional: sector dot plots with a country selector; annotate modeled hours and denominator availability, keeping any absolute-versus-normalized switch explicit and reversible.
- Fixed-panel sector trends
- Readiness-context comparison
- Absolute versus normalized ranking
- Work-intensity assumption table
What these data do not show
- Potential capacity loss is neither observed absenteeism nor GDP loss.
- National readiness does not measure employer protection or individual working conditions.
Reproducibility and next release
Plan src/build.mjs, frozen data/raw indicator exports and data/processed/labor-heat.csv; provenance tests will check sector mappings, worker denominators, country coverage, nonnegative hours, model versions and licenses.
- After approval: labor-heat web study
- Article and physiological model notes
- Responsive charts and exact values
- 16:9 hero and launch copy
- Optional PDF carousel
- Chart exports and processed CSV