 Climate Change Data Stories
CLIM-05 / Germany / Heat & health
The heat a thermometer misses.
A hot day is a weather statistic. Heatwave exposure depends on who is there, where the heat persists, and whether the night brings relief. Two German summers reveal the difference.
Before the exposure data
Which summer brought more heatwave exposure?
DWD recorded fewer hot days in 2023. Choose the year you expect to have accumulated more heatwave person-days among Germany's older adults.
A choice tests the interpretation, not your climate knowledge.
Exhibit 01
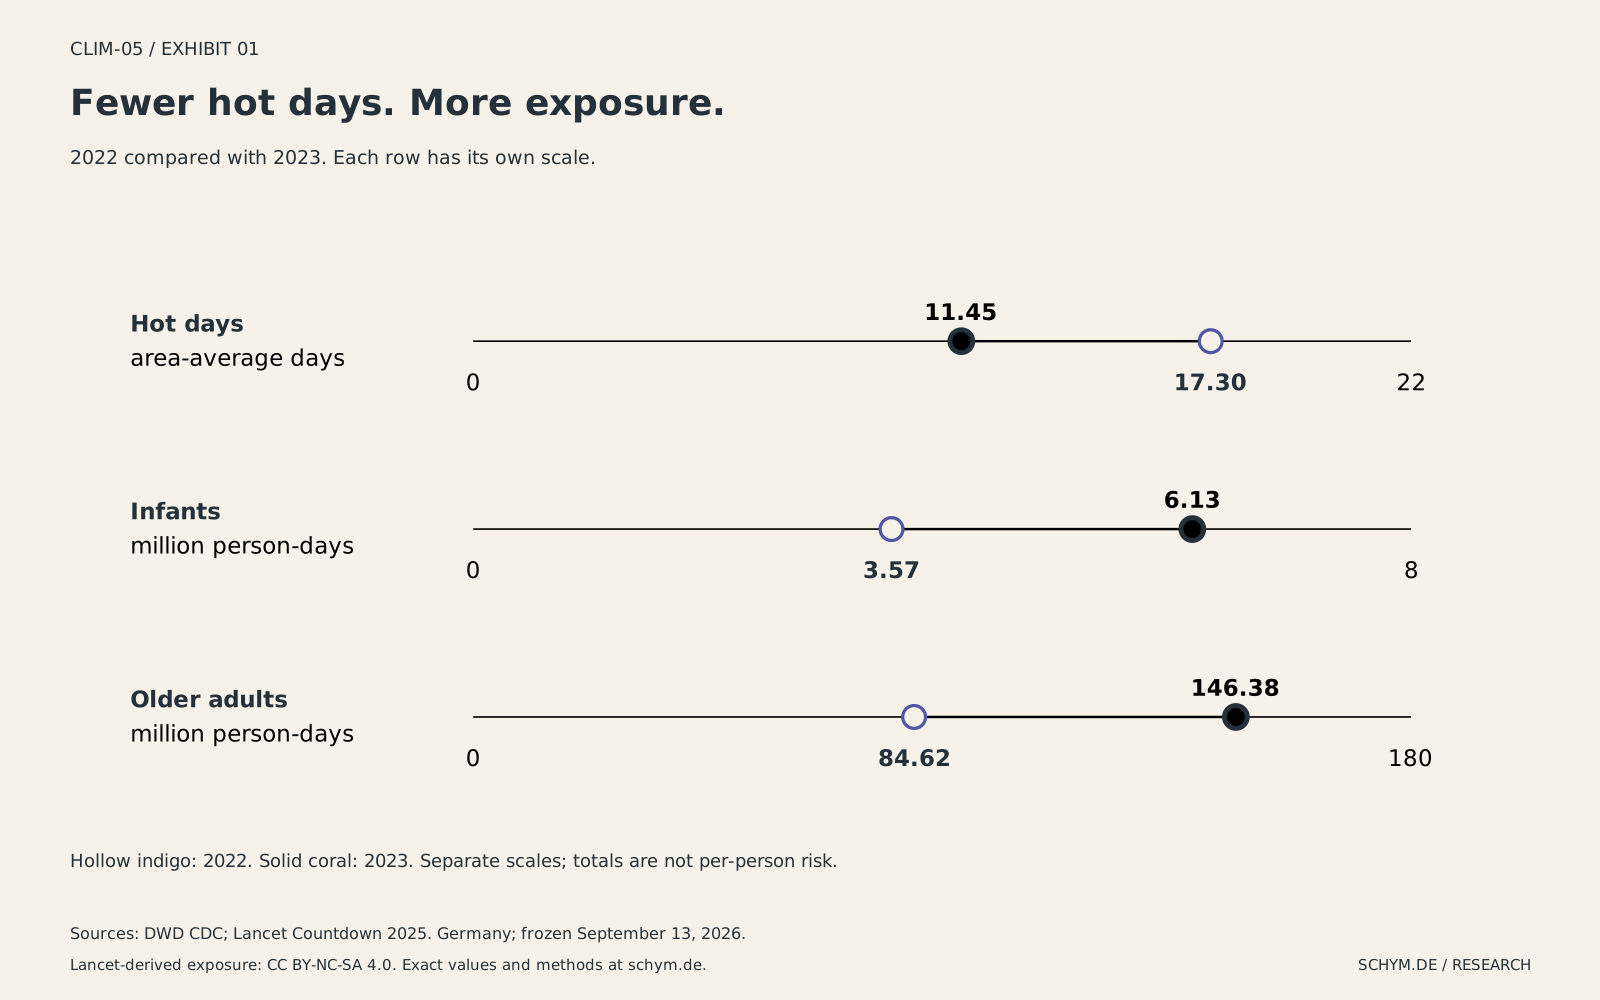
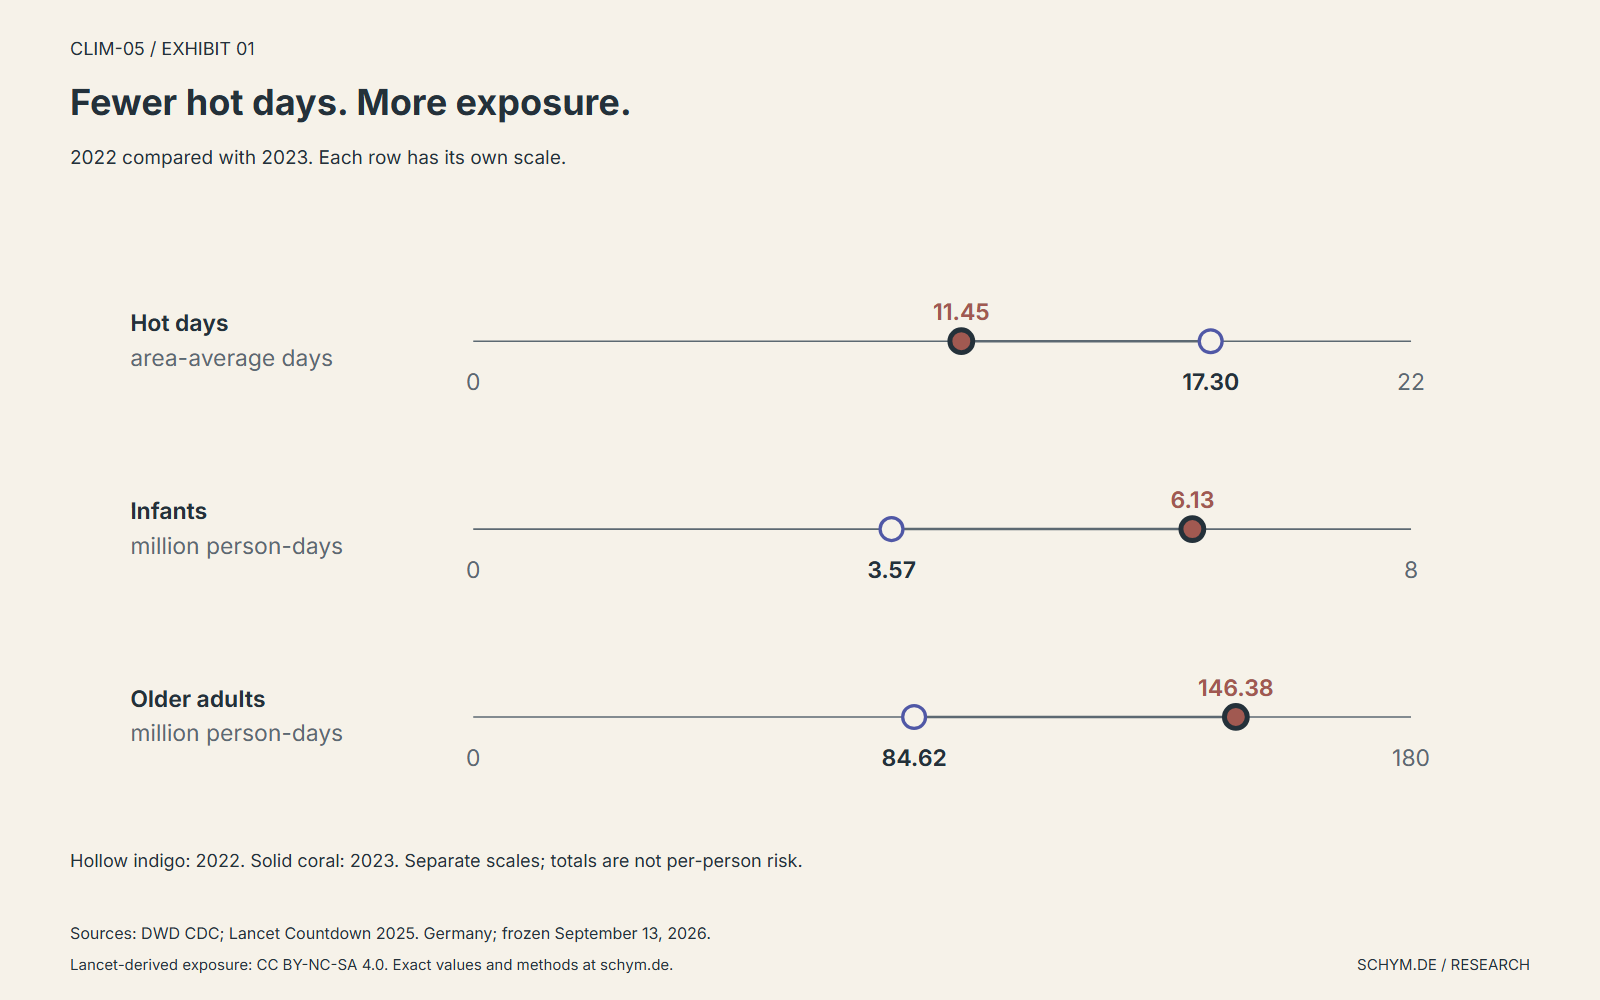
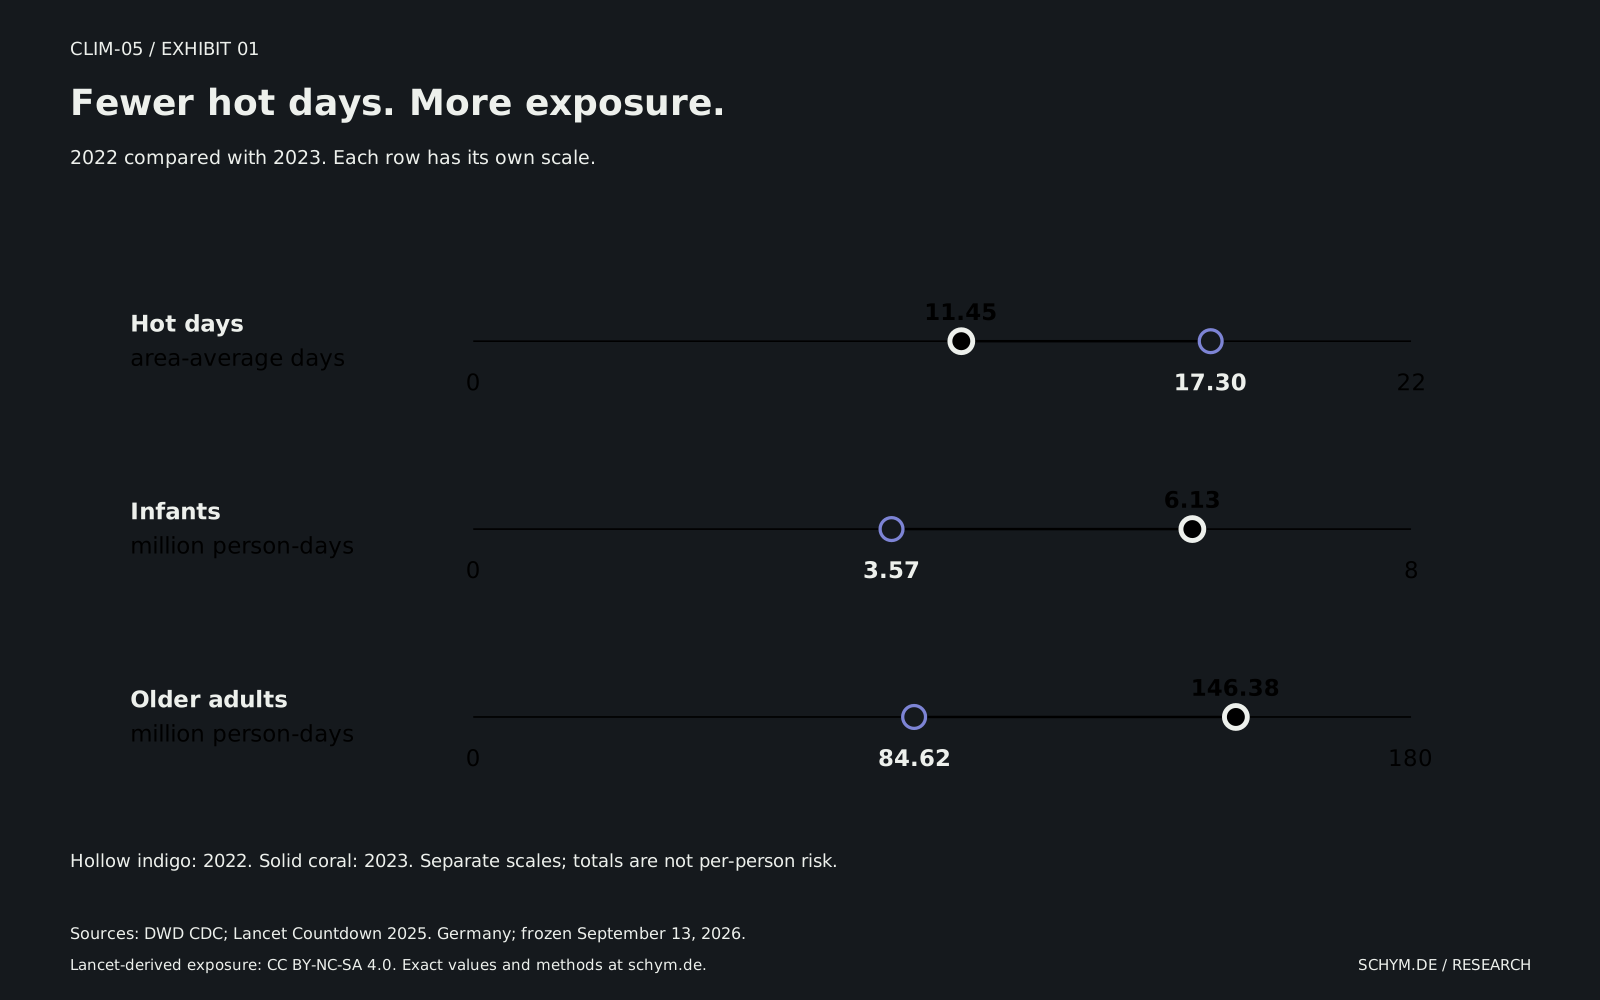
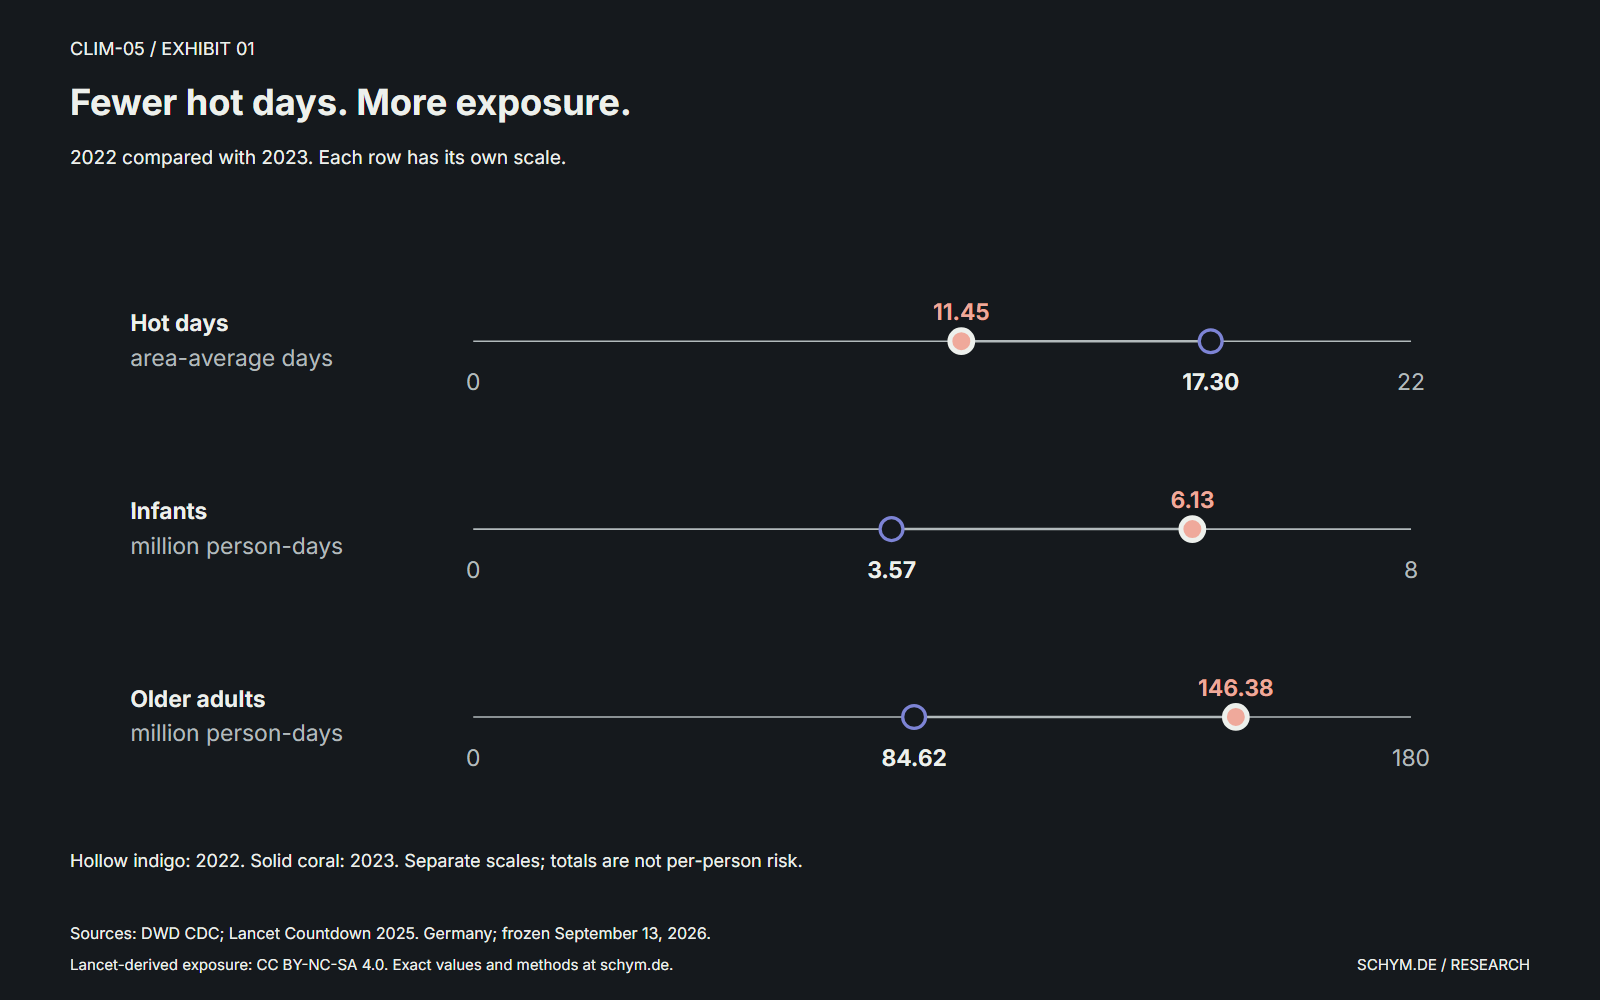
Fewer hot days. More exposure.
2022 compared with 2023. Each row has its own scale.
DWD; Lancet Countdown 2025. Germany. Source snapshot: September 13, 2026.
Exact values
| Measure | Unit | 2022 | 2023 |
|---|---|---|---|
| Hot days | area-average days | 17.300 | 11.450 |
| Infants | million person-days | 3.568 | 6.134 |
| Older adults | million person-days | 84.622 | 146.377 |
Germany recorded 17.30 hot days in 2022 and 11.45 in 2023, averaged across its area. Read only that measure and the second summer looks substantially easier. Yet the Lancet Countdown estimates that older adults accumulated 146.38 million heatwave person-days in 2023, compared with 84.62 million in 2022. Infant exposure also increased. The ordering reverses when the unit of analysis changes.
This is not a contest between two datasets. They count different things. A hot-day indicator describes how often daytime temperature crosses a fixed threshold. Heatwave exposure combines persistent local heat, hot nights and the population living through them. Understanding that distinction is the first step toward reading heat as a human burden rather than a national average.
The record continues
More recent heat and river evidence
The age-specific exposure series here ends in 2024. For newer physical-condition records and a closer view of Germany, two recent studies extend the picture:
400 districts / 1991-2025
Where Heat Became Routine in Germany
The district atlas follows hot-day recurrence, persistent spells and tropical-night proxies through 2025. Its fixed population surface and local geography complement the national age-group totals; they are not an updated individual-health estimate.
Kaub / readings through 22 August 2026
The Rhine Is Low. The Output Effect Is Still Missing.
The Rhine-level study follows the July-August 2026 low-water episode. August is partial, gauge level is not navigable depth, and the industrial-output series ends in June. A newer physical shock is visible; its production effect is not yet identified.
These dated updates extend the weather and river records, not the Lancet exposure series. They do not establish that heat caused a particular low-water episode.
A threshold is a definition, not a body
A body does not reset at sunset.
A hot day
DWD's hot-day indicator counts a day when the maximum air temperature reaches at least 30 degrees Celsius. It is a fixed threshold, averaged over Germany's land area.
A heatwave, including the night
The Lancet indicator requires at least two consecutive days when both the daily minimum and maximum exceed their local 95th percentiles in 1986-2005. A warm night is part of the definition.
Heatwave person-days multiply those locally defined days by the vulnerable population exposed. One person for ten days and ten people for one day both contribute ten person-days. Neither description tells us how many people became ill.
Lancet Countdown: heat and health. Exposure definition: 2025 indicator 1.1.1 workbook.
Exhibit 02
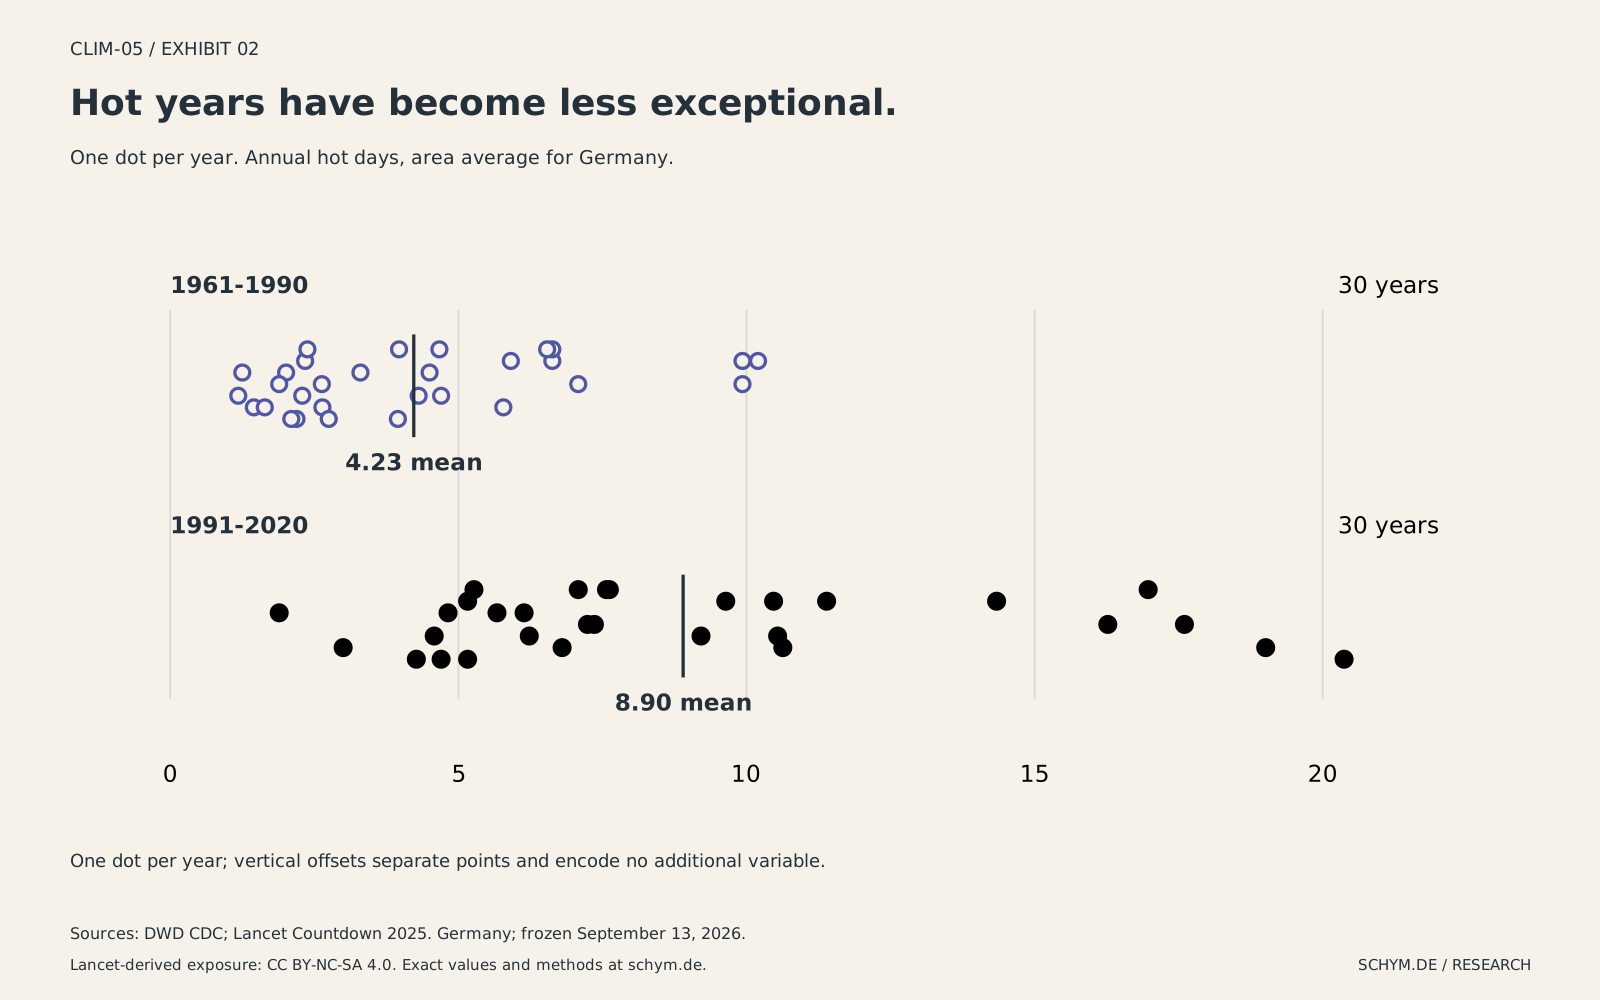
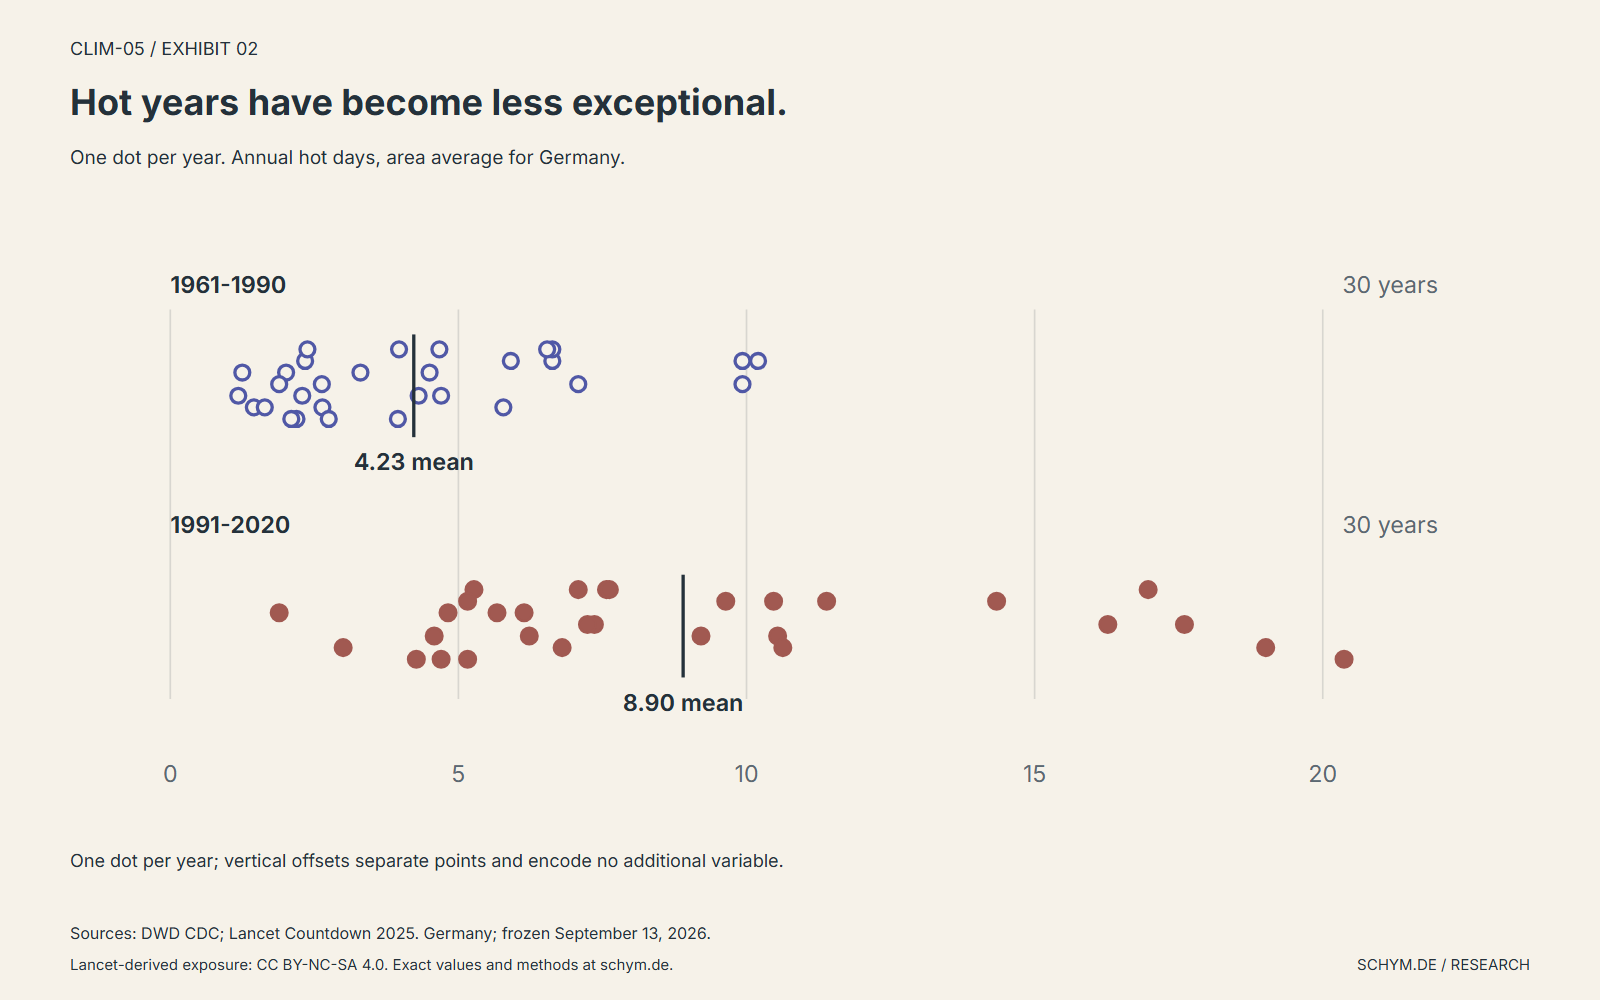
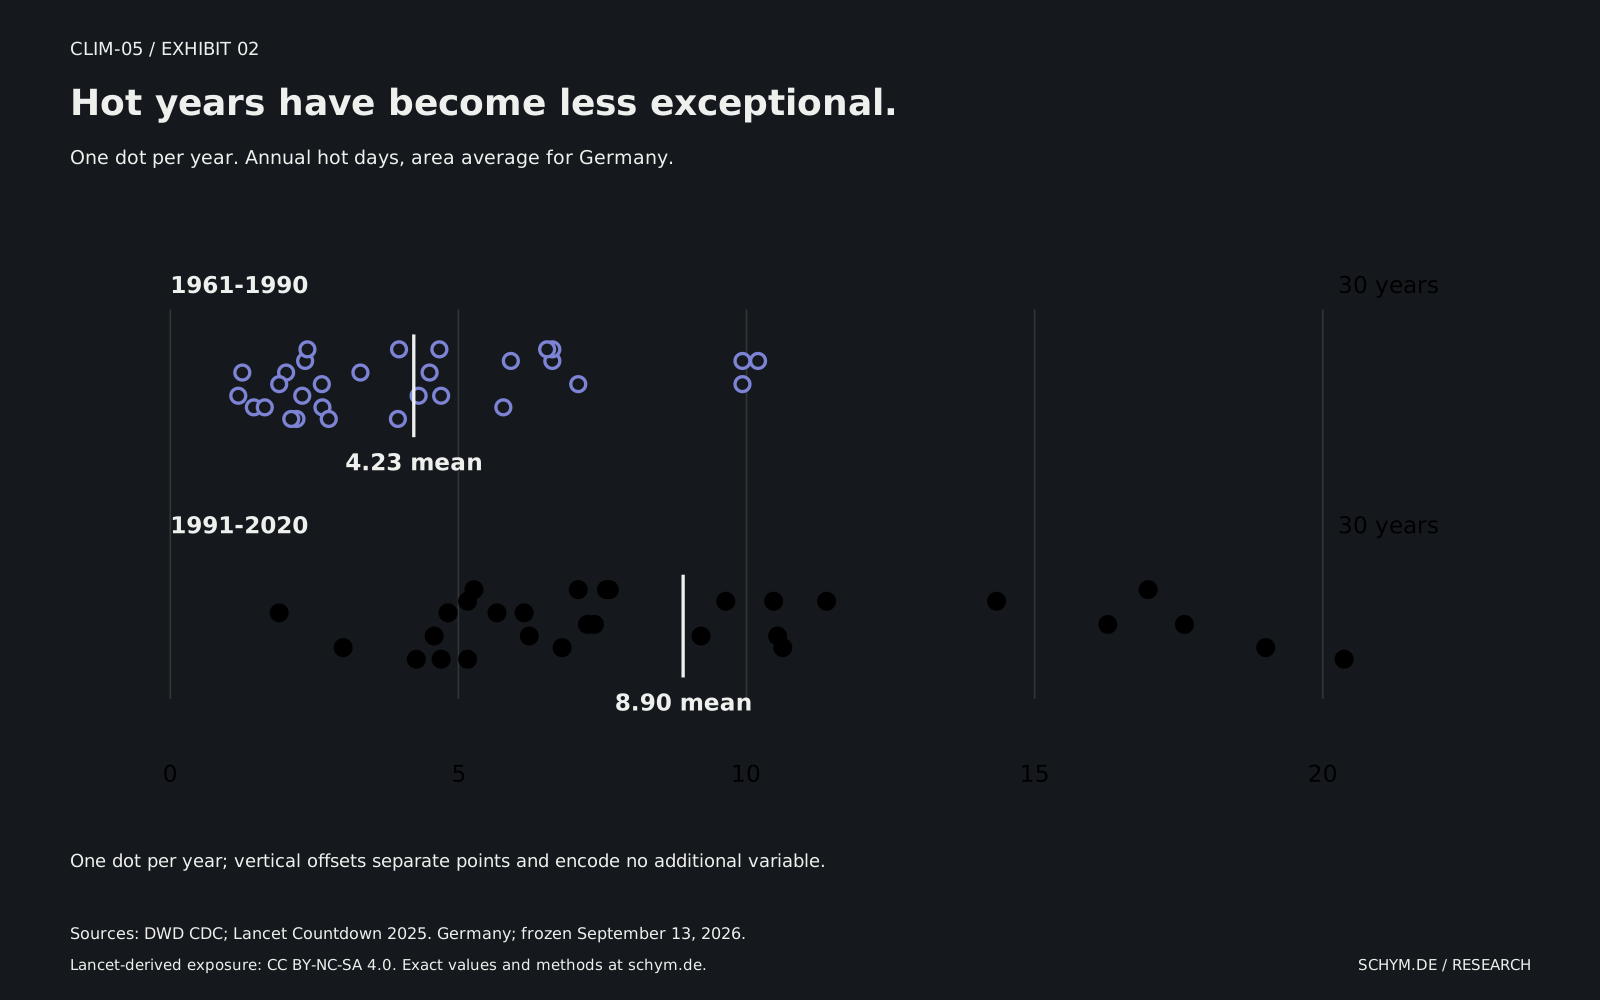
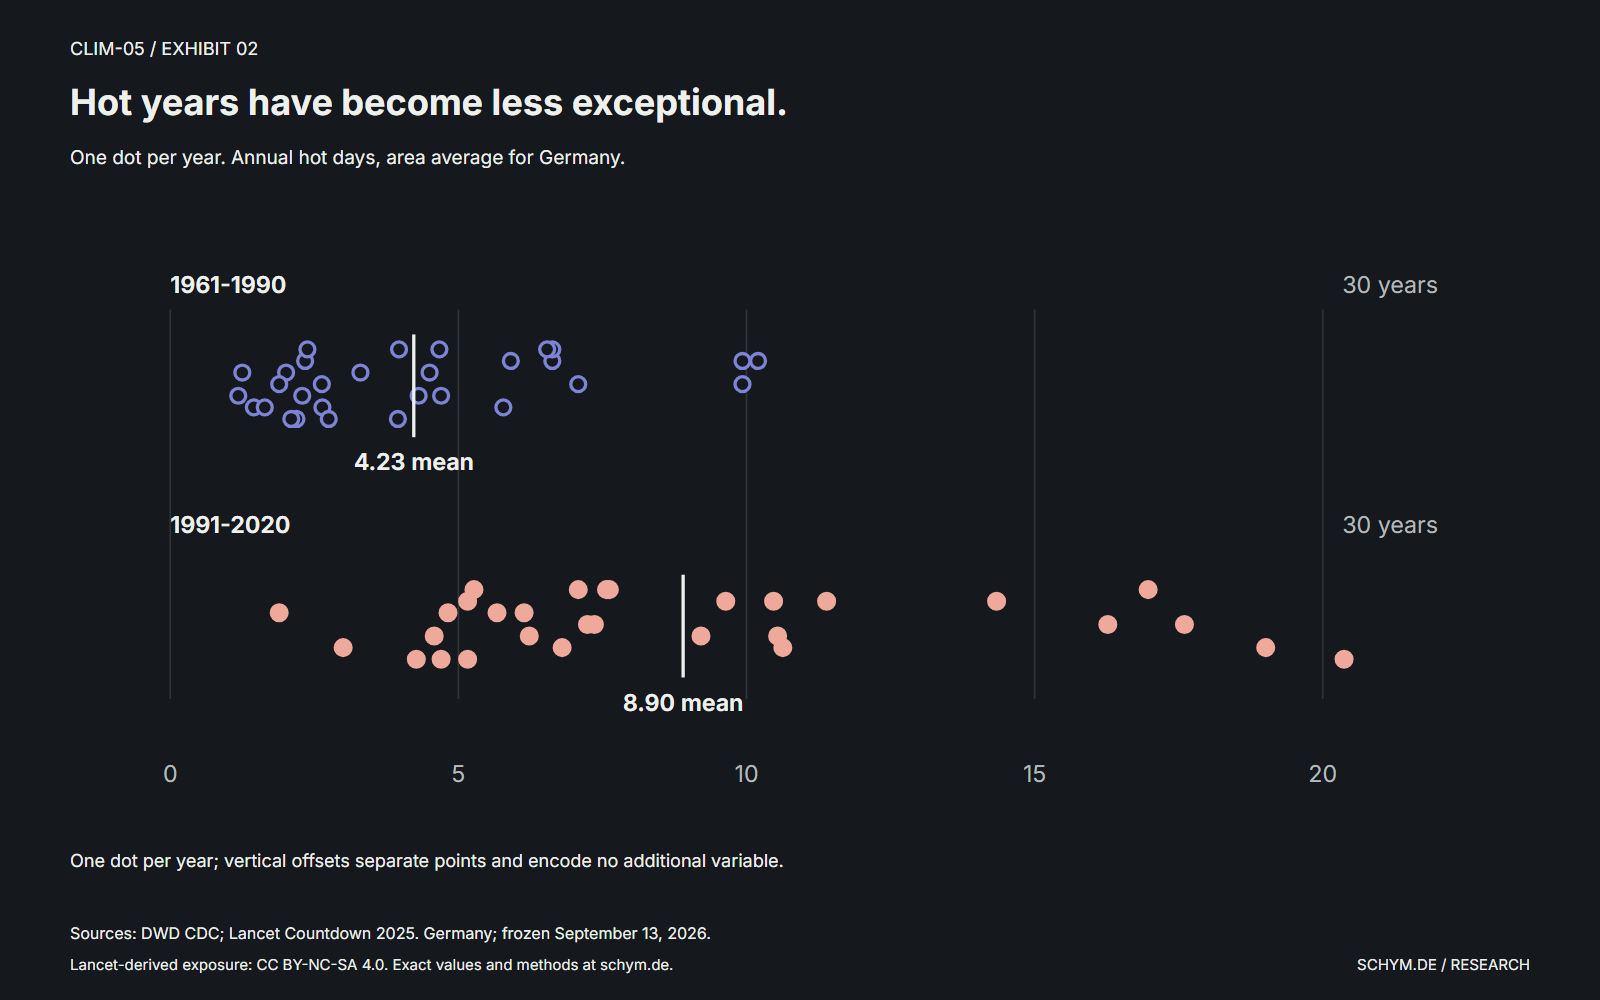
Hot years have become less exceptional.
One dot per year. Annual hot days, area average for Germany.
DWD; Lancet Countdown 2025. Germany. Source snapshot: September 13, 2026.
Exact values
| Year | Period | Hot days |
|---|---|---|
| 1961 | 1961-1990 | 3.97 |
| 1962 | 1961-1990 | 2.34 |
| 1963 | 1961-1990 | 4.5 |
| 1964 | 1961-1990 | 9.93 |
| 1965 | 1961-1990 | 1.18 |
| 1966 | 1961-1990 | 2.64 |
| 1967 | 1961-1990 | 3.95 |
| 1968 | 1961-1990 | 2.38 |
| 1969 | 1961-1990 | 6.63 |
| 1970 | 1961-1990 | 2.01 |
| 1971 | 1961-1990 | 7.08 |
| 1972 | 1961-1990 | 4.7 |
| 1973 | 1961-1990 | 5.78 |
| 1974 | 1961-1990 | 2.75 |
| 1975 | 1961-1990 | 6.63 |
| 1976 | 1961-1990 | 10.2 |
| 1977 | 1961-1990 | 1.25 |
| 1978 | 1961-1990 | 1.89 |
| 1979 | 1961-1990 | 2.29 |
| 1980 | 1961-1990 | 1.45 |
| 1981 | 1961-1990 | 2.19 |
| 1982 | 1961-1990 | 6.54 |
| 1983 | 1961-1990 | 9.93 |
| 1984 | 1961-1990 | 3.3 |
| 1985 | 1961-1990 | 2.63 |
| 1986 | 1961-1990 | 4.31 |
| 1987 | 1961-1990 | 1.64 |
| 1988 | 1961-1990 | 2.1 |
| 1989 | 1961-1990 | 4.67 |
| 1990 | 1961-1990 | 5.91 |
| 1991 | 1991-2020 | 5.27 |
| 1992 | 1991-2020 | 9.64 |
| 1993 | 1991-2020 | 1.89 |
| 1994 | 1991-2020 | 16.27 |
| 1995 | 1991-2020 | 10.54 |
| 1996 | 1991-2020 | 3 |
| 1997 | 1991-2020 | 5.16 |
| 1998 | 1991-2020 | 7.08 |
| 1999 | 1991-2020 | 5.16 |
| 2000 | 1991-2020 | 5.67 |
| 2001 | 1991-2020 | 7.36 |
| 2002 | 1991-2020 | 6.23 |
| 2003 | 1991-2020 | 19.01 |
| 2004 | 1991-2020 | 4.7 |
| 2005 | 1991-2020 | 7.57 |
| 2006 | 1991-2020 | 14.34 |
| 2007 | 1991-2020 | 4.82 |
| 2008 | 1991-2020 | 7.24 |
| 2009 | 1991-2020 | 4.58 |
| 2010 | 1991-2020 | 10.63 |
| 2011 | 1991-2020 | 4.27 |
| 2012 | 1991-2020 | 7.62 |
| 2013 | 1991-2020 | 10.47 |
| 2014 | 1991-2020 | 6.14 |
| 2015 | 1991-2020 | 17.6 |
| 2016 | 1991-2020 | 9.21 |
| 2017 | 1991-2020 | 6.8 |
| 2018 | 1991-2020 | 20.37 |
| 2019 | 1991-2020 | 16.97 |
| 2020 | 1991-2020 | 11.39 |
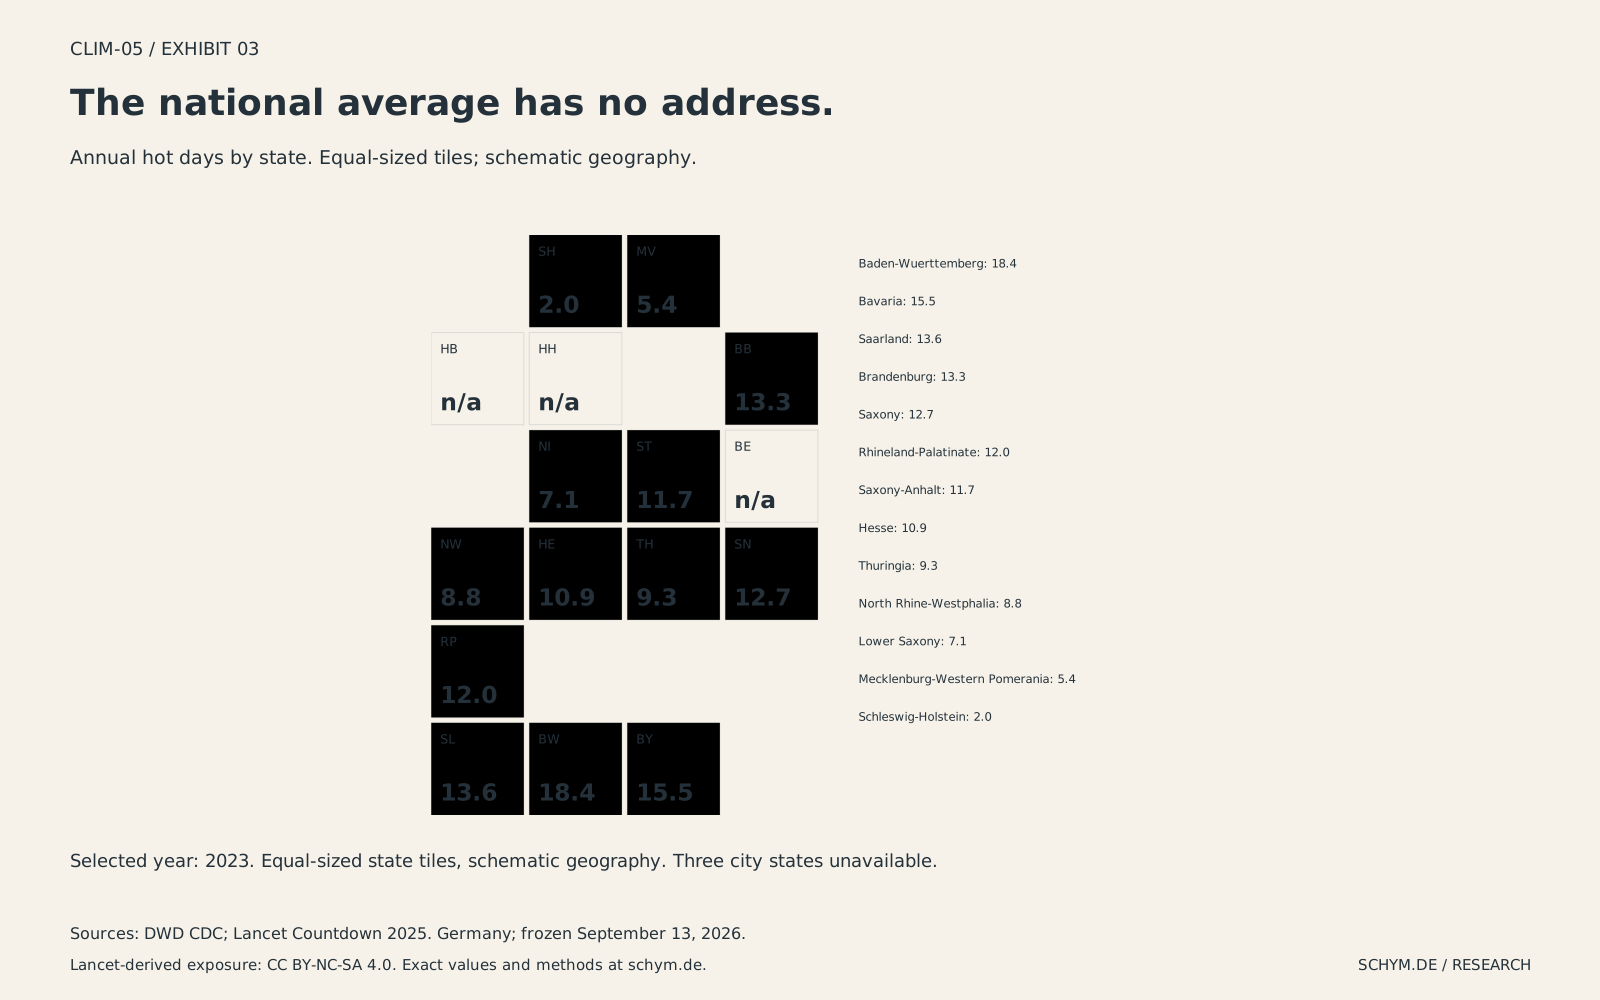
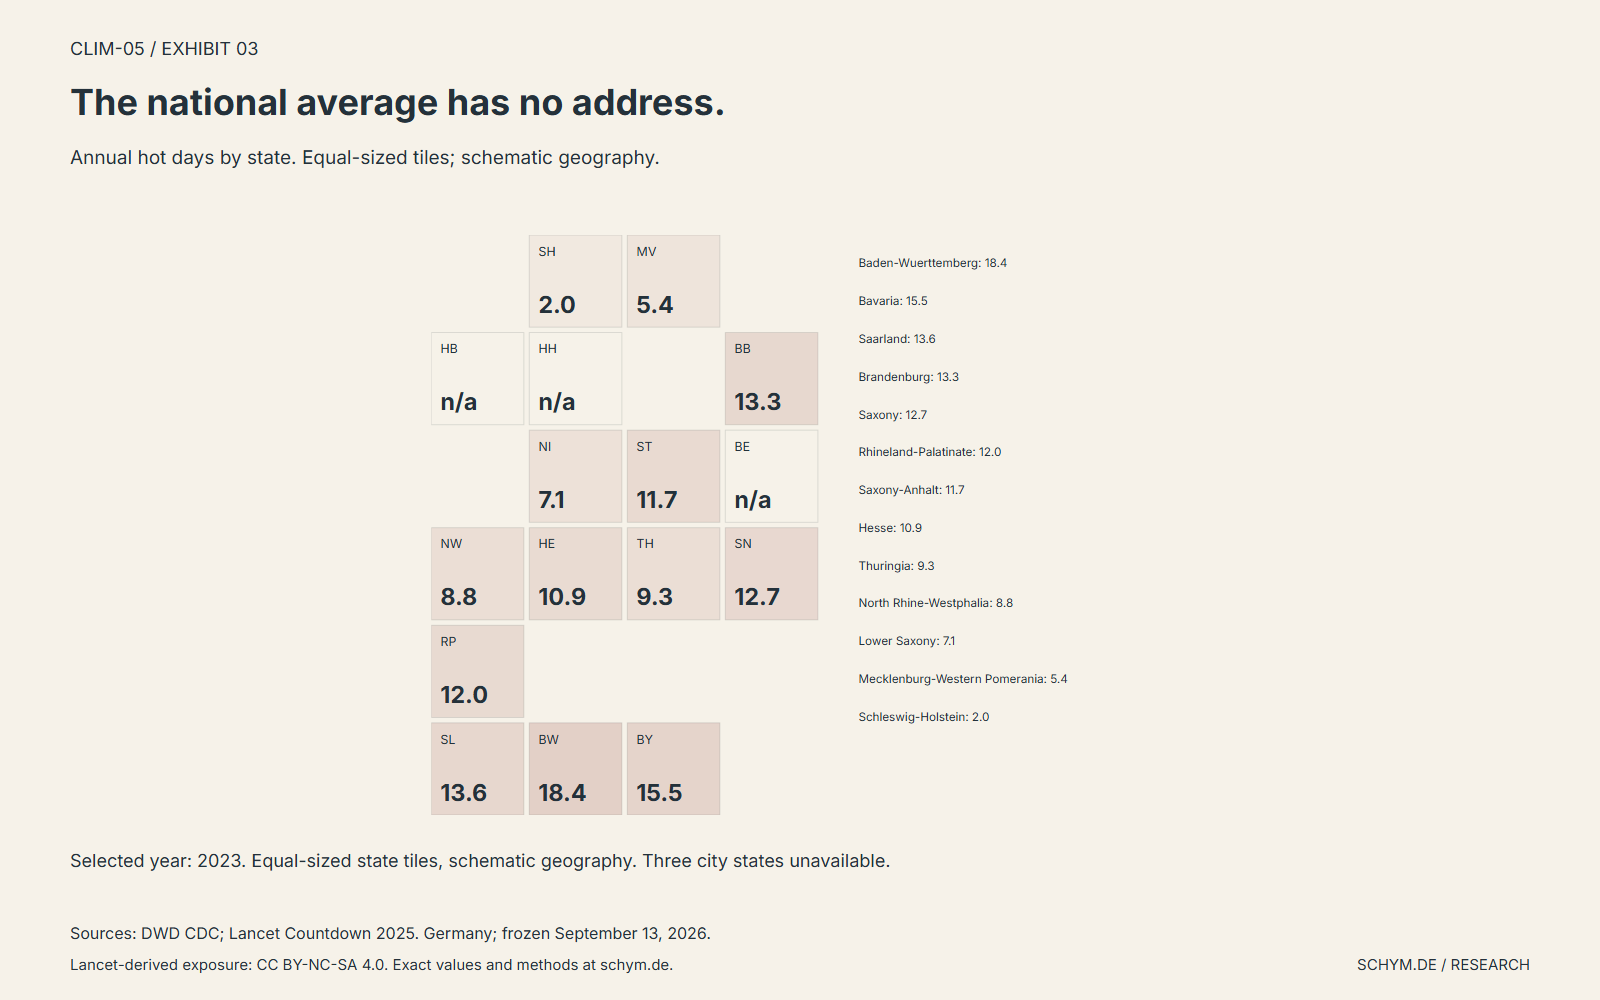
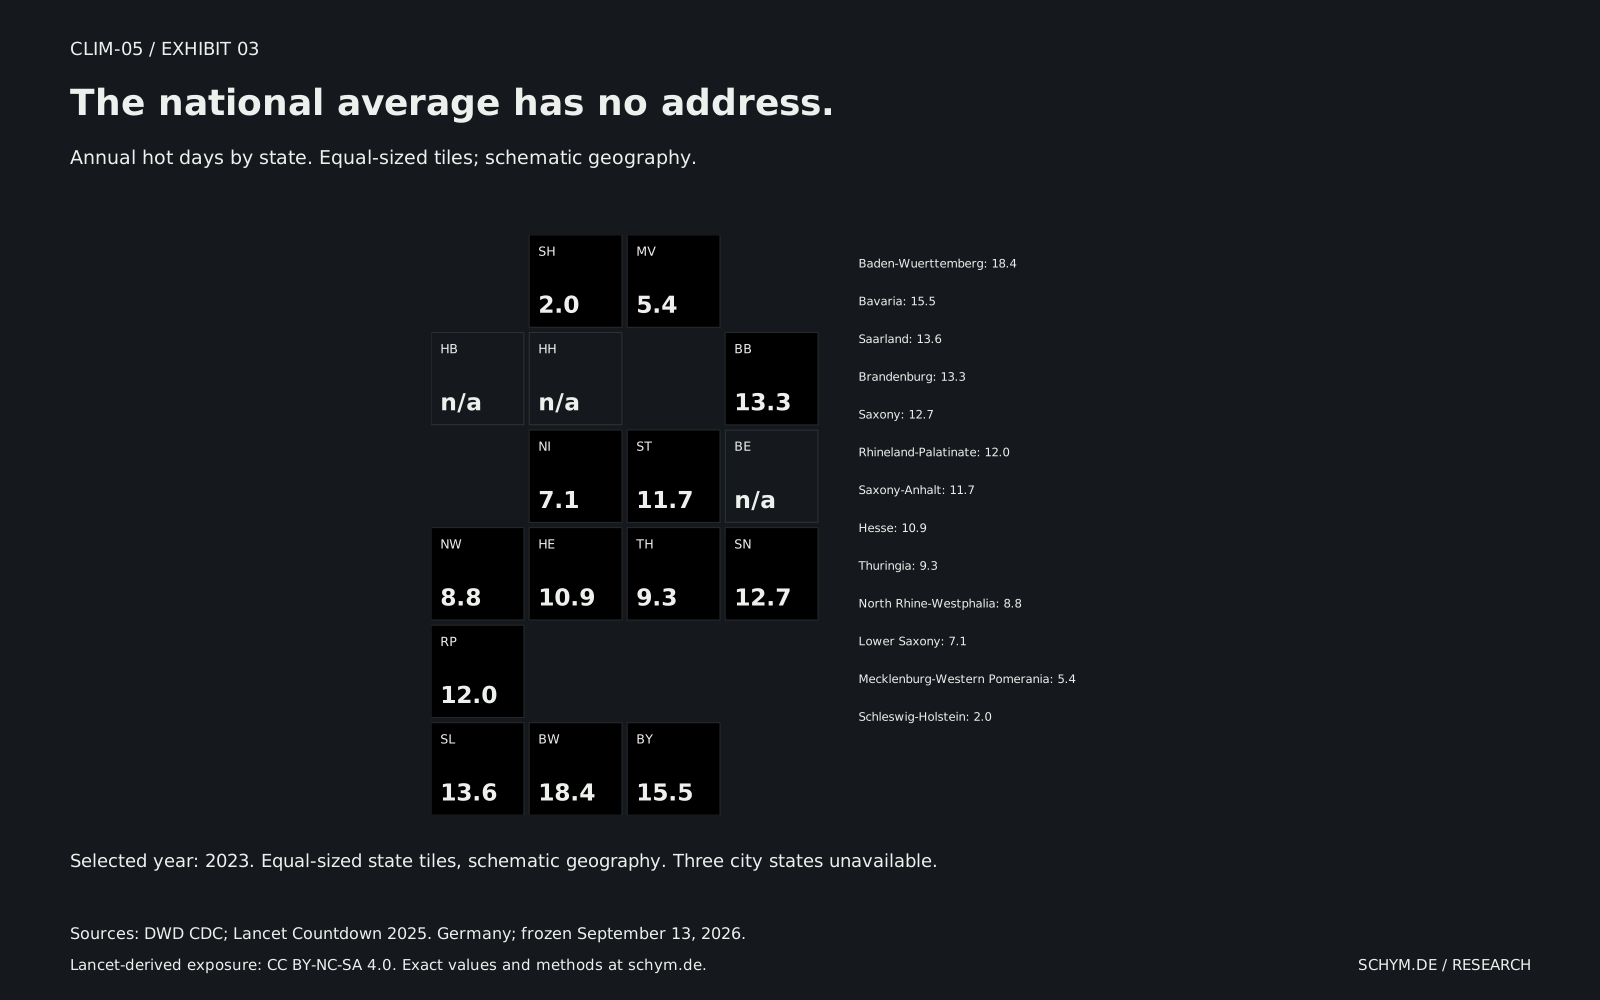
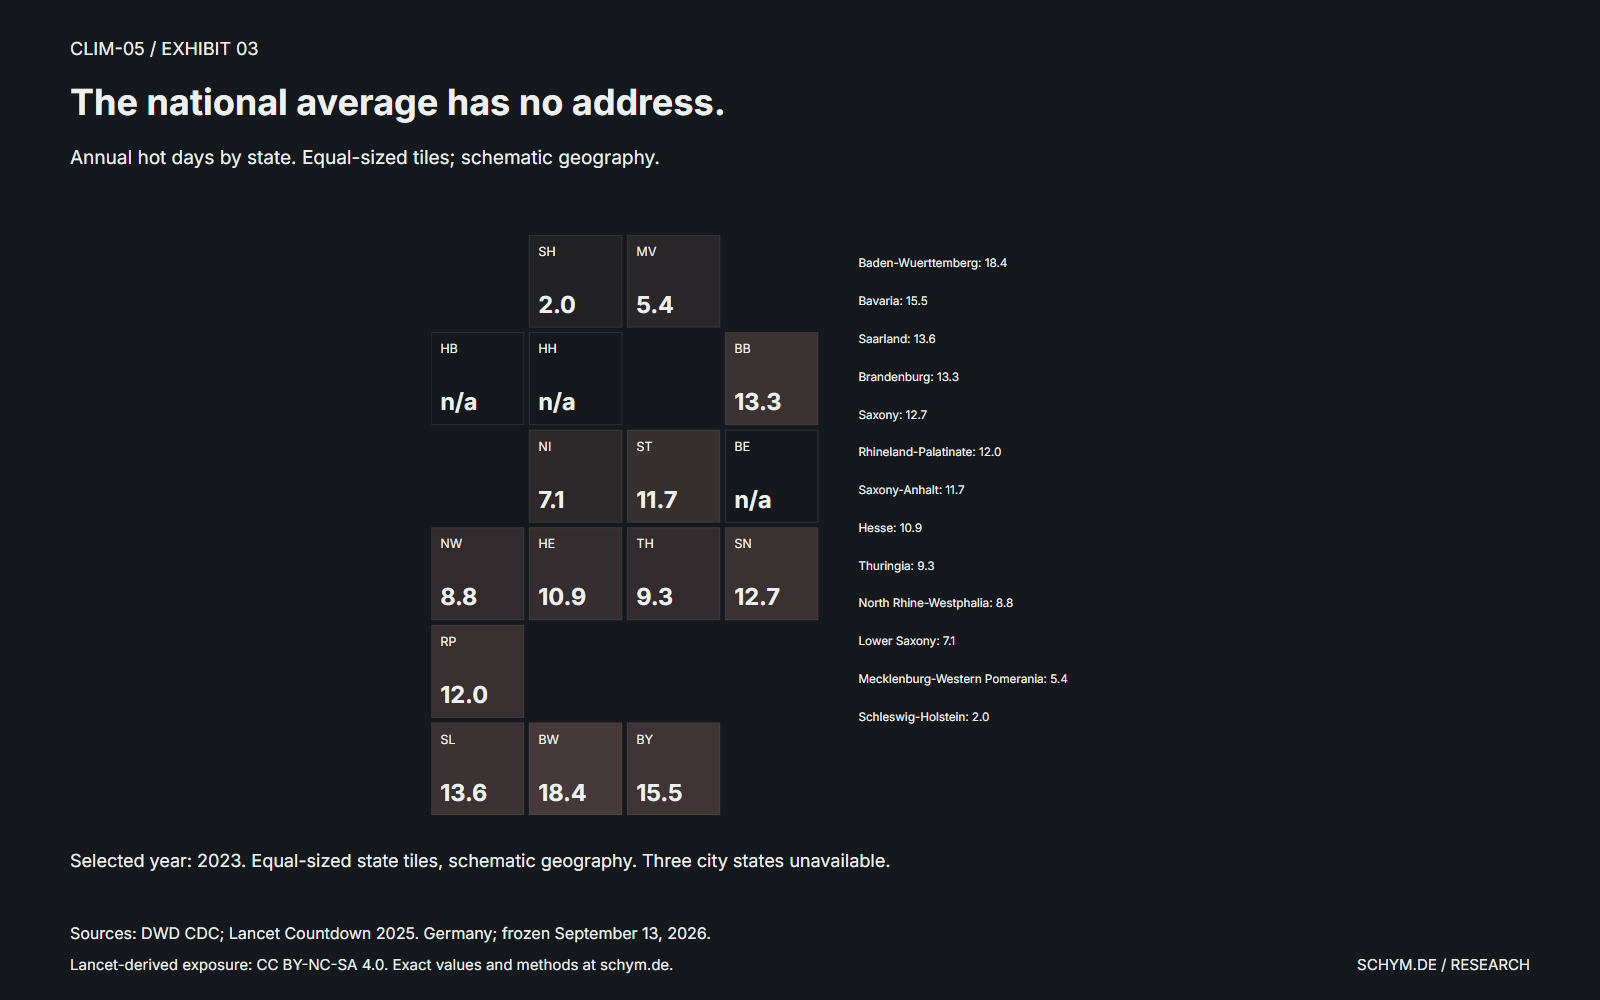
Exhibit 03
The national average has no address.
Annual hot days by state. Equal-sized tiles; schematic geography.
2023 / hot days
DWD; Lancet Countdown 2025. Germany. Source snapshot: September 13, 2026.
Exact values
| State | Year | Hot days |
|---|---|---|
| Baden-Wuerttemberg | 1980 | 2.05 |
| Baden-Wuerttemberg | 1981 | 2.23 |
| Baden-Wuerttemberg | 1982 | 4.13 |
| Baden-Wuerttemberg | 1983 | 12.75 |
| Baden-Wuerttemberg | 1984 | 4.7 |
| Baden-Wuerttemberg | 1985 | 4.37 |
| Baden-Wuerttemberg | 1986 | 3.74 |
| Baden-Wuerttemberg | 1987 | 2.78 |
| Baden-Wuerttemberg | 1988 | 3.44 |
| Baden-Wuerttemberg | 1989 | 4.55 |
| Baden-Wuerttemberg | 1990 | 7.34 |
| Baden-Wuerttemberg | 1991 | 7.23 |
| Baden-Wuerttemberg | 1992 | 11.86 |
| Baden-Wuerttemberg | 1993 | 3.63 |
| Baden-Wuerttemberg | 1994 | 12.41 |
| Baden-Wuerttemberg | 1995 | 9.05 |
| Baden-Wuerttemberg | 1996 | 2.69 |
| Baden-Wuerttemberg | 1997 | 3.91 |
| Baden-Wuerttemberg | 1998 | 11.21 |
| Baden-Wuerttemberg | 1999 | 5.02 |
| Baden-Wuerttemberg | 2000 | 5.64 |
| Baden-Wuerttemberg | 2001 | 9.38 |
| Baden-Wuerttemberg | 2002 | 6.12 |
| Baden-Wuerttemberg | 2003 | 26.6 |
| Baden-Wuerttemberg | 2004 | 7.21 |
| Baden-Wuerttemberg | 2005 | 10.47 |
| Baden-Wuerttemberg | 2006 | 14.8 |
| Baden-Wuerttemberg | 2007 | 4.78 |
| Baden-Wuerttemberg | 2008 | 5.39 |
| Baden-Wuerttemberg | 2009 | 6.9 |
| Baden-Wuerttemberg | 2010 | 11.23 |
| Baden-Wuerttemberg | 2011 | 7.62 |
| Baden-Wuerttemberg | 2012 | 11.01 |
| Baden-Wuerttemberg | 2013 | 12.77 |
| Baden-Wuerttemberg | 2014 | 6.81 |
| Baden-Wuerttemberg | 2015 | 25 |
| Baden-Wuerttemberg | 2016 | 10.14 |
| Baden-Wuerttemberg | 2017 | 13.27 |
| Baden-Wuerttemberg | 2018 | 21.48 |
| Baden-Wuerttemberg | 2019 | 17.51 |
| Baden-Wuerttemberg | 2020 | 12.75 |
| Baden-Wuerttemberg | 2021 | 4.81 |
| Baden-Wuerttemberg | 2022 | 21.69 |
| Baden-Wuerttemberg | 2023 | 18.36 |
| Baden-Wuerttemberg | 2024 | 14.66 |
| Bavaria | 1980 | 2.16 |
| Bavaria | 1981 | 1.62 |
| Bavaria | 1982 | 4.82 |
| Bavaria | 1983 | 11.02 |
| Bavaria | 1984 | 3.07 |
| Bavaria | 1985 | 3.59 |
| Bavaria | 1986 | 3.03 |
| Bavaria | 1987 | 1.39 |
| Bavaria | 1988 | 3.18 |
| Bavaria | 1989 | 2.7 |
| Bavaria | 1990 | 5.07 |
| Bavaria | 1991 | 4.54 |
| Bavaria | 1992 | 11.28 |
| Bavaria | 1993 | 2.99 |
| Bavaria | 1994 | 16.99 |
| Bavaria | 1995 | 7.74 |
| Bavaria | 1996 | 2.47 |
| Bavaria | 1997 | 2.05 |
| Bavaria | 1998 | 9.55 |
| Bavaria | 1999 | 3.57 |
| Bavaria | 2000 | 6.15 |
| Bavaria | 2001 | 7.78 |
| Bavaria | 2002 | 6.21 |
| Bavaria | 2003 | 24.27 |
| Bavaria | 2004 | 5.08 |
| Bavaria | 2005 | 8.25 |
| Bavaria | 2006 | 12.14 |
| Bavaria | 2007 | 5.14 |
| Bavaria | 2008 | 7.06 |
| Bavaria | 2009 | 3.96 |
| Bavaria | 2010 | 10.03 |
| Bavaria | 2011 | 5.63 |
| Bavaria | 2012 | 9.49 |
| Bavaria | 2013 | 14.07 |
| Bavaria | 2014 | 6.57 |
| Bavaria | 2015 | 25.6 |
| Bavaria | 2016 | 7.67 |
| Bavaria | 2017 | 9.99 |
| Bavaria | 2018 | 18.14 |
| Bavaria | 2019 | 15.21 |
| Bavaria | 2020 | 9.11 |
| Bavaria | 2021 | 4.64 |
| Bavaria | 2022 | 15.9 |
| Bavaria | 2023 | 15.48 |
| Bavaria | 2024 | 13.39 |
| Brandenburg | 1980 | 1.61 |
| Brandenburg | 1981 | 3.34 |
| Brandenburg | 1982 | 11.51 |
| Brandenburg | 1983 | 11.48 |
| Brandenburg | 1984 | 4.11 |
| Brandenburg | 1985 | 3 |
| Brandenburg | 1986 | 7.73 |
| Brandenburg | 1987 | 1.79 |
| Brandenburg | 1988 | 2.42 |
| Brandenburg | 1989 | 9.22 |
| Brandenburg | 1990 | 6.57 |
| Brandenburg | 1991 | 7.13 |
| Brandenburg | 1992 | 15.29 |
| Brandenburg | 1993 | 2.16 |
| Brandenburg | 1994 | 20.75 |
| Brandenburg | 1995 | 15.43 |
| Brandenburg | 1996 | 3.53 |
| Brandenburg | 1997 | 9.41 |
| Brandenburg | 1998 | 6.4 |
| Brandenburg | 1999 | 7.15 |
| Brandenburg | 2000 | 9.44 |
| Brandenburg | 2001 | 9.12 |
| Brandenburg | 2002 | 7.91 |
| Brandenburg | 2003 | 18.6 |
| Brandenburg | 2004 | 4.22 |
| Brandenburg | 2005 | 7.5 |
| Brandenburg | 2006 | 22.01 |
| Brandenburg | 2007 | 8.04 |
| Brandenburg | 2008 | 12.95 |
| Brandenburg | 2009 | 6.21 |
| Brandenburg | 2010 | 13.9 |
| Brandenburg | 2011 | 5.53 |
| Brandenburg | 2012 | 10.72 |
| Brandenburg | 2013 | 10.46 |
| Brandenburg | 2014 | 12.55 |
| Brandenburg | 2015 | 19.9 |
| Brandenburg | 2016 | 11.31 |
| Brandenburg | 2017 | 5.59 |
| Brandenburg | 2018 | 28.42 |
| Brandenburg | 2019 | 25.24 |
| Brandenburg | 2020 | 16.31 |
| Brandenburg | 2021 | 9.19 |
| Brandenburg | 2022 | 19.73 |
| Brandenburg | 2023 | 13.3 |
| Brandenburg | 2024 | 19.62 |
| Hesse | 1980 | 1.01 |
| Hesse | 1981 | 2.16 |
| Hesse | 1982 | 6.24 |
| Hesse | 1983 | 10.09 |
| Hesse | 1984 | 3.85 |
| Hesse | 1985 | 1.78 |
| Hesse | 1986 | 4.14 |
| Hesse | 1987 | 1.53 |
| Hesse | 1988 | 2.16 |
| Hesse | 1989 | 4.46 |
| Hesse | 1990 | 7.67 |
| Hesse | 1991 | 6.82 |
| Hesse | 1992 | 7.79 |
| Hesse | 1993 | 2.73 |
| Hesse | 1994 | 16.41 |
| Hesse | 1995 | 10.85 |
| Hesse | 1996 | 2.78 |
| Hesse | 1997 | 5.37 |
| Hesse | 1998 | 8.34 |
| Hesse | 1999 | 5.15 |
| Hesse | 2000 | 4.9 |
| Hesse | 2001 | 9.26 |
| Hesse | 2002 | 5.61 |
| Hesse | 2003 | 20.31 |
| Hesse | 2004 | 6.54 |
| Hesse | 2005 | 9.65 |
| Hesse | 2006 | 14.61 |
| Hesse | 2007 | 3.89 |
| Hesse | 2008 | 7.11 |
| Hesse | 2009 | 5.27 |
| Hesse | 2010 | 10.88 |
| Hesse | 2011 | 4.03 |
| Hesse | 2012 | 7.15 |
| Hesse | 2013 | 10.95 |
| Hesse | 2014 | 5.47 |
| Hesse | 2015 | 19 |
| Hesse | 2016 | 10.69 |
| Hesse | 2017 | 7.52 |
| Hesse | 2018 | 23.65 |
| Hesse | 2019 | 17.44 |
| Hesse | 2020 | 11.37 |
| Hesse | 2021 | 4.07 |
| Hesse | 2022 | 20.55 |
| Hesse | 2023 | 10.89 |
| Hesse | 2024 | 11.78 |
| Mecklenburg-Western Pomerania | 1980 | 0.37 |
| Mecklenburg-Western Pomerania | 1981 | 0.99 |
| Mecklenburg-Western Pomerania | 1982 | 6.33 |
| Mecklenburg-Western Pomerania | 1983 | 3.88 |
| Mecklenburg-Western Pomerania | 1984 | 1.46 |
| Mecklenburg-Western Pomerania | 1985 | 0.74 |
| Mecklenburg-Western Pomerania | 1986 | 3.27 |
| Mecklenburg-Western Pomerania | 1987 | 0.91 |
| Mecklenburg-Western Pomerania | 1988 | 0.22 |
| Mecklenburg-Western Pomerania | 1989 | 4.98 |
| Mecklenburg-Western Pomerania | 1990 | 2.35 |
| Mecklenburg-Western Pomerania | 1991 | 2.78 |
| Mecklenburg-Western Pomerania | 1992 | 8.08 |
| Mecklenburg-Western Pomerania | 1993 | 0.14 |
| Mecklenburg-Western Pomerania | 1994 | 13.84 |
| Mecklenburg-Western Pomerania | 1995 | 7.18 |
| Mecklenburg-Western Pomerania | 1996 | 2.53 |
| Mecklenburg-Western Pomerania | 1997 | 5.99 |
| Mecklenburg-Western Pomerania | 1998 | 1.34 |
| Mecklenburg-Western Pomerania | 1999 | 3.66 |
| Mecklenburg-Western Pomerania | 2000 | 4.63 |
| Mecklenburg-Western Pomerania | 2001 | 4.14 |
| Mecklenburg-Western Pomerania | 2002 | 5.23 |
| Mecklenburg-Western Pomerania | 2003 | 8.07 |
| Mecklenburg-Western Pomerania | 2004 | 1.11 |
| Mecklenburg-Western Pomerania | 2005 | 3.56 |
| Mecklenburg-Western Pomerania | 2006 | 10.72 |
| Mecklenburg-Western Pomerania | 2007 | 2.5 |
| Mecklenburg-Western Pomerania | 2008 | 6.19 |
| Mecklenburg-Western Pomerania | 2009 | 3.02 |
| Mecklenburg-Western Pomerania | 2010 | 9.03 |
| Mecklenburg-Western Pomerania | 2011 | 1.44 |
| Mecklenburg-Western Pomerania | 2012 | 4.45 |
| Mecklenburg-Western Pomerania | 2013 | 5.69 |
| Mecklenburg-Western Pomerania | 2014 | 3.2 |
| Mecklenburg-Western Pomerania | 2015 | 7.7 |
| Mecklenburg-Western Pomerania | 2016 | 5.99 |
| Mecklenburg-Western Pomerania | 2017 | 0.7 |
| Mecklenburg-Western Pomerania | 2018 | 15.51 |
| Mecklenburg-Western Pomerania | 2019 | 13.15 |
| Mecklenburg-Western Pomerania | 2020 | 8.91 |
| Mecklenburg-Western Pomerania | 2021 | 4.72 |
| Mecklenburg-Western Pomerania | 2022 | 12.18 |
| Mecklenburg-Western Pomerania | 2023 | 5.37 |
| Mecklenburg-Western Pomerania | 2024 | 9.66 |
| Lower Saxony | 1980 | 0.58 |
| Lower Saxony | 1981 | 2.22 |
| Lower Saxony | 1982 | 7.52 |
| Lower Saxony | 1983 | 8.74 |
| Lower Saxony | 1984 | 2.18 |
| Lower Saxony | 1985 | 2.01 |
| Lower Saxony | 1986 | 4.56 |
| Lower Saxony | 1987 | 1.25 |
| Lower Saxony | 1988 | 0.32 |
| Lower Saxony | 1989 | 3.7 |
| Lower Saxony | 1990 | 4.57 |
| Lower Saxony | 1991 | 3.41 |
| Lower Saxony | 1992 | 6.12 |
| Lower Saxony | 1993 | 0.24 |
| Lower Saxony | 1994 | 15.83 |
| Lower Saxony | 1995 | 11.46 |
| Lower Saxony | 1996 | 3.55 |
| Lower Saxony | 1997 | 6.04 |
| Lower Saxony | 1998 | 4.31 |
| Lower Saxony | 1999 | 6.55 |
| Lower Saxony | 2000 | 4.17 |
| Lower Saxony | 2001 | 4.99 |
| Lower Saxony | 2002 | 6.14 |
| Lower Saxony | 2003 | 13.53 |
| Lower Saxony | 2004 | 4.59 |
| Lower Saxony | 2005 | 5.62 |
| Lower Saxony | 2006 | 13.08 |
| Lower Saxony | 2007 | 4.03 |
| Lower Saxony | 2008 | 7.05 |
| Lower Saxony | 2009 | 4.22 |
| Lower Saxony | 2010 | 10.36 |
| Lower Saxony | 2011 | 2.46 |
| Lower Saxony | 2012 | 4.54 |
| Lower Saxony | 2013 | 7.94 |
| Lower Saxony | 2014 | 3.69 |
| Lower Saxony | 2015 | 8.8 |
| Lower Saxony | 2016 | 8.79 |
| Lower Saxony | 2017 | 2.28 |
| Lower Saxony | 2018 | 18.95 |
| Lower Saxony | 2019 | 15.41 |
| Lower Saxony | 2020 | 10.09 |
| Lower Saxony | 2021 | 2.86 |
| Lower Saxony | 2022 | 15.51 |
| Lower Saxony | 2023 | 7.11 |
| Lower Saxony | 2024 | 7.43 |
| North Rhine-Westphalia | 1980 | 1.46 |
| North Rhine-Westphalia | 1981 | 2.94 |
| North Rhine-Westphalia | 1982 | 6.64 |
| North Rhine-Westphalia | 1983 | 9.45 |
| North Rhine-Westphalia | 1984 | 4.1 |
| North Rhine-Westphalia | 1985 | 2.33 |
| North Rhine-Westphalia | 1986 | 4.44 |
| North Rhine-Westphalia | 1987 | 2.27 |
| North Rhine-Westphalia | 1988 | 0.98 |
| North Rhine-Westphalia | 1989 | 5.09 |
| North Rhine-Westphalia | 1990 | 6.57 |
| North Rhine-Westphalia | 1991 | 5.33 |
| North Rhine-Westphalia | 1992 | 6.88 |
| North Rhine-Westphalia | 1993 | 0.89 |
| North Rhine-Westphalia | 1994 | 16.24 |
| North Rhine-Westphalia | 1995 | 12.99 |
| North Rhine-Westphalia | 1996 | 3.16 |
| North Rhine-Westphalia | 1997 | 5.37 |
| North Rhine-Westphalia | 1998 | 6.51 |
| North Rhine-Westphalia | 1999 | 7.34 |
| North Rhine-Westphalia | 2000 | 4.36 |
| North Rhine-Westphalia | 2001 | 7.35 |
| North Rhine-Westphalia | 2002 | 6.14 |
| North Rhine-Westphalia | 2003 | 16.39 |
| North Rhine-Westphalia | 2004 | 4.77 |
| North Rhine-Westphalia | 2005 | 6.42 |
| North Rhine-Westphalia | 2006 | 14.48 |
| North Rhine-Westphalia | 2007 | 3.77 |
| North Rhine-Westphalia | 2008 | 4.33 |
| North Rhine-Westphalia | 2009 | 4.07 |
| North Rhine-Westphalia | 2010 | 11.13 |
| North Rhine-Westphalia | 2011 | 2.99 |
| North Rhine-Westphalia | 2012 | 4.73 |
| North Rhine-Westphalia | 2013 | 9.54 |
| North Rhine-Westphalia | 2014 | 3.81 |
| North Rhine-Westphalia | 2015 | 11.9 |
| North Rhine-Westphalia | 2016 | 10.32 |
| North Rhine-Westphalia | 2017 | 5.81 |
| North Rhine-Westphalia | 2018 | 17.45 |
| North Rhine-Westphalia | 2019 | 15.73 |
| North Rhine-Westphalia | 2020 | 11.93 |
| North Rhine-Westphalia | 2021 | 2.92 |
| North Rhine-Westphalia | 2022 | 17.67 |
| North Rhine-Westphalia | 2023 | 8.83 |
| North Rhine-Westphalia | 2024 | 8.31 |
| Rhineland-Palatinate | 1980 | 1.21 |
| Rhineland-Palatinate | 1981 | 2.63 |
| Rhineland-Palatinate | 1982 | 7.46 |
| Rhineland-Palatinate | 1983 | 12.16 |
| Rhineland-Palatinate | 1984 | 4.59 |
| Rhineland-Palatinate | 1985 | 2.33 |
| Rhineland-Palatinate | 1986 | 3.97 |
| Rhineland-Palatinate | 1987 | 2.11 |
| Rhineland-Palatinate | 1988 | 2.13 |
| Rhineland-Palatinate | 1989 | 5.04 |
| Rhineland-Palatinate | 1990 | 9.2 |
| Rhineland-Palatinate | 1991 | 8.54 |
| Rhineland-Palatinate | 1992 | 8.98 |
| Rhineland-Palatinate | 1993 | 3.14 |
| Rhineland-Palatinate | 1994 | 15.82 |
| Rhineland-Palatinate | 1995 | 12.29 |
| Rhineland-Palatinate | 1996 | 3.39 |
| Rhineland-Palatinate | 1997 | 5.86 |
| Rhineland-Palatinate | 1998 | 9.7 |
| Rhineland-Palatinate | 1999 | 6.49 |
| Rhineland-Palatinate | 2000 | 3.78 |
| Rhineland-Palatinate | 2001 | 10.13 |
| Rhineland-Palatinate | 2002 | 5.92 |
| Rhineland-Palatinate | 2003 | 22.01 |
| Rhineland-Palatinate | 2004 | 6.22 |
| Rhineland-Palatinate | 2005 | 11.56 |
| Rhineland-Palatinate | 2006 | 15.77 |
| Rhineland-Palatinate | 2007 | 4.94 |
| Rhineland-Palatinate | 2008 | 5.45 |
| Rhineland-Palatinate | 2009 | 5.84 |
| Rhineland-Palatinate | 2010 | 11.39 |
| Rhineland-Palatinate | 2011 | 5.02 |
| Rhineland-Palatinate | 2012 | 7.6 |
| Rhineland-Palatinate | 2013 | 10.58 |
| Rhineland-Palatinate | 2014 | 5.98 |
| Rhineland-Palatinate | 2015 | 19.5 |
| Rhineland-Palatinate | 2016 | 10.32 |
| Rhineland-Palatinate | 2017 | 10.65 |
| Rhineland-Palatinate | 2018 | 19.61 |
| Rhineland-Palatinate | 2019 | 18.35 |
| Rhineland-Palatinate | 2020 | 15.07 |
| Rhineland-Palatinate | 2021 | 3.98 |
| Rhineland-Palatinate | 2022 | 22.53 |
| Rhineland-Palatinate | 2023 | 11.95 |
| Rhineland-Palatinate | 2024 | 11.49 |
| Saarland | 1980 | 0.86 |
| Saarland | 1981 | 1.61 |
| Saarland | 1982 | 5.66 |
| Saarland | 1983 | 13.77 |
| Saarland | 1984 | 5.27 |
| Saarland | 1985 | 2.72 |
| Saarland | 1986 | 3.4 |
| Saarland | 1987 | 2.07 |
| Saarland | 1988 | 1.15 |
| Saarland | 1989 | 6.03 |
| Saarland | 1990 | 9.74 |
| Saarland | 1991 | 8.68 |
| Saarland | 1992 | 8.72 |
| Saarland | 1993 | 1.61 |
| Saarland | 1994 | 17.47 |
| Saarland | 1995 | 11.64 |
| Saarland | 1996 | 2.71 |
| Saarland | 1997 | 6.56 |
| Saarland | 1998 | 9.56 |
| Saarland | 1999 | 4.3 |
| Saarland | 2000 | 2.44 |
| Saarland | 2001 | 8.62 |
| Saarland | 2002 | 6.15 |
| Saarland | 2003 | 22.7 |
| Saarland | 2004 | 4.45 |
| Saarland | 2005 | 14.33 |
| Saarland | 2006 | 17.08 |
| Saarland | 2007 | 3.48 |
| Saarland | 2008 | 4.55 |
| Saarland | 2009 | 4.47 |
| Saarland | 2010 | 10.31 |
| Saarland | 2011 | 4.9 |
| Saarland | 2012 | 7.26 |
| Saarland | 2013 | 11.13 |
| Saarland | 2014 | 5.91 |
| Saarland | 2015 | 20.9 |
| Saarland | 2016 | 11.39 |
| Saarland | 2017 | 11.18 |
| Saarland | 2018 | 18.52 |
| Saarland | 2019 | 20.56 |
| Saarland | 2020 | 17.49 |
| Saarland | 2021 | 3.88 |
| Saarland | 2022 | 29.75 |
| Saarland | 2023 | 13.55 |
| Saarland | 2024 | 11.58 |
| Saxony | 1980 | 2.09 |
| Saxony | 1981 | 2.84 |
| Saxony | 1982 | 6.27 |
| Saxony | 1983 | 9.72 |
| Saxony | 1984 | 3.94 |
| Saxony | 1985 | 2.8 |
| Saxony | 1986 | 5.33 |
| Saxony | 1987 | 1.78 |
| Saxony | 1988 | 4.57 |
| Saxony | 1989 | 5.95 |
| Saxony | 1990 | 7.35 |
| Saxony | 1991 | 5.8 |
| Saxony | 1992 | 12.24 |
| Saxony | 1993 | 2.18 |
| Saxony | 1994 | 18.56 |
| Saxony | 1995 | 10.01 |
| Saxony | 1996 | 2.44 |
| Saxony | 1997 | 4.76 |
| Saxony | 1998 | 6.75 |
| Saxony | 1999 | 3.15 |
| Saxony | 2000 | 9.05 |
| Saxony | 2001 | 6.3 |
| Saxony | 2002 | 7 |
| Saxony | 2003 | 19.36 |
| Saxony | 2004 | 3.44 |
| Saxony | 2005 | 5.96 |
| Saxony | 2006 | 16.37 |
| Saxony | 2007 | 6.76 |
| Saxony | 2008 | 8.73 |
| Saxony | 2009 | 3.56 |
| Saxony | 2010 | 10.34 |
| Saxony | 2011 | 3.99 |
| Saxony | 2012 | 9.85 |
| Saxony | 2013 | 10.28 |
| Saxony | 2014 | 8.77 |
| Saxony | 2015 | 21.6 |
| Saxony | 2016 | 8.89 |
| Saxony | 2017 | 7.2 |
| Saxony | 2018 | 24.87 |
| Saxony | 2019 | 19.83 |
| Saxony | 2020 | 11.73 |
| Saxony | 2021 | 5.1 |
| Saxony | 2022 | 16.23 |
| Saxony | 2023 | 12.72 |
| Saxony | 2024 | 19.29 |
| Saxony-Anhalt | 1980 | 1.97 |
| Saxony-Anhalt | 1981 | 3.17 |
| Saxony-Anhalt | 1982 | 8.91 |
| Saxony-Anhalt | 1983 | 11.99 |
| Saxony-Anhalt | 1984 | 3.66 |
| Saxony-Anhalt | 1985 | 2.86 |
| Saxony-Anhalt | 1986 | 7.11 |
| Saxony-Anhalt | 1987 | 1.77 |
| Saxony-Anhalt | 1988 | 2.8 |
| Saxony-Anhalt | 1989 | 7.69 |
| Saxony-Anhalt | 1990 | 7.71 |
| Saxony-Anhalt | 1991 | 6.48 |
| Saxony-Anhalt | 1992 | 12.6 |
| Saxony-Anhalt | 1993 | 1.62 |
| Saxony-Anhalt | 1994 | 19.84 |
| Saxony-Anhalt | 1995 | 15.93 |
| Saxony-Anhalt | 1996 | 4.19 |
| Saxony-Anhalt | 1997 | 8.65 |
| Saxony-Anhalt | 1998 | 7.52 |
| Saxony-Anhalt | 1999 | 6.85 |
| Saxony-Anhalt | 2000 | 7.4 |
| Saxony-Anhalt | 2001 | 9.19 |
| Saxony-Anhalt | 2002 | 7.89 |
| Saxony-Anhalt | 2003 | 22.16 |
| Saxony-Anhalt | 2004 | 4.96 |
| Saxony-Anhalt | 2005 | 10.38 |
| Saxony-Anhalt | 2006 | 19.33 |
| Saxony-Anhalt | 2007 | 7.48 |
| Saxony-Anhalt | 2008 | 11.69 |
| Saxony-Anhalt | 2009 | 6.3 |
| Saxony-Anhalt | 2010 | 11.88 |
| Saxony-Anhalt | 2011 | 4.63 |
| Saxony-Anhalt | 2012 | 9.63 |
| Saxony-Anhalt | 2013 | 12.24 |
| Saxony-Anhalt | 2014 | 9.55 |
| Saxony-Anhalt | 2015 | 17.9 |
| Saxony-Anhalt | 2016 | 14.36 |
| Saxony-Anhalt | 2017 | 6.22 |
| Saxony-Anhalt | 2018 | 28.81 |
| Saxony-Anhalt | 2019 | 22.54 |
| Saxony-Anhalt | 2020 | 14.31 |
| Saxony-Anhalt | 2021 | 6.7 |
| Saxony-Anhalt | 2022 | 20.43 |
| Saxony-Anhalt | 2023 | 11.67 |
| Saxony-Anhalt | 2024 | 18.23 |
| Schleswig-Holstein | 1980 | 0.02 |
| Schleswig-Holstein | 1981 | 0.47 |
| Schleswig-Holstein | 1982 | 5.04 |
| Schleswig-Holstein | 1983 | 4.92 |
| Schleswig-Holstein | 1984 | 0.31 |
| Schleswig-Holstein | 1985 | 0.49 |
| Schleswig-Holstein | 1986 | 1.55 |
| Schleswig-Holstein | 1987 | 0.15 |
| Schleswig-Holstein | 1988 | 0.02 |
| Schleswig-Holstein | 1989 | 1.4 |
| Schleswig-Holstein | 1990 | 1.84 |
| Schleswig-Holstein | 1991 | 1.09 |
| Schleswig-Holstein | 1992 | 3.46 |
| Schleswig-Holstein | 1993 | 0.01 |
| Schleswig-Holstein | 1994 | 11.36 |
| Schleswig-Holstein | 1995 | 6.97 |
| Schleswig-Holstein | 1996 | 3.05 |
| Schleswig-Holstein | 1997 | 5.07 |
| Schleswig-Holstein | 1998 | 0.78 |
| Schleswig-Holstein | 1999 | 2.28 |
| Schleswig-Holstein | 2000 | 3.27 |
| Schleswig-Holstein | 2001 | 2.08 |
| Schleswig-Holstein | 2002 | 3.68 |
| Schleswig-Holstein | 2003 | 5.98 |
| Schleswig-Holstein | 2004 | 1.7 |
| Schleswig-Holstein | 2005 | 1.97 |
| Schleswig-Holstein | 2006 | 6.89 |
| Schleswig-Holstein | 2007 | 1.46 |
| Schleswig-Holstein | 2008 | 3.68 |
| Schleswig-Holstein | 2009 | 1.52 |
| Schleswig-Holstein | 2010 | 6.35 |
| Schleswig-Holstein | 2011 | 0.37 |
| Schleswig-Holstein | 2012 | 1.43 |
| Schleswig-Holstein | 2013 | 3 |
| Schleswig-Holstein | 2014 | 1.09 |
| Schleswig-Holstein | 2015 | 3.5 |
| Schleswig-Holstein | 2016 | 2.55 |
| Schleswig-Holstein | 2017 | 0.01 |
| Schleswig-Holstein | 2018 | 10.61 |
| Schleswig-Holstein | 2019 | 7.18 |
| Schleswig-Holstein | 2020 | 7.35 |
| Schleswig-Holstein | 2021 | 1.47 |
| Schleswig-Holstein | 2022 | 6.99 |
| Schleswig-Holstein | 2023 | 1.97 |
| Schleswig-Holstein | 2024 | 3.47 |
| Thuringia | 1980 | 1.76 |
| Thuringia | 1981 | 1.67 |
| Thuringia | 1982 | 5.1 |
| Thuringia | 1983 | 7.97 |
| Thuringia | 1984 | 3.01 |
| Thuringia | 1985 | 2.05 |
| Thuringia | 1986 | 3.77 |
| Thuringia | 1987 | 1.45 |
| Thuringia | 1988 | 2.45 |
| Thuringia | 1989 | 4.09 |
| Thuringia | 1990 | 5.93 |
| Thuringia | 1991 | 4.87 |
| Thuringia | 1992 | 8.14 |
| Thuringia | 1993 | 1.38 |
| Thuringia | 1994 | 15.86 |
| Thuringia | 1995 | 8.06 |
| Thuringia | 1996 | 2.52 |
| Thuringia | 1997 | 3.7 |
| Thuringia | 1998 | 6.84 |
| Thuringia | 1999 | 3.59 |
| Thuringia | 2000 | 5.24 |
| Thuringia | 2001 | 7.36 |
| Thuringia | 2002 | 5.87 |
| Thuringia | 2003 | 19.74 |
| Thuringia | 2004 | 3.41 |
| Thuringia | 2005 | 7.19 |
| Thuringia | 2006 | 13.03 |
| Thuringia | 2007 | 4.13 |
| Thuringia | 2008 | 8.33 |
| Thuringia | 2009 | 2.96 |
| Thuringia | 2010 | 9.3 |
| Thuringia | 2011 | 3.58 |
| Thuringia | 2012 | 7.49 |
| Thuringia | 2013 | 10.37 |
| Thuringia | 2014 | 5.68 |
| Thuringia | 2015 | 17.5 |
| Thuringia | 2016 | 9.99 |
| Thuringia | 2017 | 5.51 |
| Thuringia | 2018 | 20.17 |
| Thuringia | 2019 | 16.81 |
| Thuringia | 2020 | 9.48 |
| Thuringia | 2021 | 3.41 |
| Thuringia | 2022 | 15.62 |
| Thuringia | 2023 | 9.25 |
| Thuringia | 2024 | 13.6 |
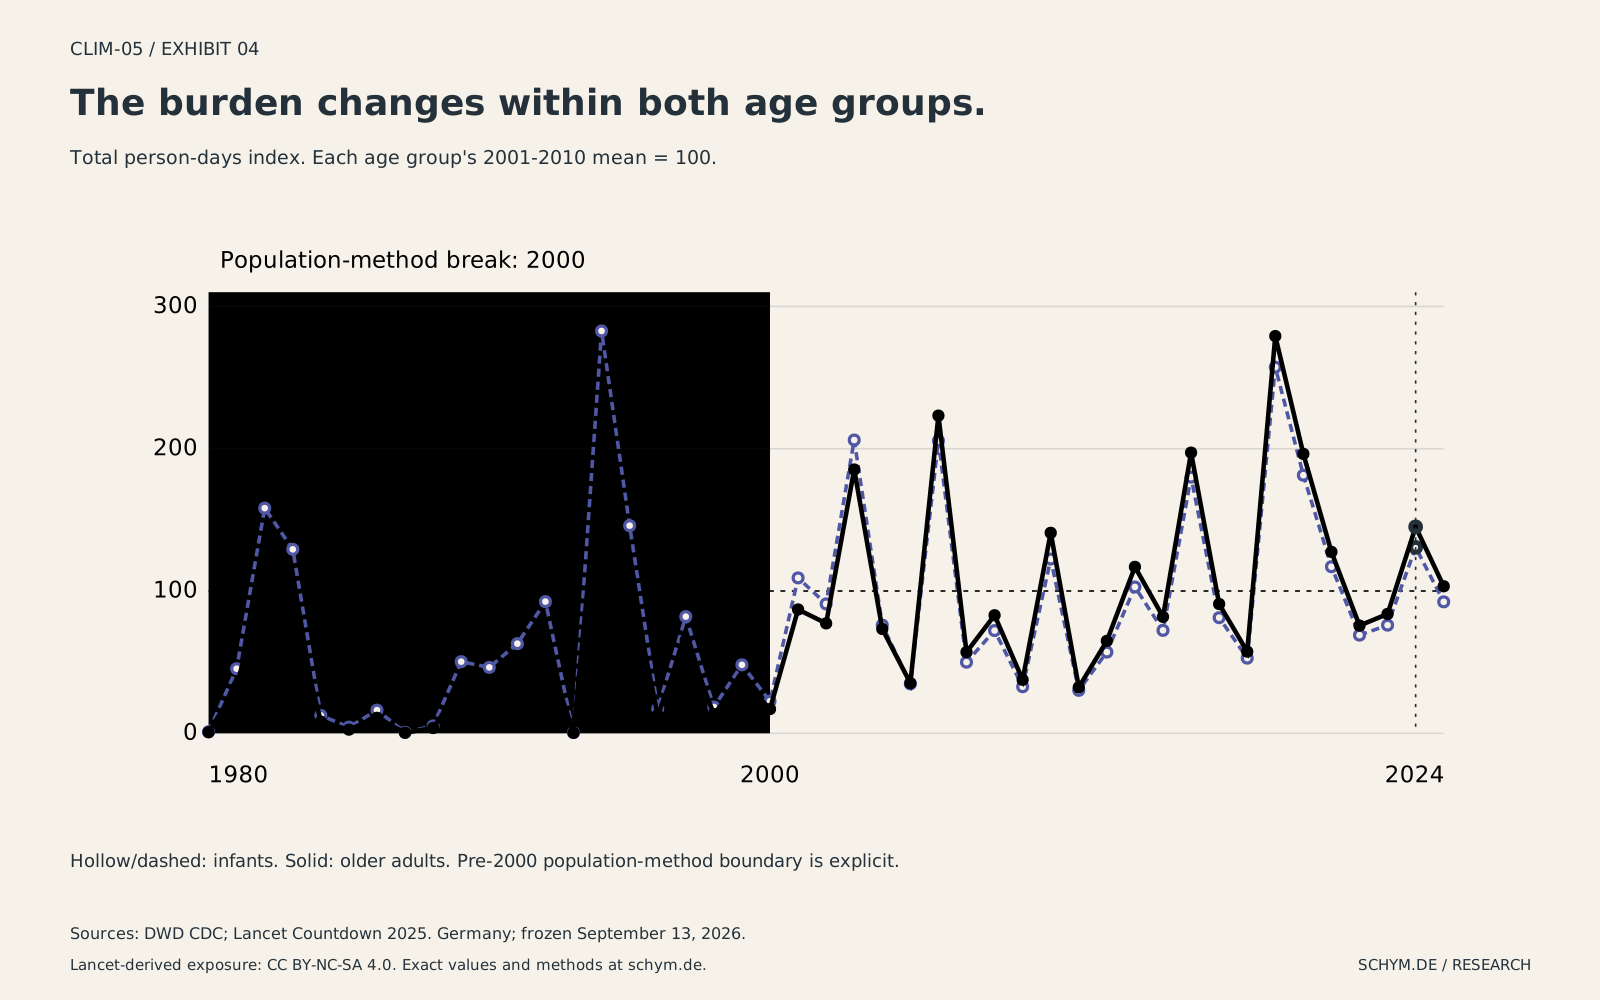
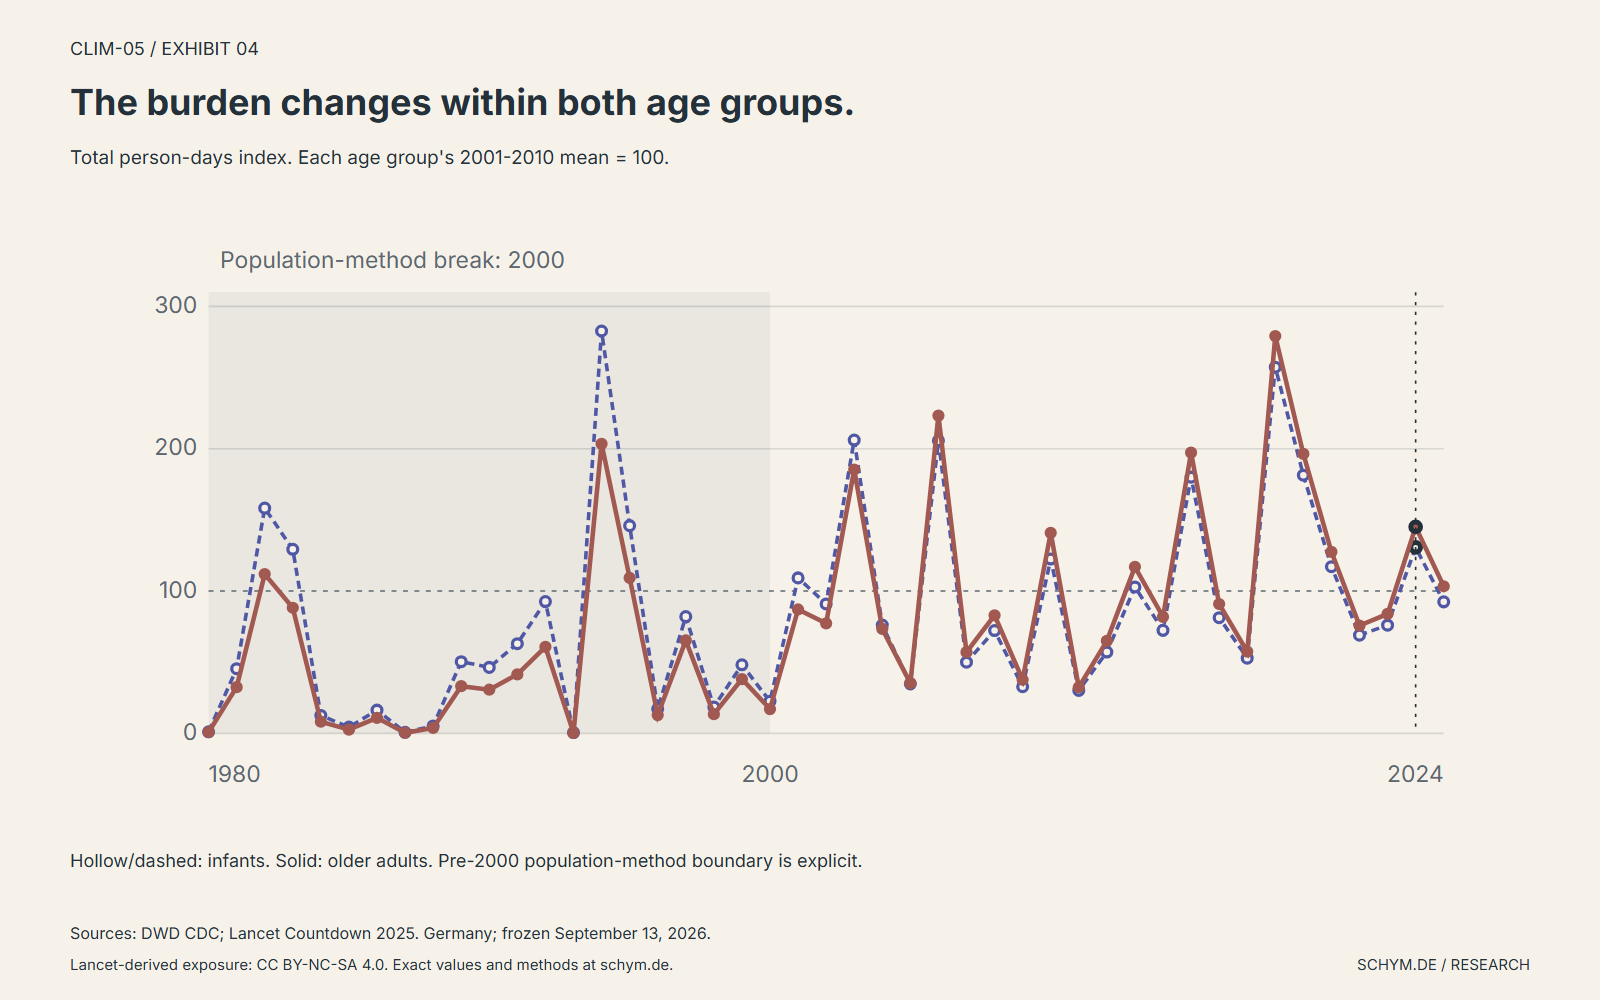
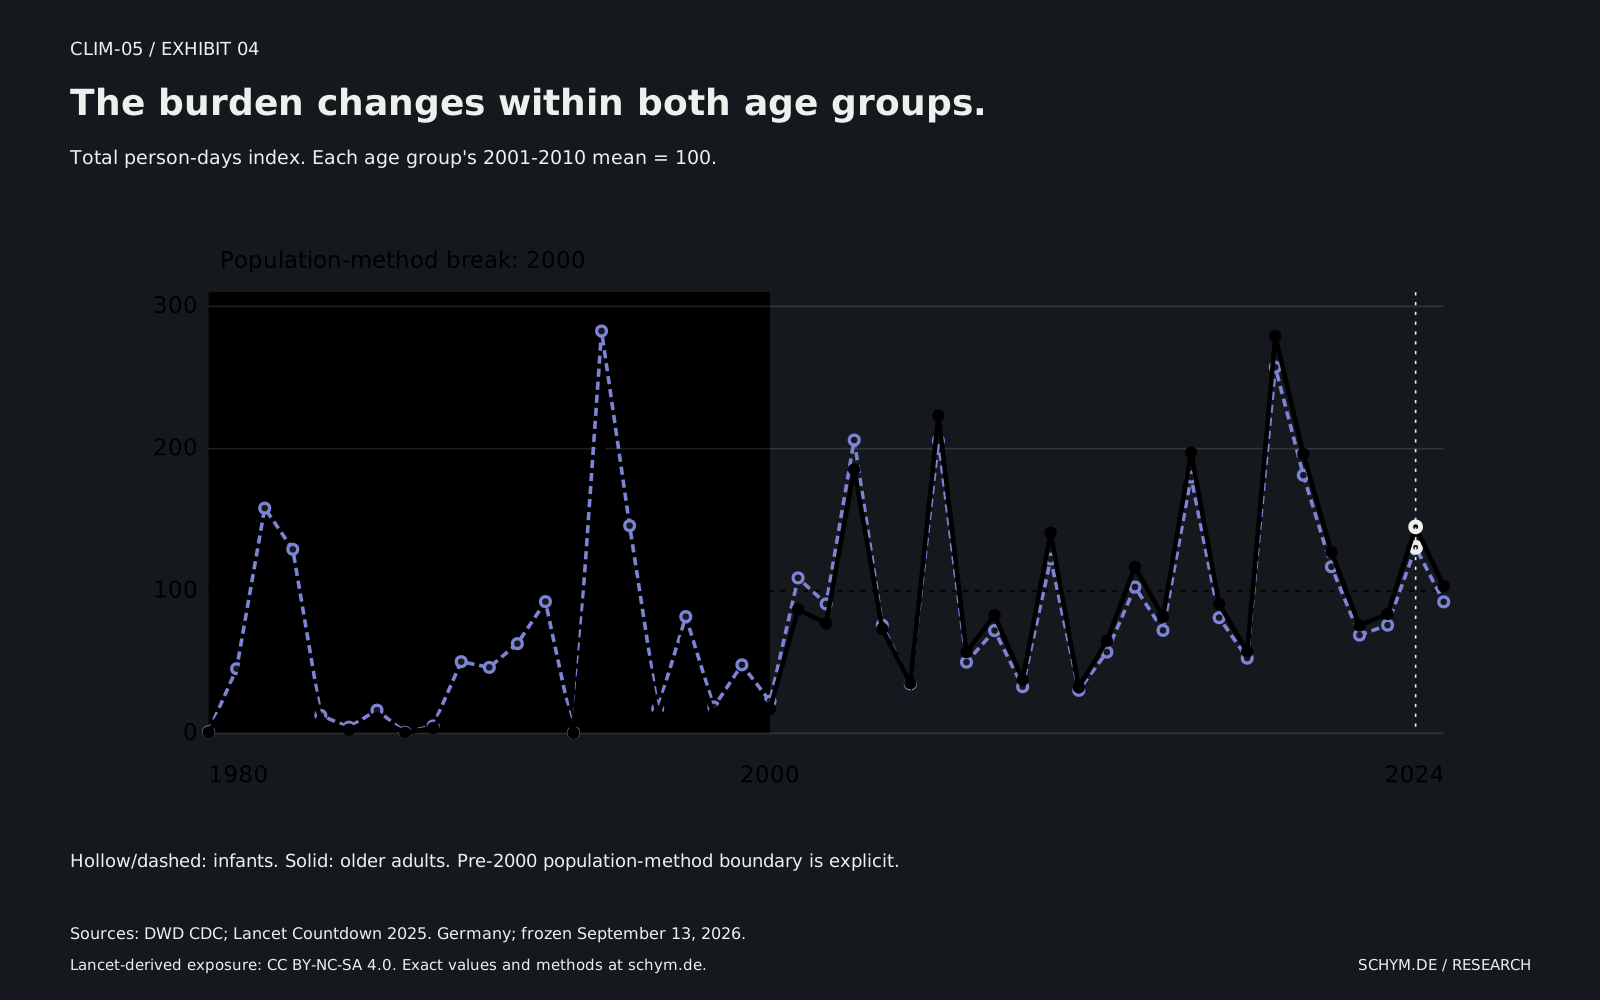
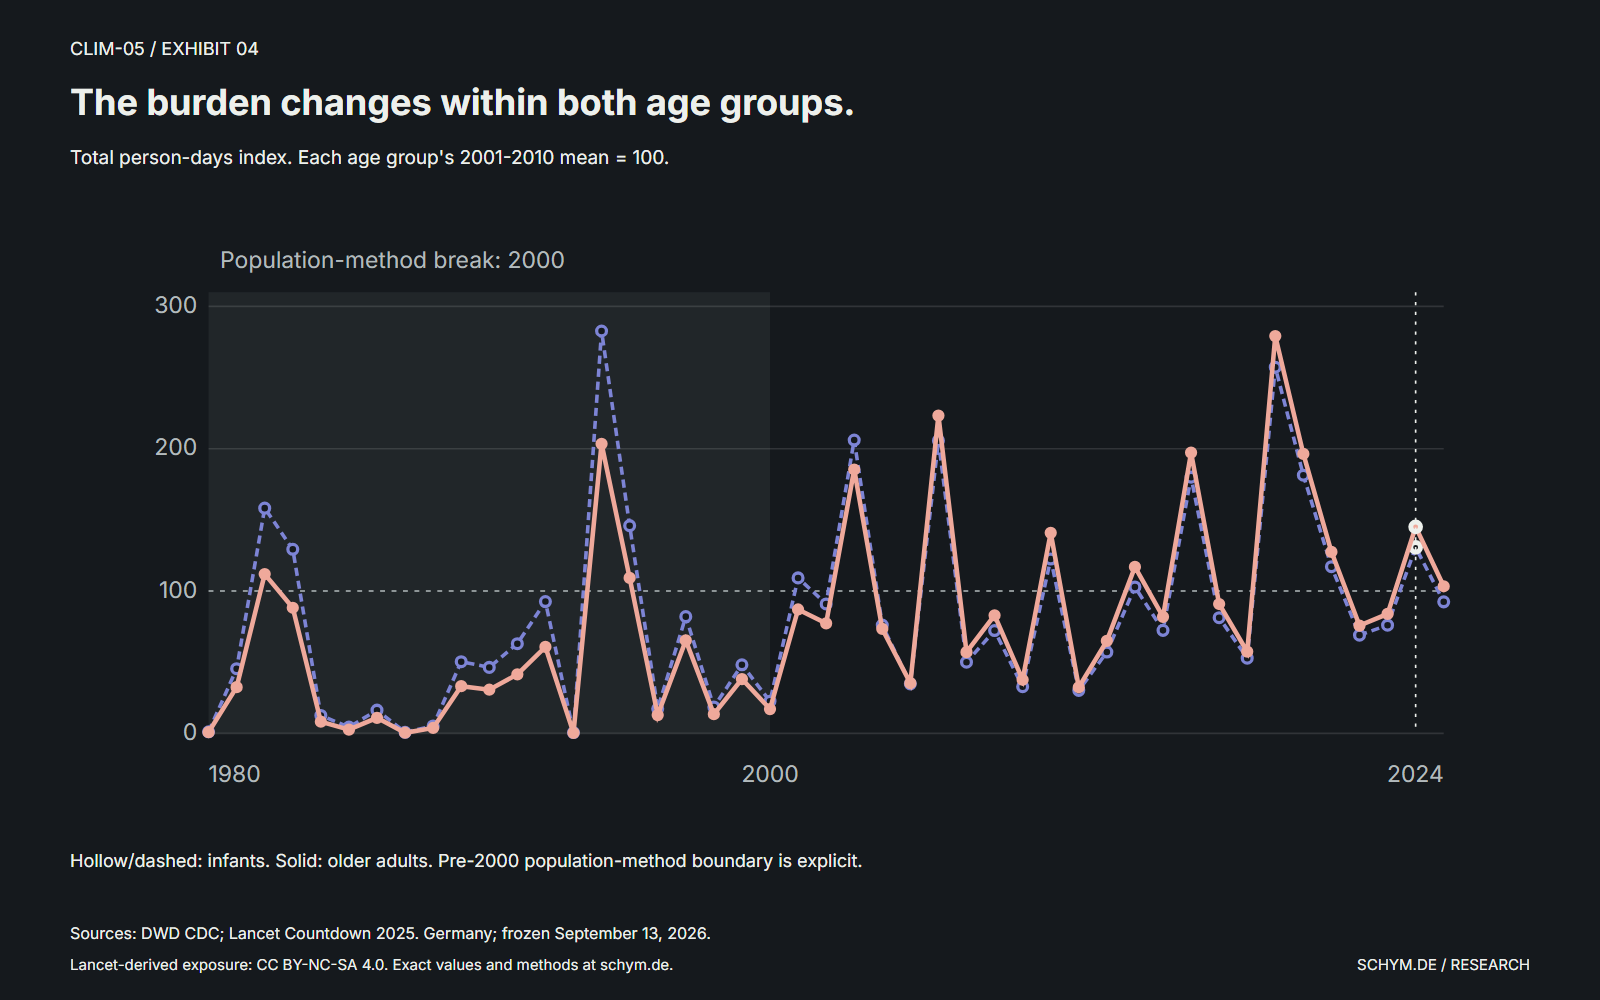
Exhibit 04
The burden changes within both age groups.
Total person-days index. Each age group's 2001-2010 mean = 100.
DWD; Lancet Countdown 2025. Germany. Source snapshot: September 13, 2026.
Exact values
| Year | Infant person-days | Older person-days | Infant index | Older index |
|---|---|---|---|---|
| 1980 | 51,142.189 | 761,346.991 | 1.089 | 0.755 |
| 1981 | 2,131,848.091 | 32,742,264.790 | 45.410 | 32.454 |
| 1982 | 7,429,057.147 | 112,877,703.433 | 158.244 | 111.885 |
| 1983 | 6,069,851.729 | 88,991,052.826 | 129.292 | 88.208 |
| 1984 | 589,563.503 | 8,221,938.739 | 12.558 | 8.150 |
| 1985 | 203,388.274 | 2,612,095.749 | 4.332 | 2.589 |
| 1986 | 764,168.244 | 10,971,457.356 | 16.277 | 10.875 |
| 1987 | 33,172.259 | 401,084.342 | 0.707 | 0.398 |
| 1988 | 243,250.420 | 3,783,559.318 | 5.181 | 3.750 |
| 1989 | 2,363,668.063 | 33,407,486.475 | 50.348 | 33.114 |
| 1990 | 2,174,495.544 | 30,887,232.868 | 46.318 | 30.616 |
| 1991 | 2,957,638.192 | 41,795,886.347 | 63.000 | 41.428 |
| 1992 | 4,345,265.878 | 61,238,078.979 | 92.557 | 60.700 |
| 1993 | 25,658.116 | 329,187.798 | 0.547 | 0.326 |
| 1994 | 13,272,963.782 | 205,246,313.257 | 282.724 | 203.441 |
| 1995 | 6,850,710.902 | 110,186,969.968 | 145.925 | 109.218 |
| 1996 | 809,613.623 | 12,901,854.849 | 17.245 | 12.788 |
| 1997 | 3,849,494.707 | 65,882,116.315 | 81.997 | 65.303 |
| 1998 | 869,533.001 | 13,585,851.950 | 18.522 | 13.466 |
| 1999 | 2,259,628.601 | 38,461,467.702 | 48.132 | 38.123 |
| 2000 | 1,058,040.547 | 17,204,649.294 | 22.537 | 17.053 |
| 2001 | 5,127,156.201 | 87,794,586.114 | 109.212 | 87.022 |
| 2002 | 4,268,472.431 | 77,942,318.138 | 90.922 | 77.257 |
| 2003 | 9,675,768.879 | 187,023,539.276 | 206.101 | 185.379 |
| 2004 | 3,569,312.096 | 73,996,356.786 | 76.029 | 73.346 |
| 2005 | 1,630,978.893 | 35,563,417.348 | 34.741 | 35.251 |
| 2006 | 9,653,500.170 | 225,243,185.157 | 205.627 | 223.262 |
| 2007 | 2,346,693.299 | 57,544,558.547 | 49.986 | 57.038 |
| 2008 | 3,389,598.531 | 83,691,502.366 | 72.201 | 82.955 |
| 2009 | 1,536,803.406 | 37,942,816.005 | 32.735 | 37.609 |
| 2010 | 5,748,441.165 | 142,130,063.130 | 122.446 | 140.880 |
| 2011 | 1,417,000.101 | 32,645,429.103 | 30.183 | 32.358 |
| 2012 | 2,679,918.106 | 65,513,103.183 | 57.084 | 64.937 |
| 2013 | 4,827,483.217 | 117,998,765.190 | 102.829 | 116.961 |
| 2014 | 3,396,053.488 | 82,577,848.670 | 72.338 | 81.852 |
| 2015 | 8,451,096.066 | 199,003,878.258 | 180.015 | 197.254 |
| 2016 | 3,815,190.522 | 91,676,514.213 | 81.266 | 90.870 |
| 2017 | 2,479,878.330 | 57,913,944.481 | 52.823 | 57.405 |
| 2018 | 12,079,455.150 | 281,631,476.201 | 257.301 | 279.155 |
| 2019 | 8,514,420.119 | 198,091,819.744 | 181.363 | 196.350 |
| 2020 | 5,495,902.310 | 128,624,486.686 | 117.067 | 127.493 |
| 2021 | 3,239,196.157 | 76,376,382.497 | 68.997 | 75.705 |
| 2022 | 3,568,293.009 | 84,621,606.012 | 76.007 | 83.877 |
| 2023 | 6,134,499.140 | 146,376,791.525 | 130.669 | 145.090 |
| 2024 | 4,337,038.914 | 104,248,407.765 | 92.382 | 103.332 |
Exhibit 05
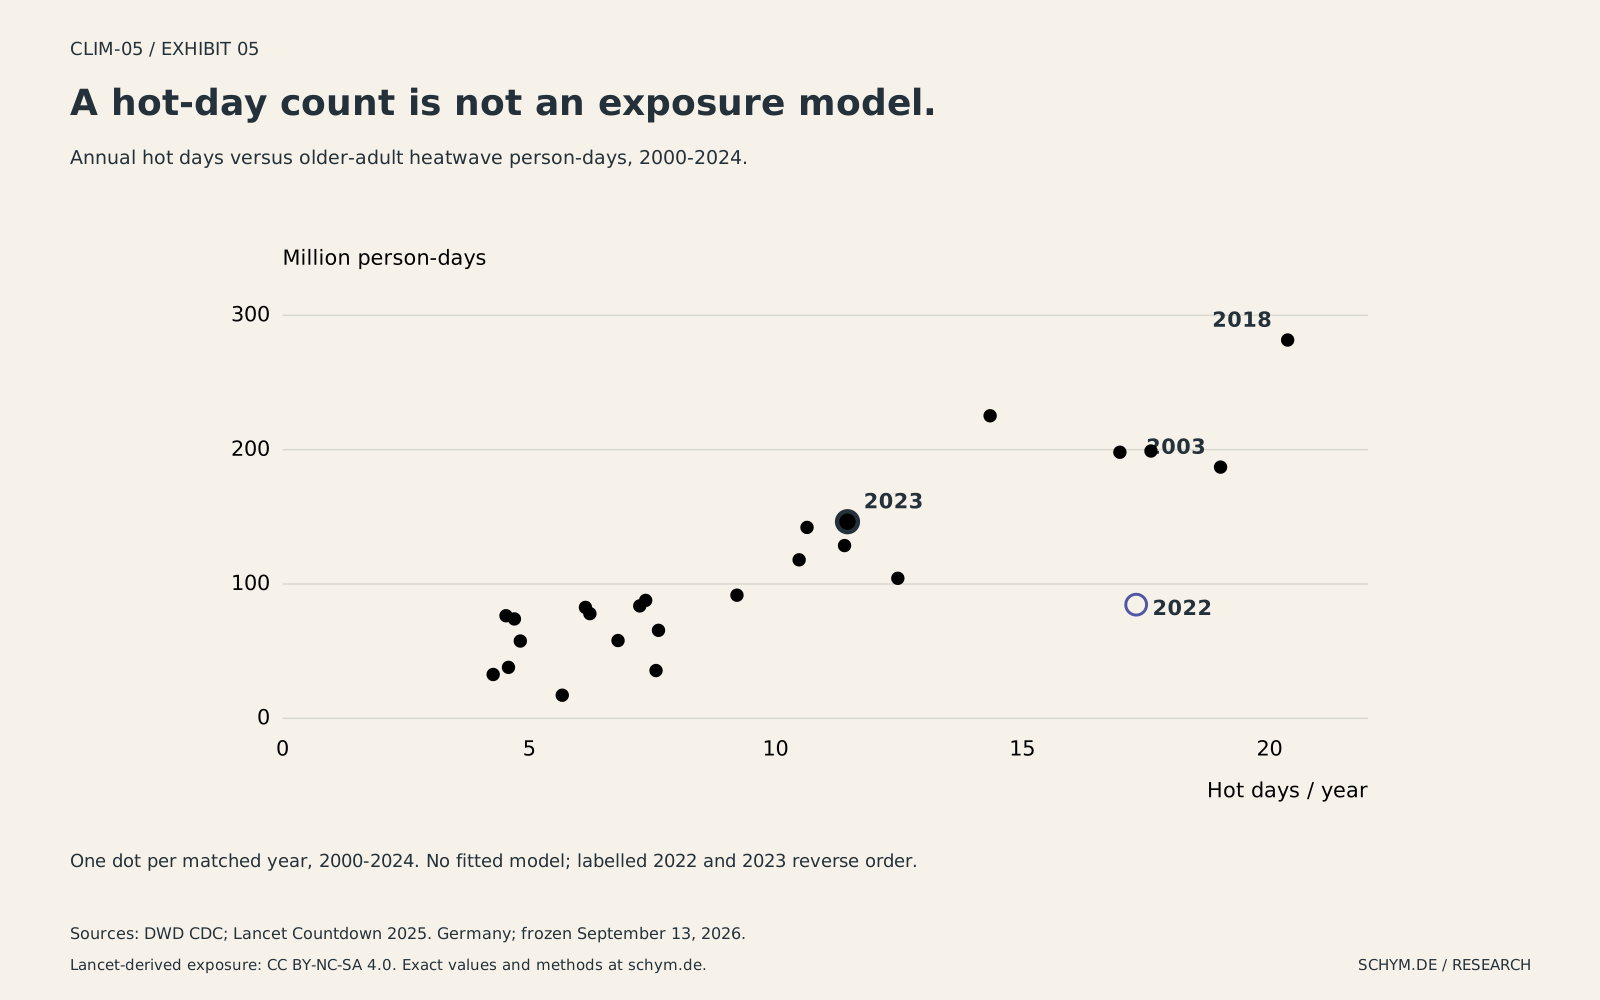
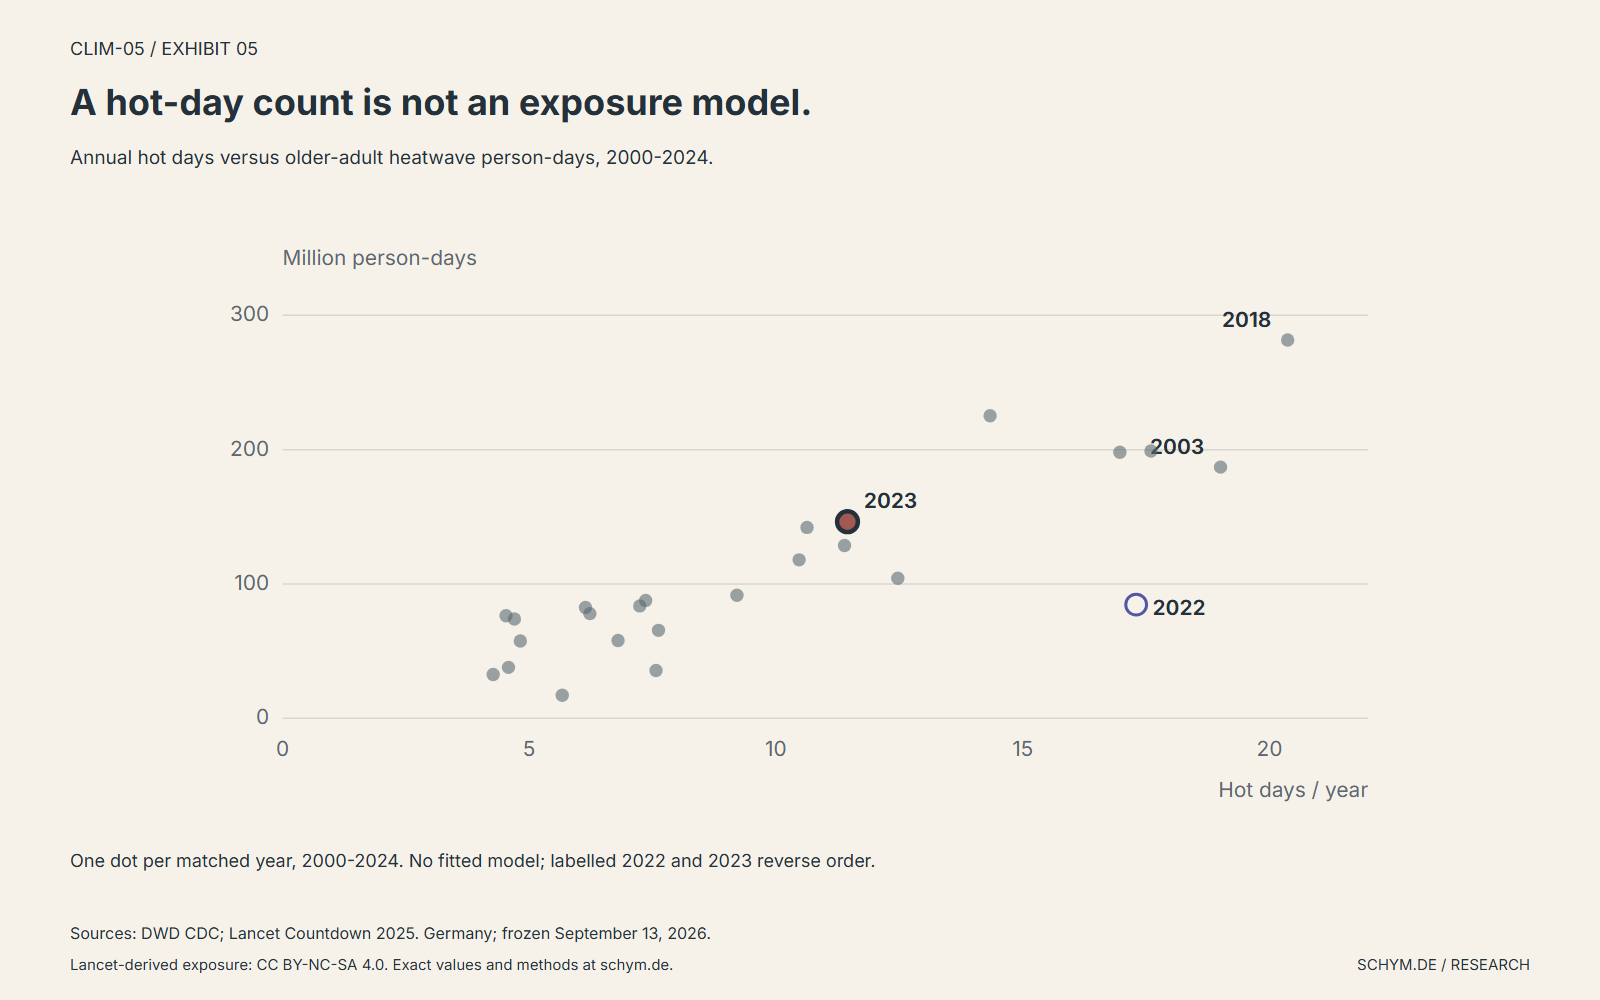
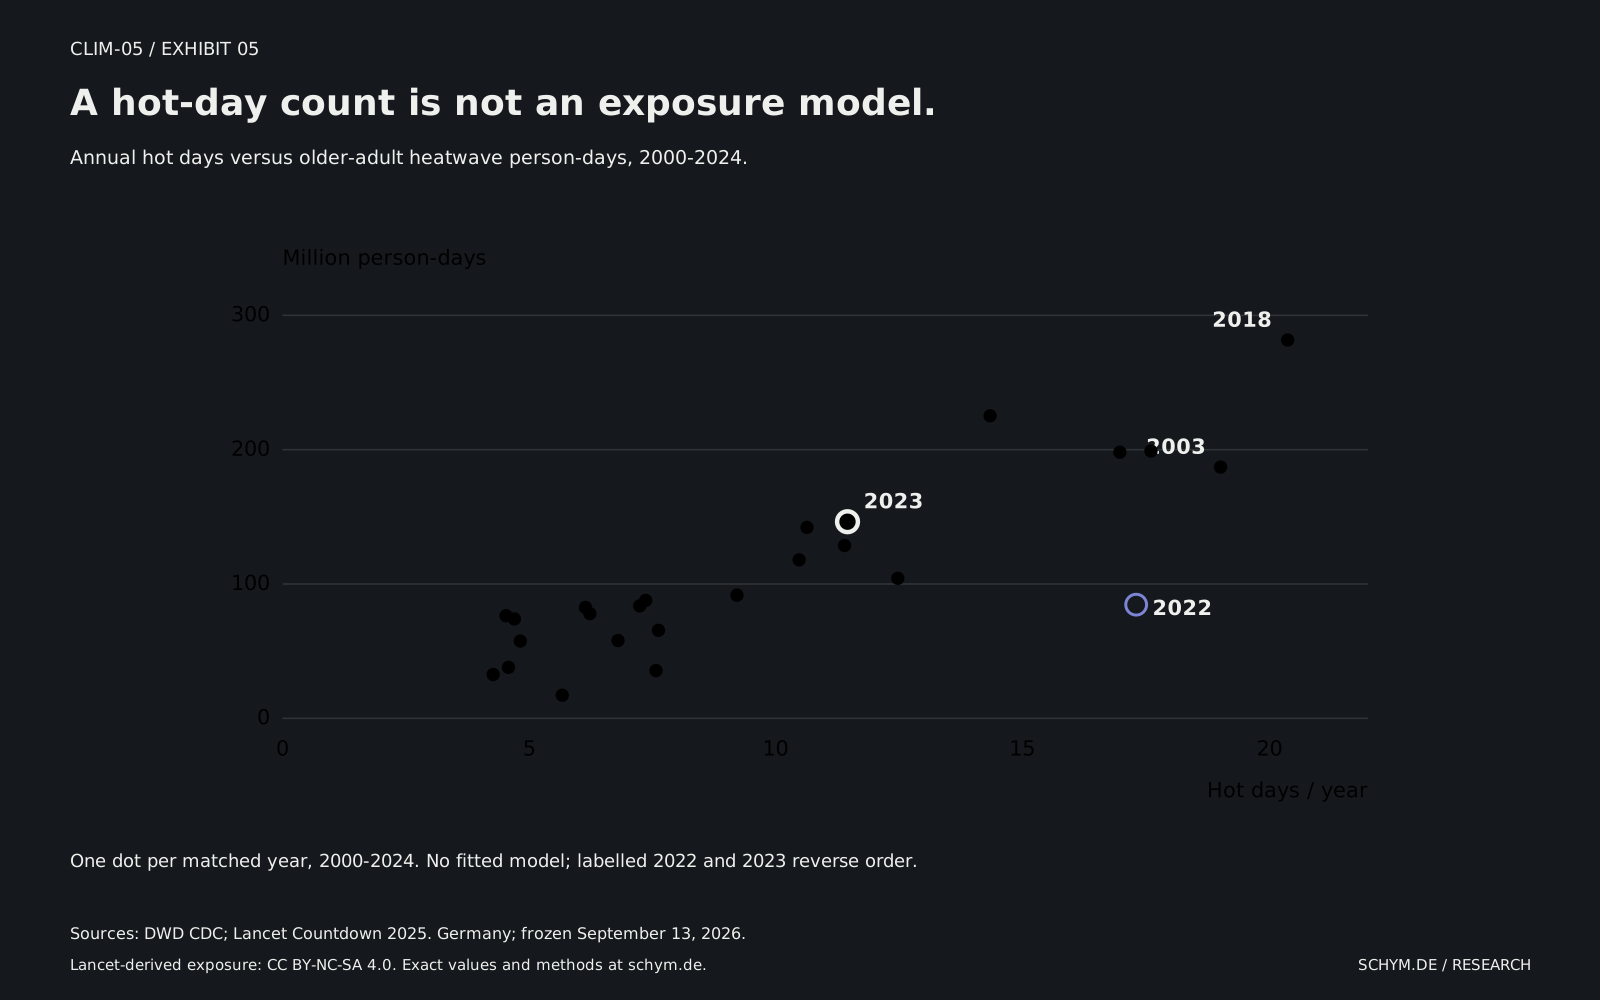
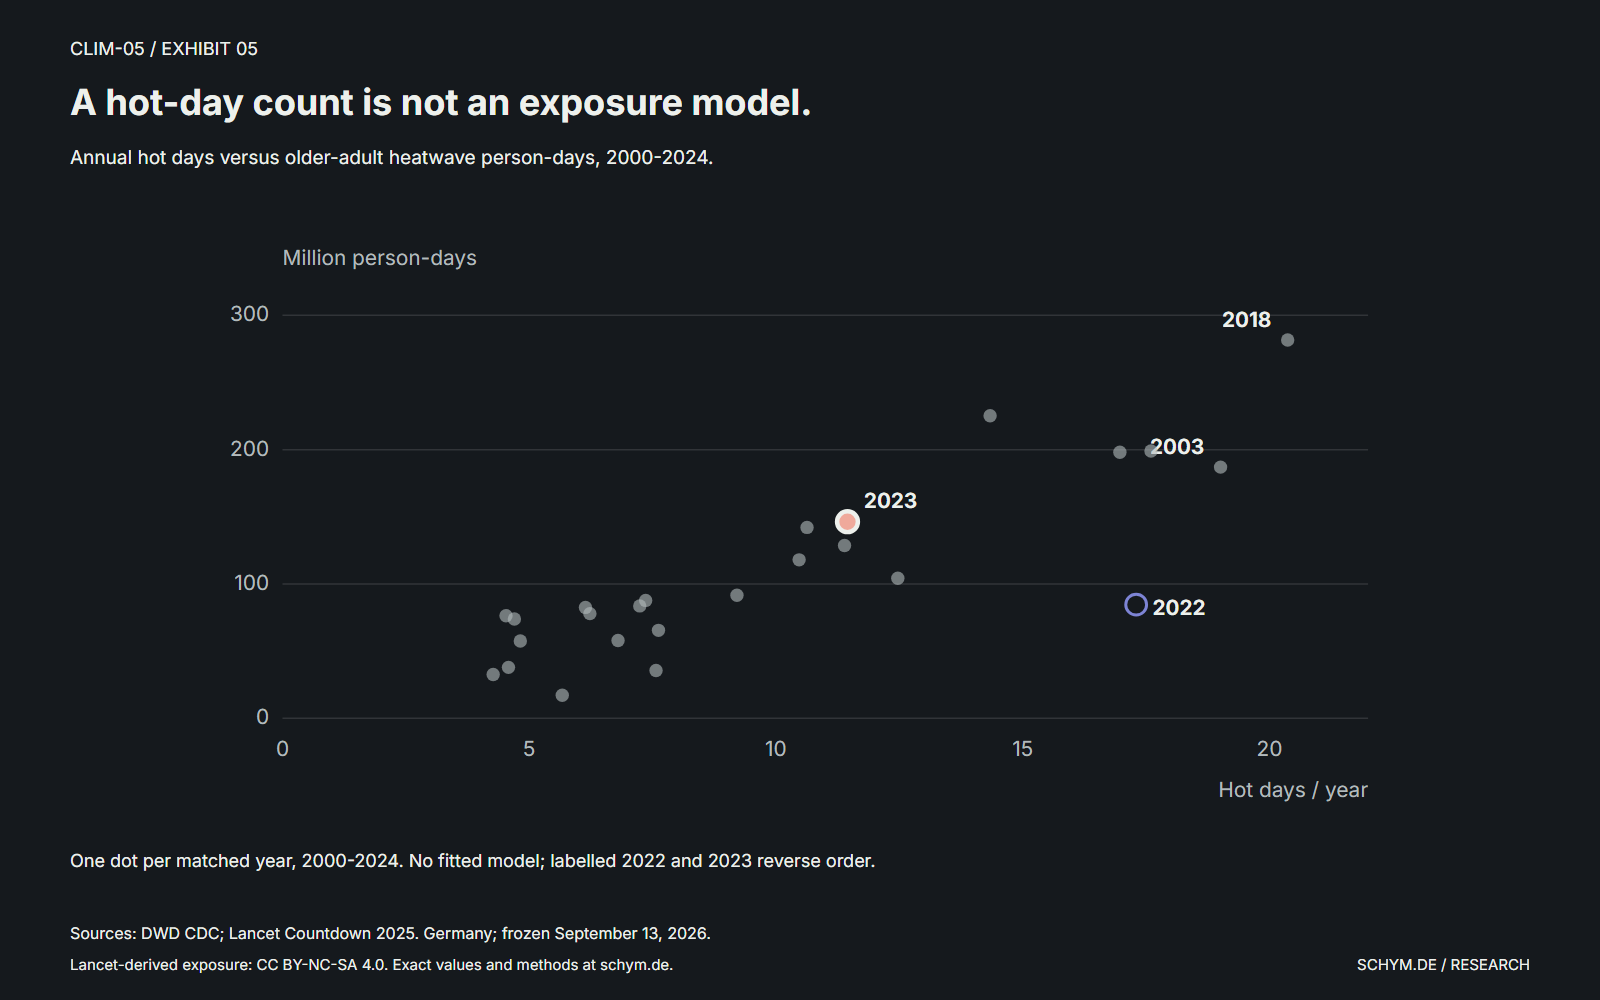
A hot-day count is not an exposure model.
Annual hot days versus older-adult heatwave person-days, 2000-2024.
DWD; Lancet Countdown 2025. Germany. Source snapshot: September 13, 2026.
Exact values
| Year | Hot days | Older person-days |
|---|---|---|
| 2000 | 5.67 | 17,204,649.294 |
| 2001 | 7.36 | 87,794,586.114 |
| 2002 | 6.23 | 77,942,318.138 |
| 2003 | 19.01 | 187,023,539.276 |
| 2004 | 4.7 | 73,996,356.786 |
| 2005 | 7.57 | 35,563,417.348 |
| 2006 | 14.34 | 225,243,185.157 |
| 2007 | 4.82 | 57,544,558.547 |
| 2008 | 7.24 | 83,691,502.366 |
| 2009 | 4.58 | 37,942,816.005 |
| 2010 | 10.63 | 142,130,063.130 |
| 2011 | 4.27 | 32,645,429.103 |
| 2012 | 7.62 | 65,513,103.183 |
| 2013 | 10.47 | 117,998,765.190 |
| 2014 | 6.14 | 82,577,848.670 |
| 2015 | 17.6 | 199,003,878.258 |
| 2016 | 9.21 | 91,676,514.213 |
| 2017 | 6.8 | 57,913,944.481 |
| 2018 | 20.37 | 281,631,476.201 |
| 2019 | 16.97 | 198,091,819.744 |
| 2020 | 11.39 | 128,624,486.686 |
| 2021 | 4.53 | 76,376,382.497 |
| 2022 | 17.3 | 84,621,606.012 |
| 2023 | 11.45 | 146,376,791.525 |
| 2024 | 12.47 | 104,248,407.765 |
Carry the comparison
Germany, 2023
- Hot days
- 11.45DWD area-average days
- Infant exposure
- 6.13million person-days
- Older-adult exposure
- 146.38million person-days
Observed weather and estimated exposure. Totals are not individual rates, diagnoses or deaths.
Three measurements, three responsibilities.
Weather monitoring, exposure analysis and health surveillance answer related but distinct questions. DWD tells us about the climate of an area. The Lancet estimates where vulnerable populations overlap with persistent heat. A health-outcome model would ask a further question about illness or mortality, with its own assumptions and uncertainty.
For a municipality, the useful implication is therefore specific: a national hot-day total is not sufficient evidence for the local burden. Planning needs information about population, housing, night-time cooling, access to protection and health-service capacity. This article does not estimate how much any particular intervention reduces that burden.
The latest year is not always the common year.
The matched exposure record ends in 2024. DWD's hot-day file extends to 2025, when Germany recorded an area average of 11.06 days. Its summer-temperature file already includes the completed summer of 2026, at 19.55 degrees Celsius. These are newer weather observations, not substitutes for missing 2025 or 2026 exposure estimates.
The distinction matters because refreshing one source does not update the whole analysis. We retain the newer observations as separate context and keep every linked comparison within the years the sources actually share.
A discontinuity deserves a visible boundary.
The Lancet workbook warns of possible inconsistencies before and after 2000 because two population sources were used to obtain spatial and temporal information. The earlier history remains visible, but the principal comparison deliberately stays after that change: 2001-2010 against 2015-2024.
Those periods are not an age-standardization exercise. Both heat conditions and the size and distribution of the population can affect total person-days. The country export contains no fixed-population counterfactual, so it cannot identify the separate demographic contribution. The index is a way to compare change within a group, not to rank which age group is personally at greater risk.
Where the evidence stops
What these data do not show
- Exposure estimates combine climate reanalysis and population grids. They are not direct observations of each person's indoor or outdoor conditions.
- Person-days count accumulated exposure, not unique people, diagnosed illness, hospital admissions or deaths.
- German age-group denominators, per-person exposure, fixed-population comparisons and country exposure intervals are absent from the downloaded country sheet.
- The inspected Lancet mortality workbook has global and regional estimates, but no German country sheet or German uncertainty intervals. No regional figure is relabelled as Germany.
- The descriptive comparisons do not identify the effect of a heat-action plan, establish individual clinical risk, or attribute the two-year reversal to one mechanism.
The audit trail
Sources, methods and rights
The reproducible pipeline freezes the official source bytes and SHA-256 hashes, checks complete unique calendar years, reads the actual workbook headers and joins only national Germany records. The DWD reference is 1991-2020; the Lancet heatwave definition retains 1986-2005; the derived within-group exposure index uses the stated 2001-2010 benchmark. These reference periods serve different purposes and are never silently equated. No observations are interpolated, no density or regression is fitted, and no missing denominator is replaced with zero.
Exposure data and their adapted charts are credited to the Lancet Countdown, Federico Tartarini and Ollie Jay under CC BY-NC-SA 4.0. Adaptations comprise the Germany subset, arithmetic comparisons, indices and visual encoding. Commercial reuse requires separate permission; no endorsement is implied. DWD weather data retain DWD attribution.
- DWD Climate Data Center: regional annual hot days and summer mean temperature. Read with the published geography and reference periods.
- Lancet Countdown 2025, indicator 1.1.1: German vulnerable-population heatwave person-days. 2025 report.
- IPCC AR6 Synthesis Report, SPM A.2 and C.2: the impacts and adaptation framing, not a source for these newer German annual values.
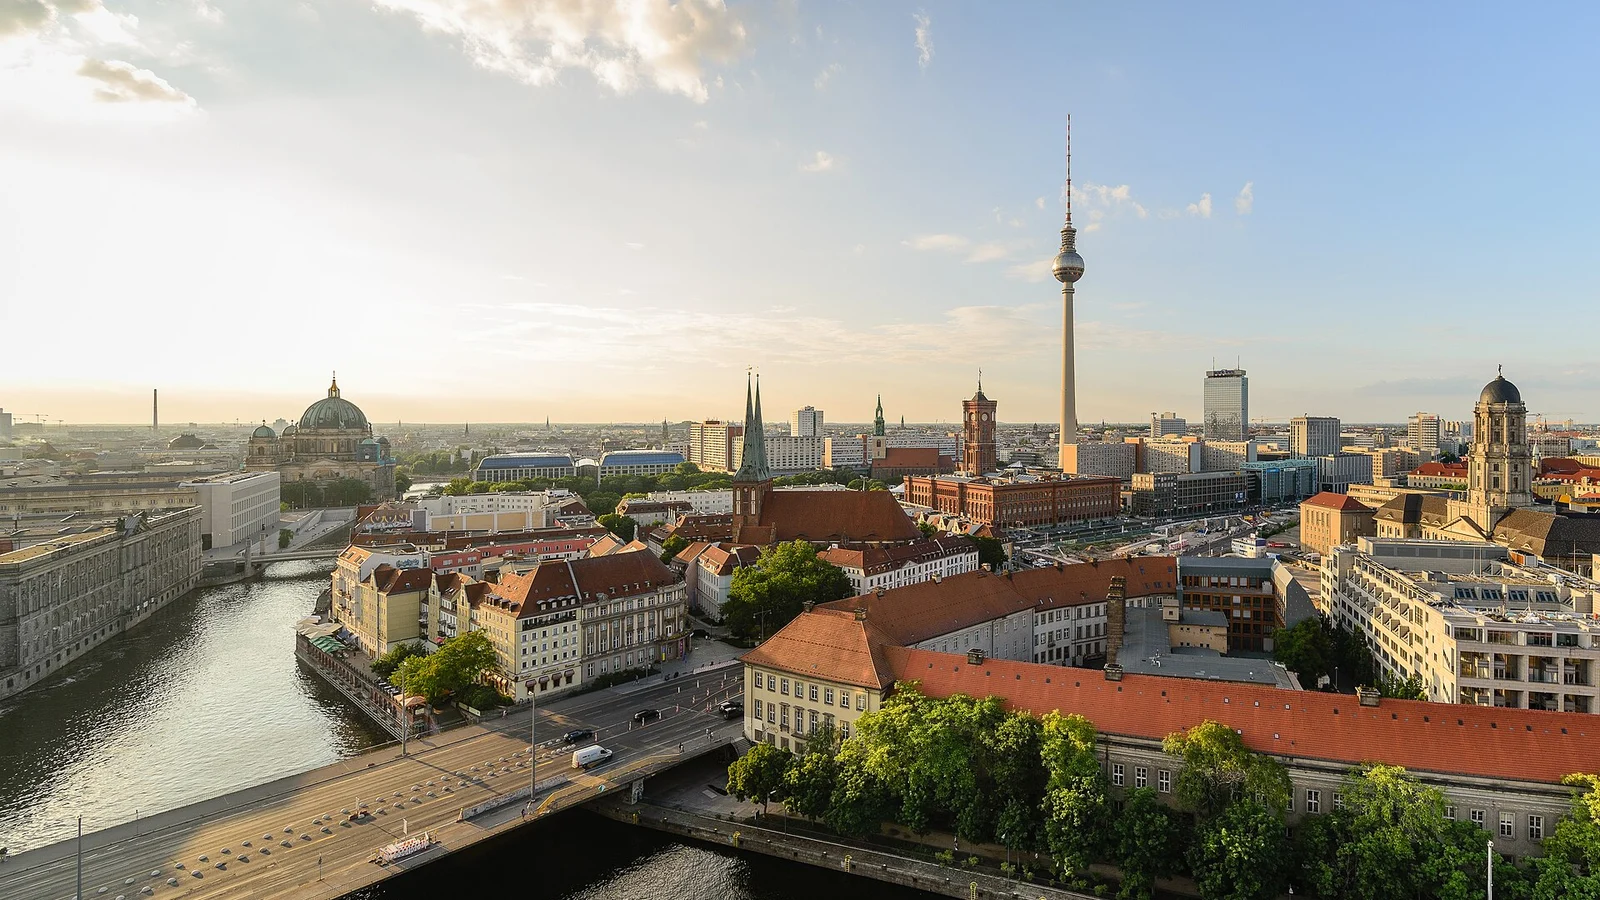
Photograph: ArildV (Arild Vagen), Berlin-Mitte, June 24, 2023. CC BY-SA 4.0. Centered crop and WebP conversion. The image establishes place; it does not identify a heatwave or show measured temperature.