
CLIM-04 / The ocean heat inventory
The heat below the surface.
The surface thermometer records temperature. The ocean inventory records stored energy. One cannot stand in for the other.
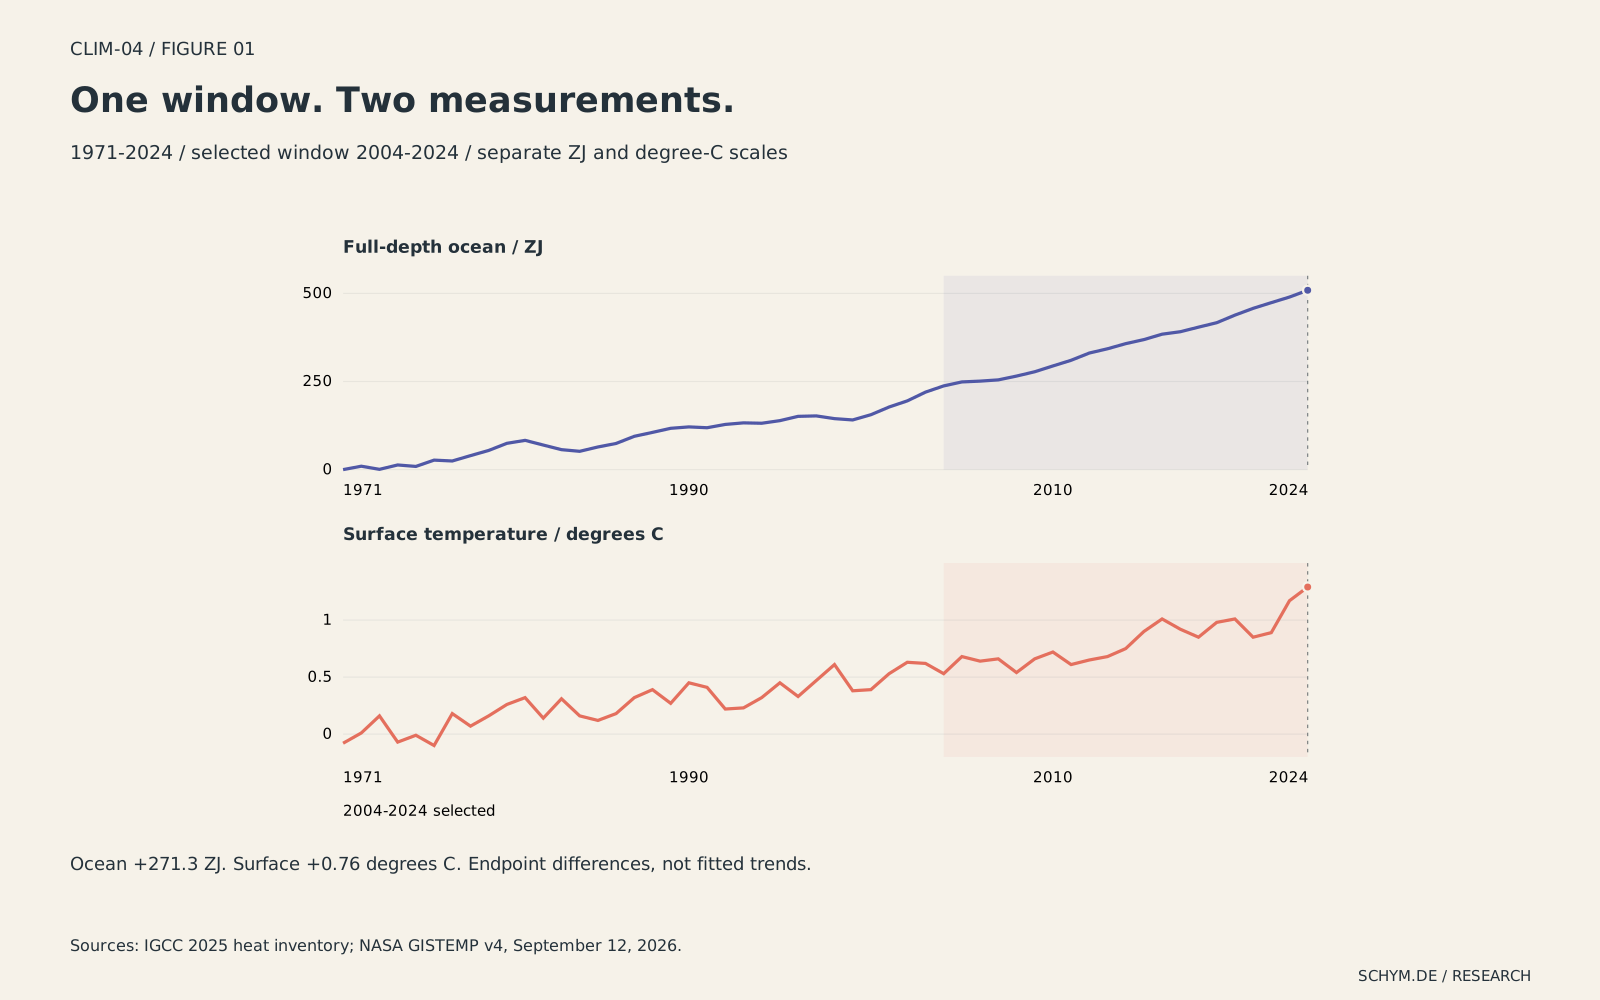
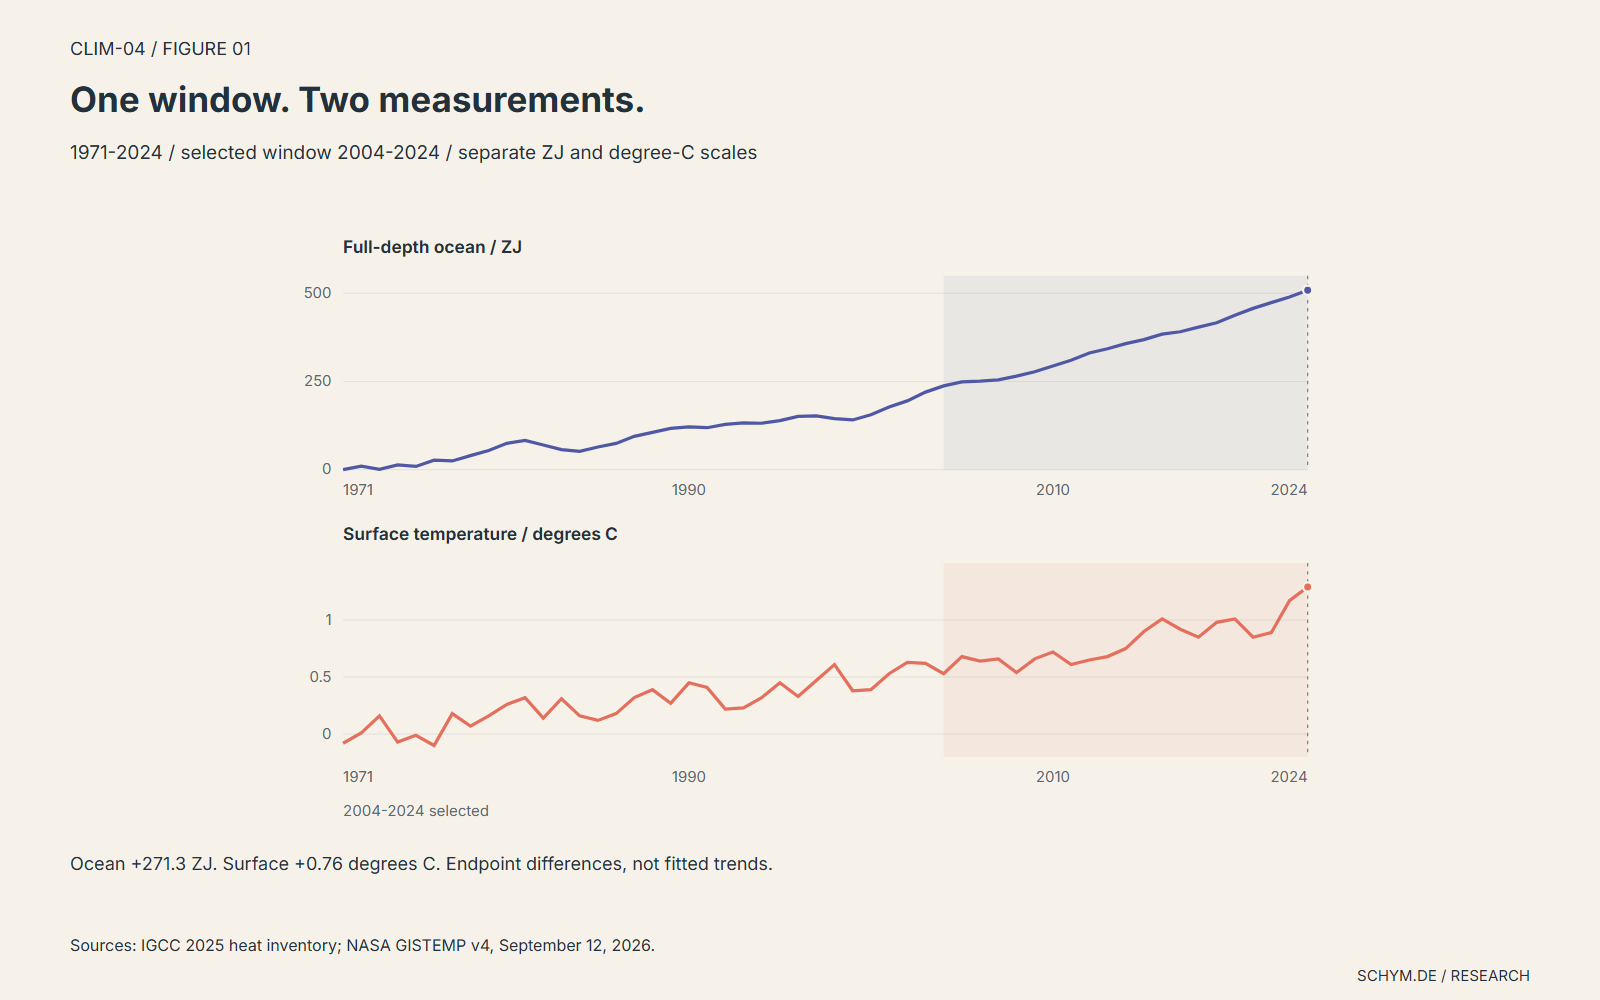
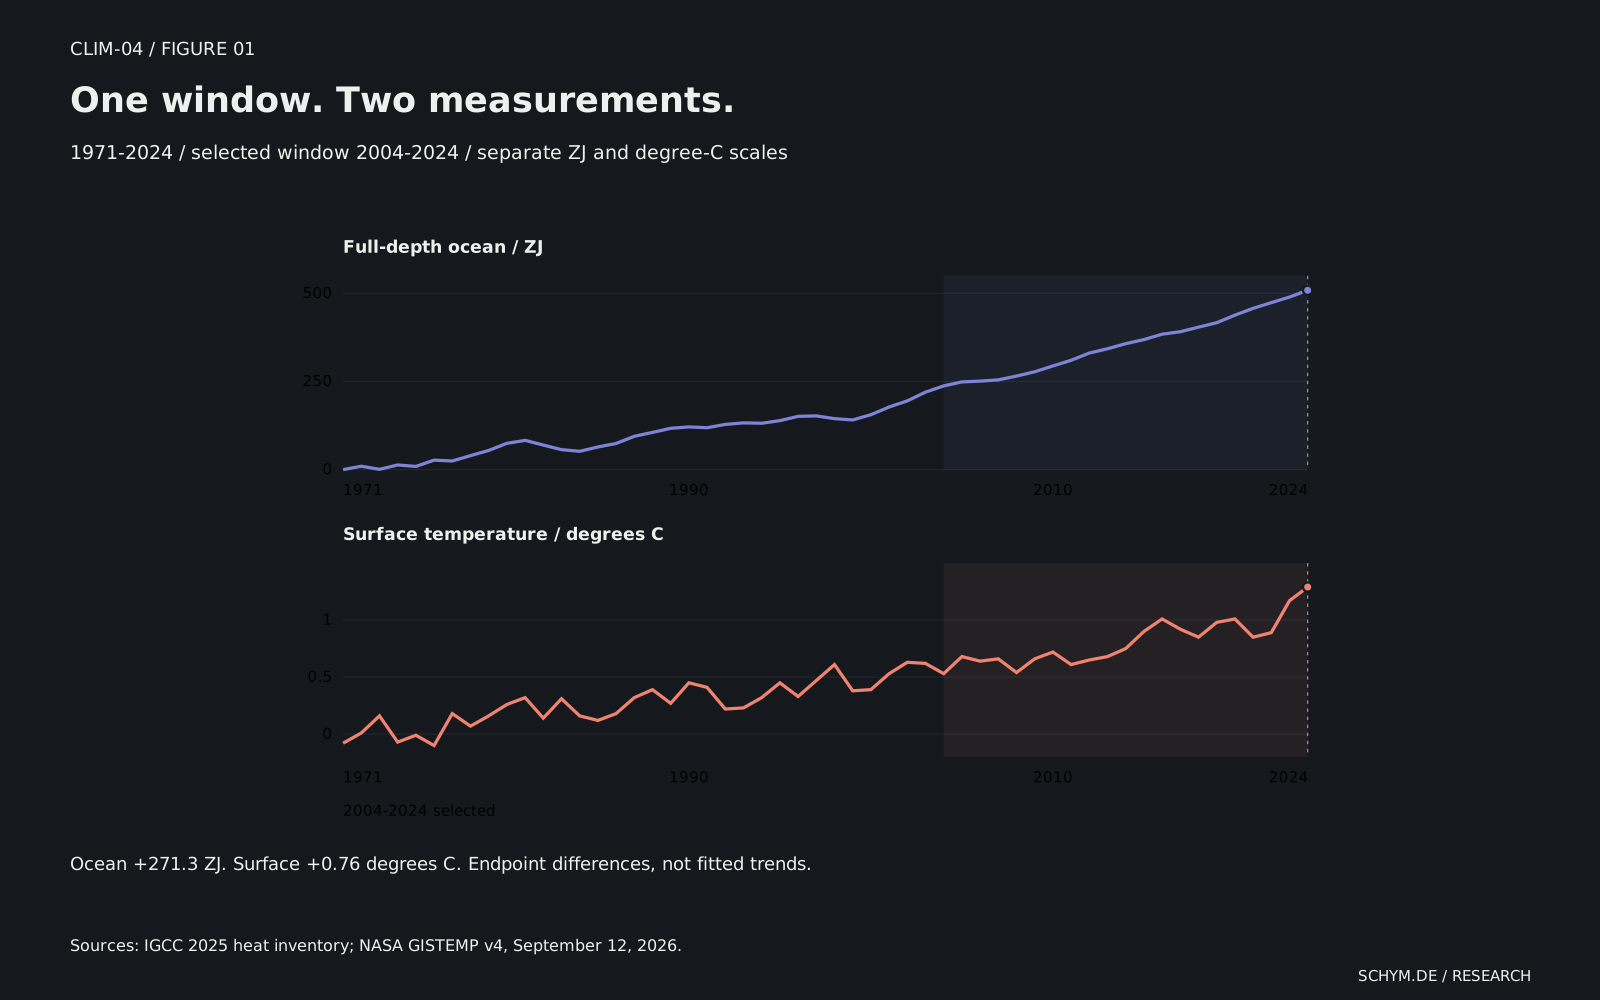
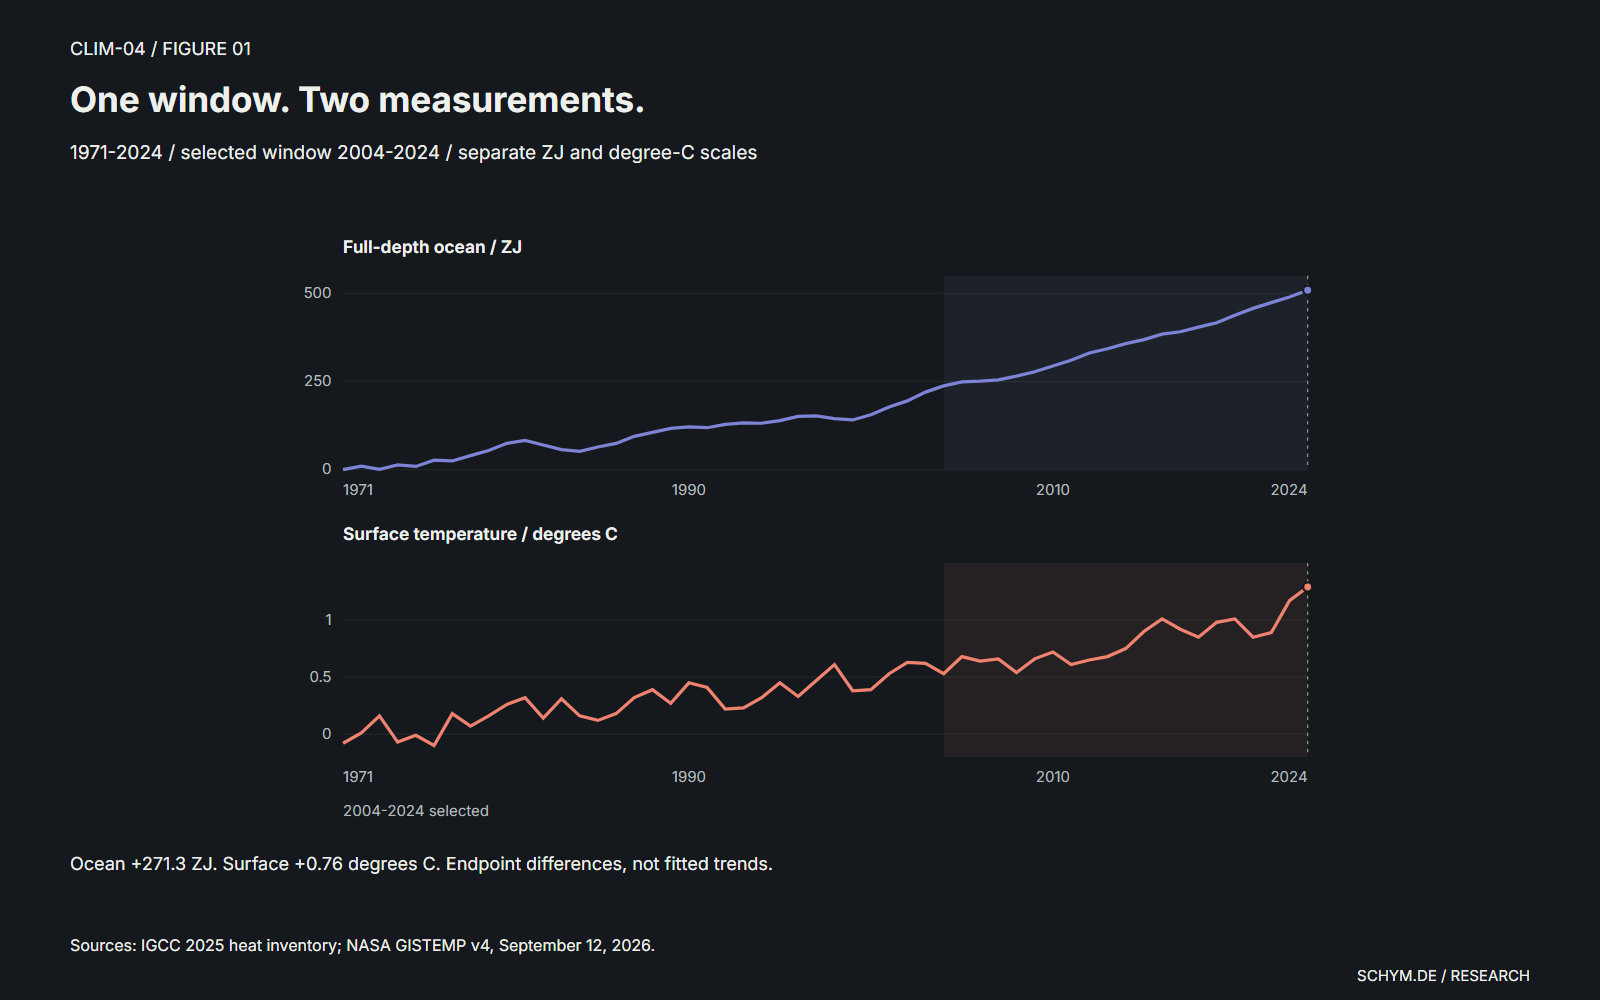
Between 2004 and 2024, the published full-depth ocean inventory gained 271.3 zettajoules of heat. NASA's global surface-temperature estimate rose by 0.76 degrees Celsius over the same interval. Those numbers describe the same climate system, but they measure different things. A surface reading can move with weather and circulation while the inventory continues to accumulate energy. To understand the change, follow the same observation window below the surface, then inspect where measurement gives way to assumption.
A cooler year does not close the account.
NASA's estimate of global surface temperature fell from 1.29 degrees Celsius above its 1951-1980 reference in 2024 to 1.19 degrees in 2025. That is a real change within that observational product. It is not a measurement of how much energy the planet gained or lost. Surface temperature measures a thermal condition; heat content measures an inventory of energy, integrated through a much larger volume of water.
The distinction is not an invitation to disregard the thermometer. Surface temperatures matter for experienced heat and many climate impacts. But a thin surface layer cannot describe the entire system. Ocean circulation can redistribute heat between the surface and deeper layers, changing the temperature response without making the stored energy disappear. The IPCC and the annual Indicators of Global Climate Change assessment therefore examine both.
The interactive record below deliberately ends in 2024. The released IGCC heat CSV includes one additional row with values but no year or time bounds. It is preserved in the source receipt, not silently assigned to 2025. The later period summaries in the published paper remain usable because their dates and uncertainty intervals are explicitly stated. Different evidence objects have different usable endpoints.
01 / Inspect the inventory
A common window, not a common scale.
The default comparison spans twenty elapsed years, from the annual mean in 2004 to the annual mean in 2024. It contains twenty-one consecutive annual observations. Switching to ten years changes both endpoints together. Moving the ending year tests how sensitive the comparison is to the selected interval; it does not refit a trend or estimate a causal effect.
For 2014-2024, the inventory increased by 151.5 ZJ and surface temperature by 0.54 degrees Celsius. For 2004-2024, the corresponding changes are 271.3 ZJ and 0.76 degrees. The intervals overlap and have different lengths. Dividing each change by its duration would produce endpoint rates, not an independent statistical test of acceleration.
The charts retain two vertical scales. Ocean heat is expressed in zettajoules, where one ZJ is 10 to the power of 21 joules. The ocean series retains its published inventory reference; NASA retains its 1951-1980 temperature reference. Rescaling both curves to start at 100 would make their shapes easier to overlay, but would remove the physical distinction that this comparison is intended to preserve. The useful alignment is time.
01 / The shared window
One window.
Two measurements.
Ocean energy and surface temperature / 1971-2024 / separate vertical scales
2004-2024: 20 elapsed years, 21 consecutive annual observations. Endpoint differences, not fitted trends.
2024508.9 ZJ ocean inventory1.29 °C surface anomaly
Sources: IGCC 2025 and NASA GISTEMP v4. Ocean reference: published 1971 inventory. Temperature reference: 1951-1980. A zettajoule is 10²¹ joules. No conversion joins these scales.
Exact values
| Year | Ocean / ZJ | Surface / °C | Whole system / ZJ |
|---|---|---|---|
| 1971 | 0.000 | −0.08 | 1.541 |
| 1972 | 9.663 | 0.01 | 11.918 |
| 1973 | 0.801 | 0.16 | 4.464 |
| 1974 | 13.189 | −0.07 | 15.731 |
| 1975 | 9.050 | −0.01 | 12.054 |
| 1976 | 26.910 | −0.10 | 29.388 |
| 1977 | 24.483 | 0.18 | 28.589 |
| 1978 | 39.666 | 0.07 | 44.341 |
| 1979 | 54.385 | 0.16 | 60.115 |
| 1980 | 74.577 | 0.26 | 81.647 |
| 1981 | 83.007 | 0.32 | 90.577 |
| 1982 | 69.701 | 0.14 | 77.318 |
| 1983 | 56.617 | 0.31 | 64.493 |
| 1984 | 51.931 | 0.16 | 59.212 |
| 1985 | 64.213 | 0.12 | 71.474 |
| 1986 | 74.217 | 0.18 | 82.351 |
| 1987 | 94.483 | 0.32 | 103.022 |
| 1988 | 105.641 | 0.39 | 116.450 |
| 1989 | 117.199 | 0.27 | 128.040 |
| 1990 | 121.175 | 0.45 | 132.990 |
| 1991 | 118.835 | 0.41 | 131.228 |
| 1992 | 128.205 | 0.22 | 138.894 |
| 1993 | 132.637 | 0.23 | 143.462 |
| 1994 | 131.558 | 0.32 | 143.927 |
| 1995 | 138.946 | 0.45 | 152.558 |
| 1996 | 151.109 | 0.33 | 165.894 |
| 1997 | 152.377 | 0.47 | 167.071 |
| 1998 | 144.638 | 0.61 | 162.529 |
| 1999 | 140.927 | 0.38 | 158.269 |
| 2000 | 155.771 | 0.39 | 173.448 |
| 2001 | 177.636 | 0.53 | 196.716 |
| 2002 | 195.022 | 0.63 | 215.296 |
| 2003 | 219.872 | 0.62 | 240.369 |
| 2004 | 237.509 | 0.53 | 258.944 |
| 2005 | 248.801 | 0.68 | 272.205 |
| 2006 | 251.086 | 0.64 | 275.989 |
| 2007 | 254.587 | 0.66 | 280.606 |
| 2008 | 265.377 | 0.54 | 291.859 |
| 2009 | 277.643 | 0.66 | 305.750 |
| 2010 | 294.105 | 0.72 | 324.642 |
| 2011 | 310.196 | 0.61 | 341.173 |
| 2012 | 330.761 | 0.65 | 362.702 |
| 2013 | 342.849 | 0.68 | 376.052 |
| 2014 | 357.396 | 0.75 | 390.723 |
| 2015 | 368.906 | 0.90 | 403.452 |
| 2016 | 384.238 | 1.01 | 422.182 |
| 2017 | 391.221 | 0.92 | 430.449 |
| 2018 | 404.207 | 0.85 | 443.566 |
| 2019 | 416.814 | 0.98 | 457.468 |
| 2020 | 438.305 | 1.01 | 480.973 |
| 2021 | 457.522 | 0.85 | Unavailable |
| 2022 | 473.729 | 0.89 | Unavailable |
| 2023 | 489.634 | 1.17 | Unavailable |
| 2024 | 508.850 | 1.29 | Unavailable |
2024: 508.850 ZJ ocean inventory; 1.29 degrees Celsius surface anomaly. The panels retain separate units and references.
A surface reading can move with weather and ocean circulation. The heat inventory asks a different question: how much energy remains in the system?
The two panels retain their own units and reference periods. Their vertical positions are not comparable; their observation windows are.
02 / Inspect the inventory
Open the inventory before trusting its smoothness.
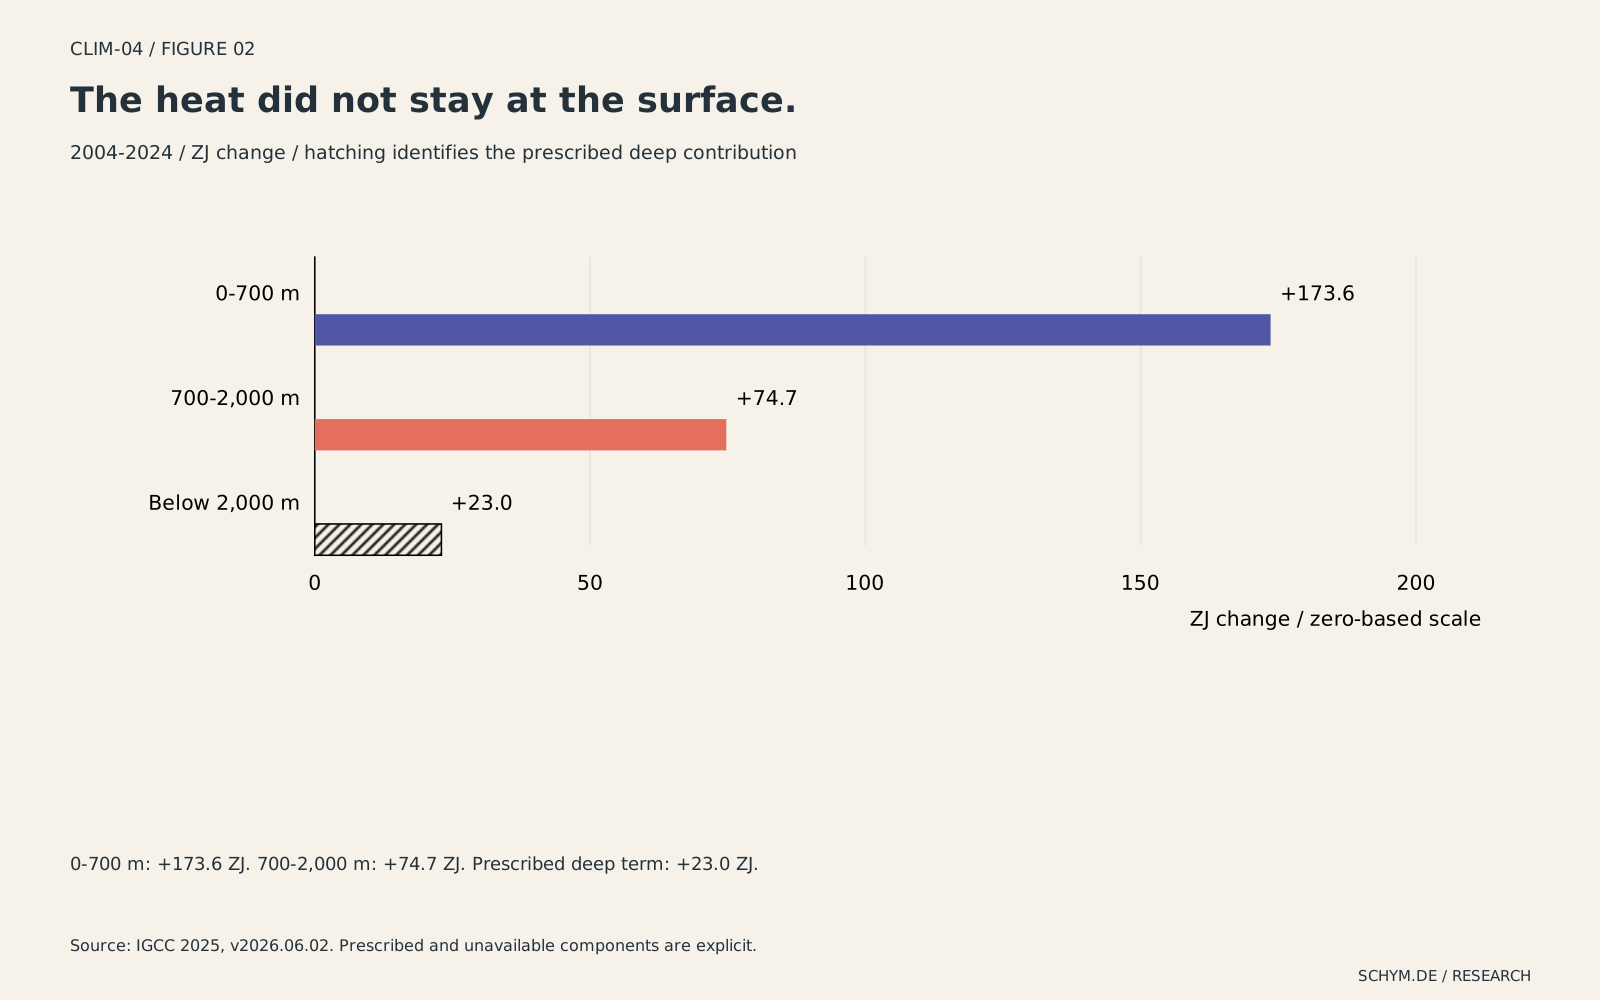
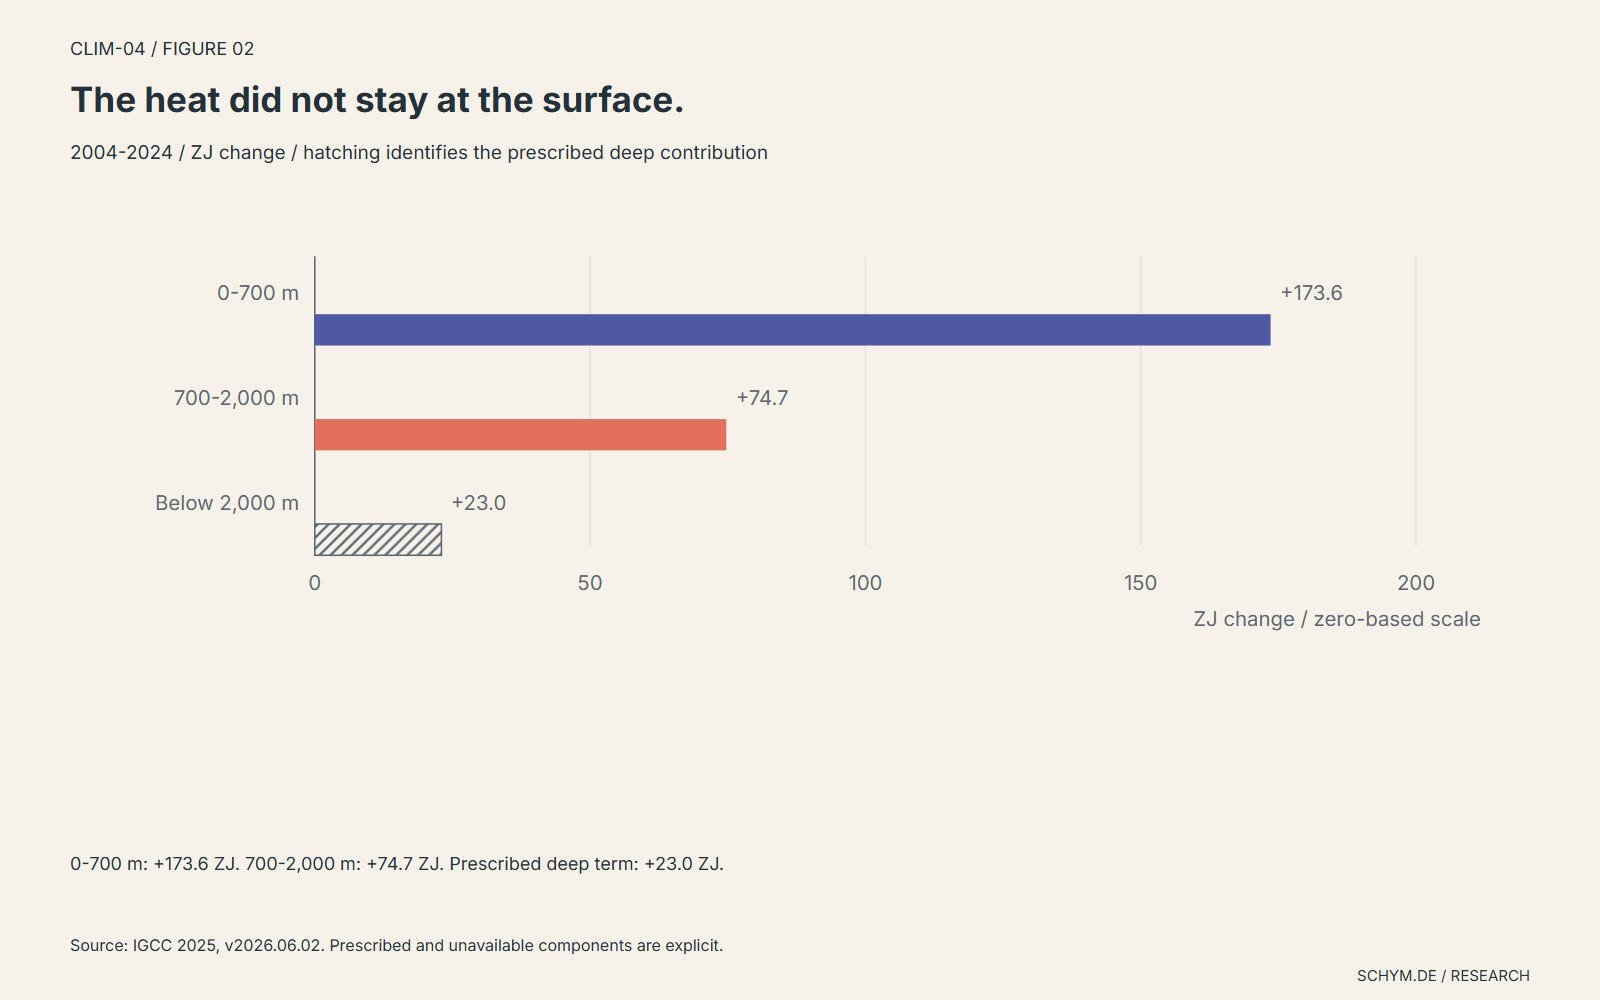
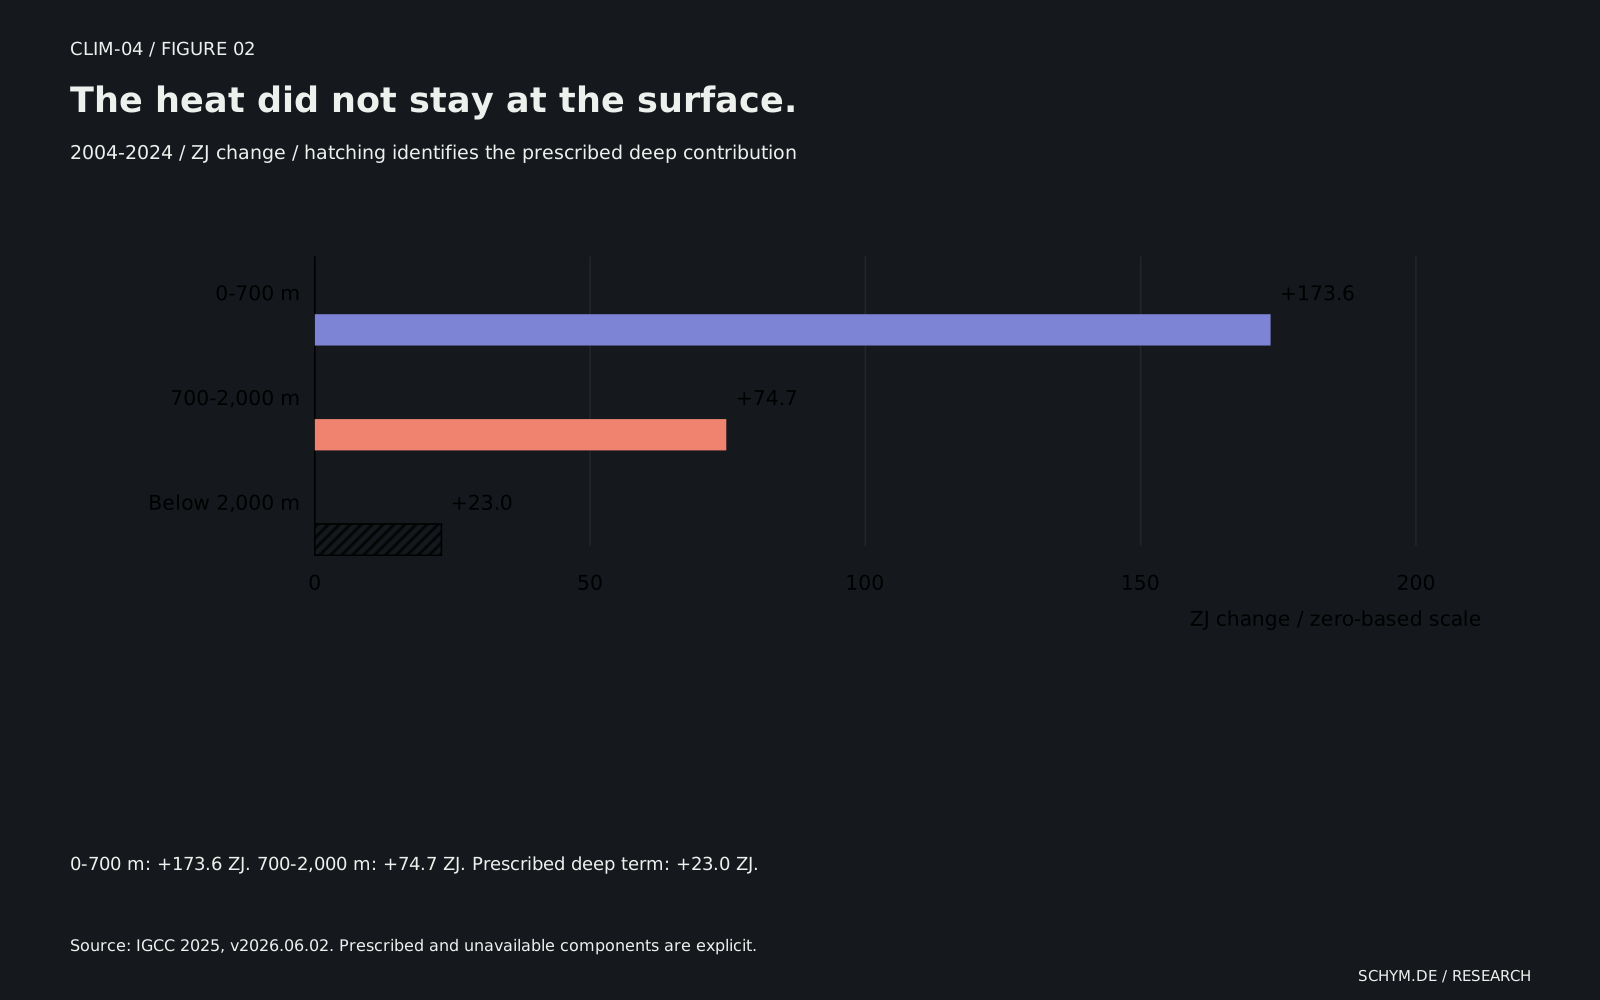
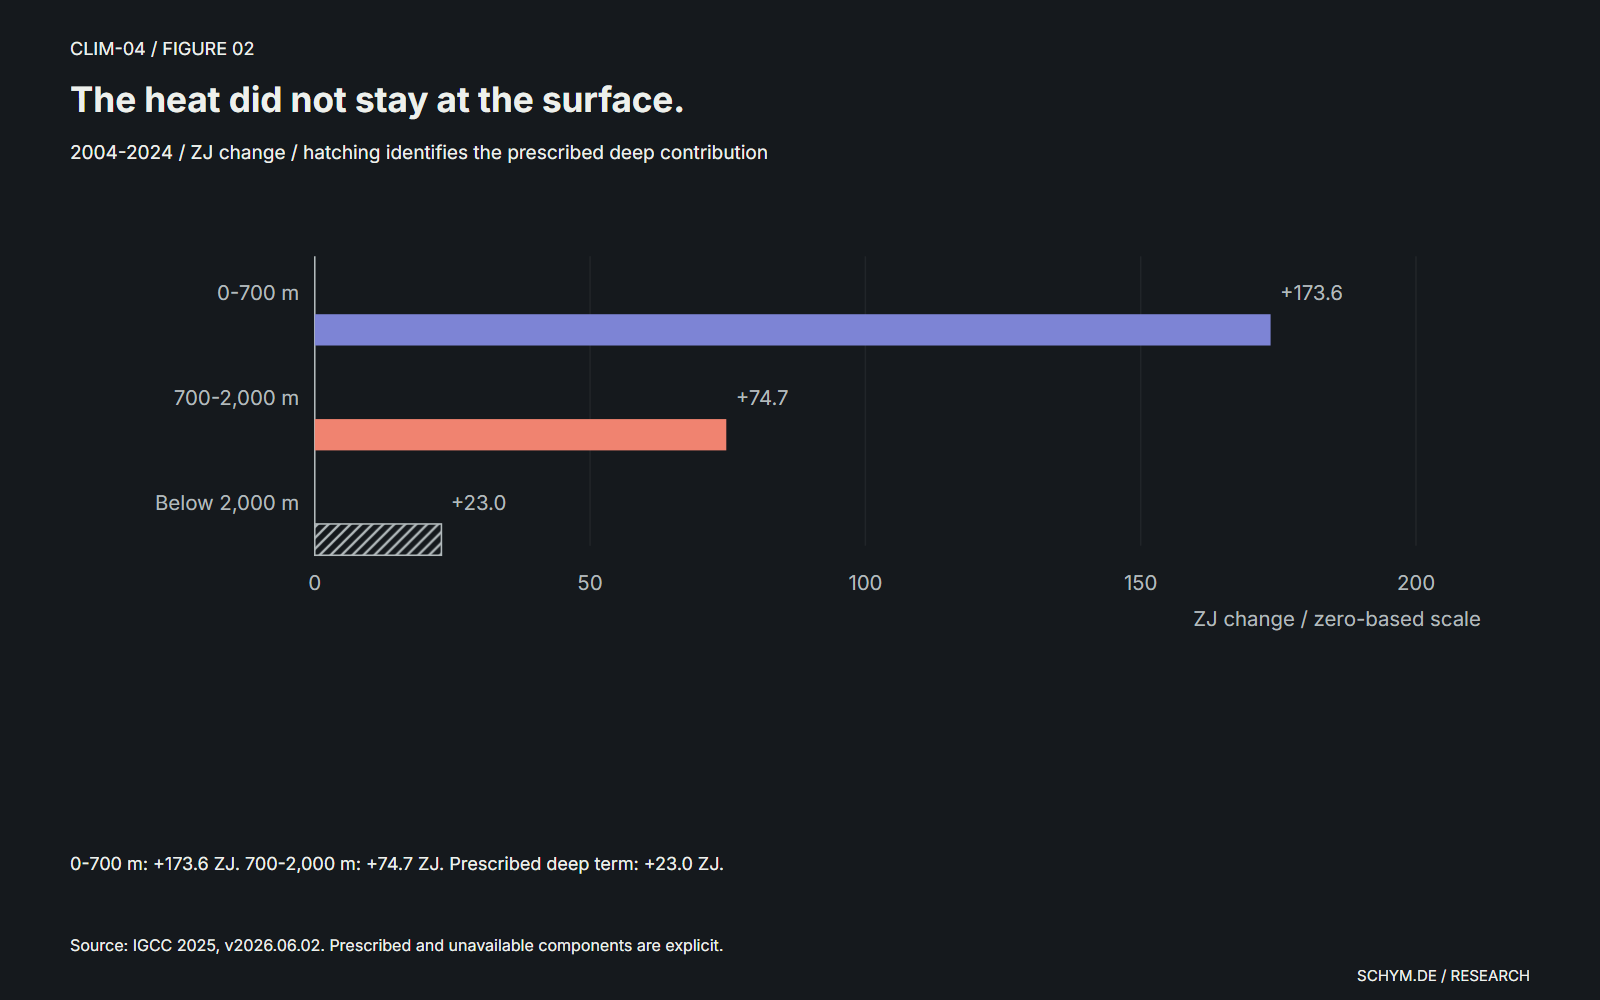
The ocean record is assembled from depth layers. In the default twenty-year interval, the upper 700 meters gained 173.6 ZJ, the 700-2,000 meter layer gained 74.7 ZJ, and the published deeper contribution added 23.0 ZJ. The layers reconcile to the full-depth change. Their evidential status does not.
The upper and intermediate layers are observational estimates compiled from ocean measurements and analysis products. The below-2,000 meter term follows an assumed heating rate rather than a separately observed annual trajectory. In the compact released record it is zero through 1991 and rises linearly thereafter. A smooth contribution is therefore partly a property of the construction of the inventory. It should not be read as evidence that the deep ocean changes smoothly from one year to the next.
Selecting the record above 2,000 meters removes that prescribed contribution from the active ocean line while retaining the full-depth reference. For 2004-2024, the remaining measured-layer estimate still gains 248.3 ZJ. This is a sensitivity view of the published inventory, not a substitute scientific assessment. It answers a narrow question: how much of this selected change depends on including the prescribed deep term?
02 / Open the inventory
The heat did not stay at the surface.
2004-2024 / three nonoverlapping ocean layers
Published full-depth change+271.3 ZJ
Source: IGCC 2025, section 6. Hatched bar: prescribed below-2,000 m contribution. Removing it does not replace the published inventory with a new scientific estimate. Annual error columns remain in the source; endpoint covariance is unavailable, so no new confidence intervals are calculated.
Exact values
| Depth | Change / ZJ | Evidence status |
|---|---|---|
| 0-700 m | +173.600 | Observational estimate |
| 700-2,000 m | +74.741 | Observational estimate |
| Below 2,000 m | +23.000 | Prescribed contribution |
2004-2024: upper 700 m 173.600 ZJ; 700-2,000 m 74.741 ZJ; prescribed deep contribution 23.000 ZJ.
03 / Inspect the inventory
The rate is a different quantity again.
Earth's energy imbalance measures the net rate at which the climate system accumulates energy, expressed as watts per square meter of Earth's surface. Heat content is the accumulated inventory; the imbalance is a rate. Neither is a prediction of next year's global temperature.
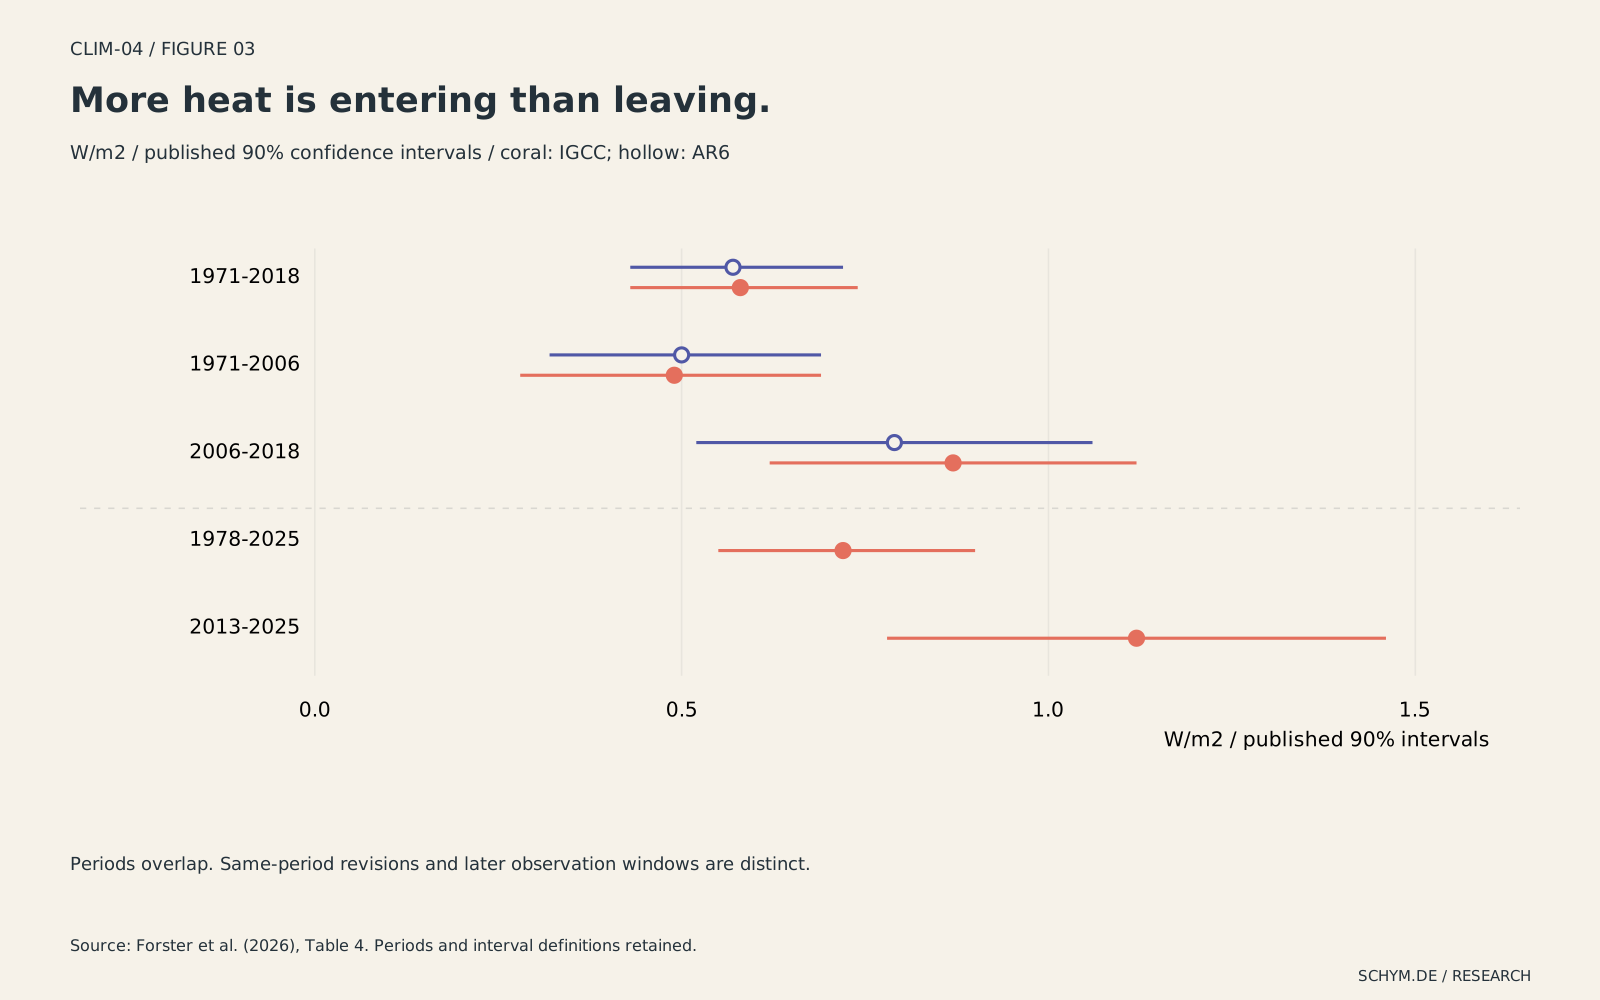
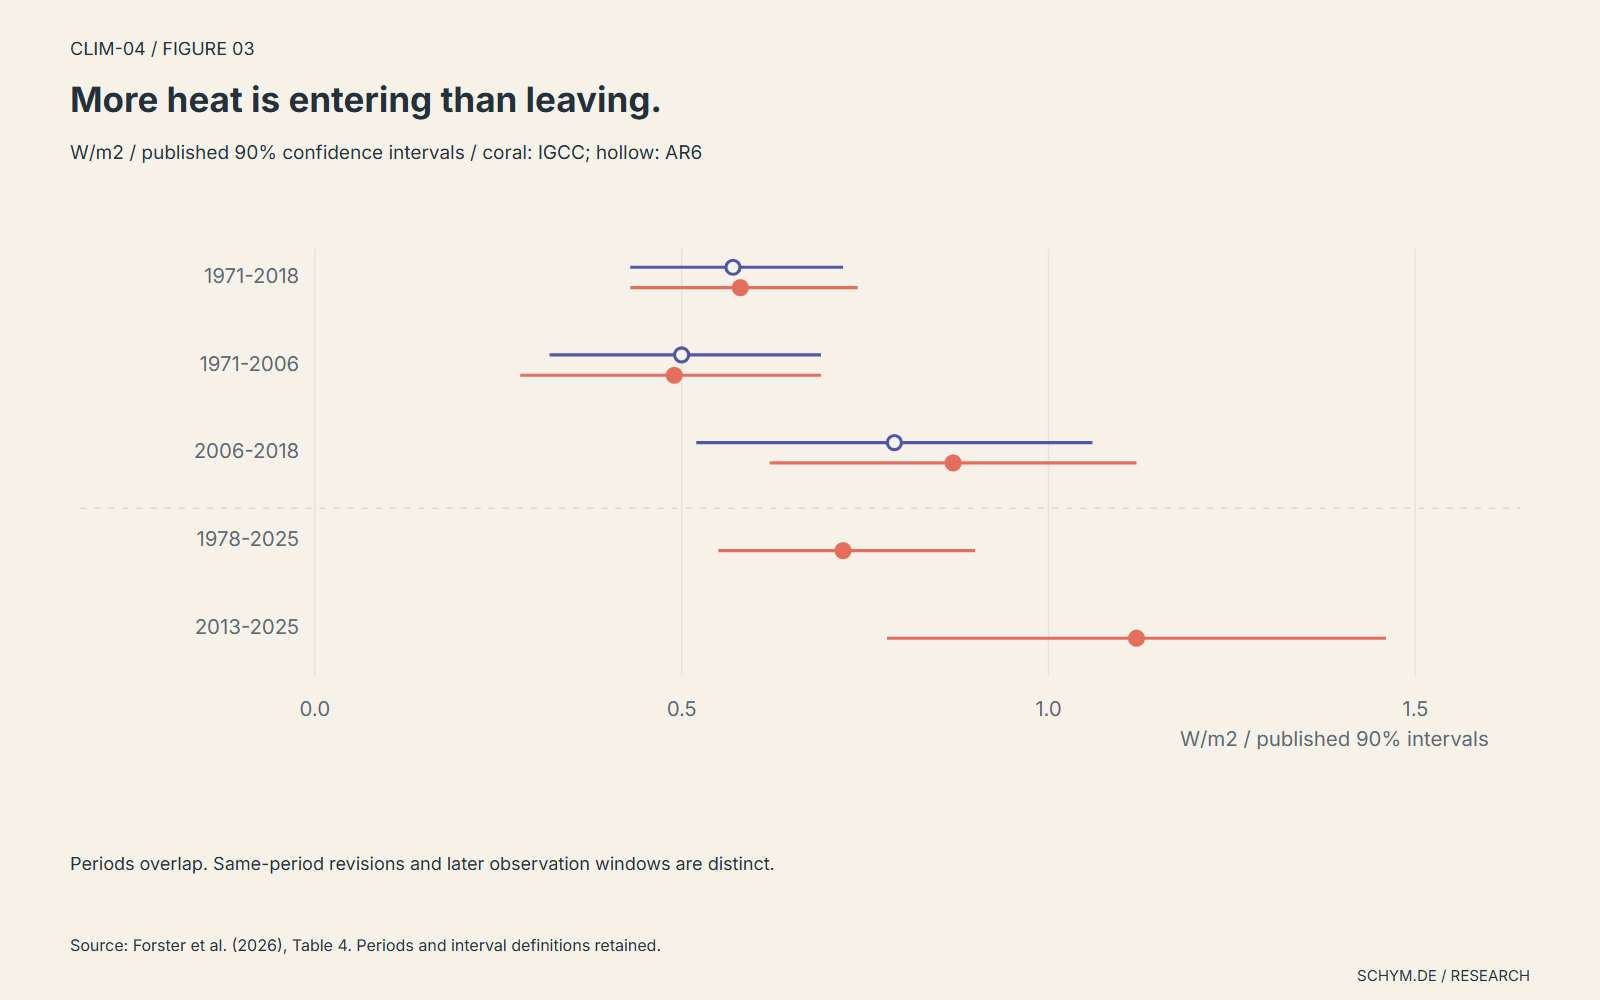
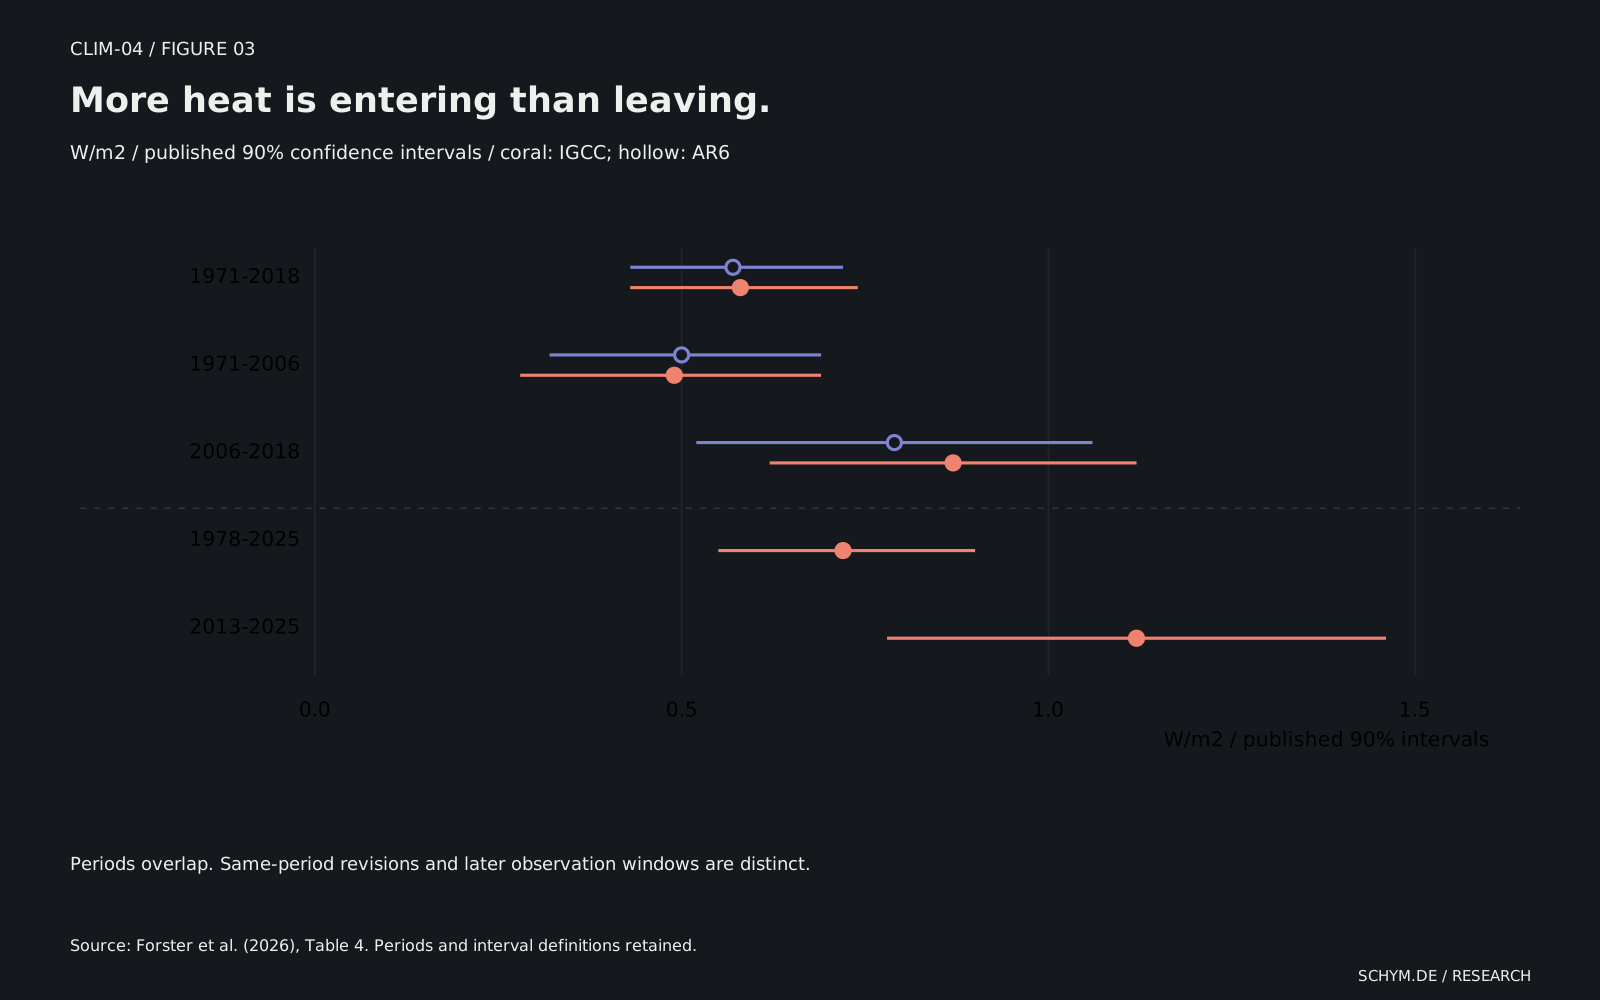
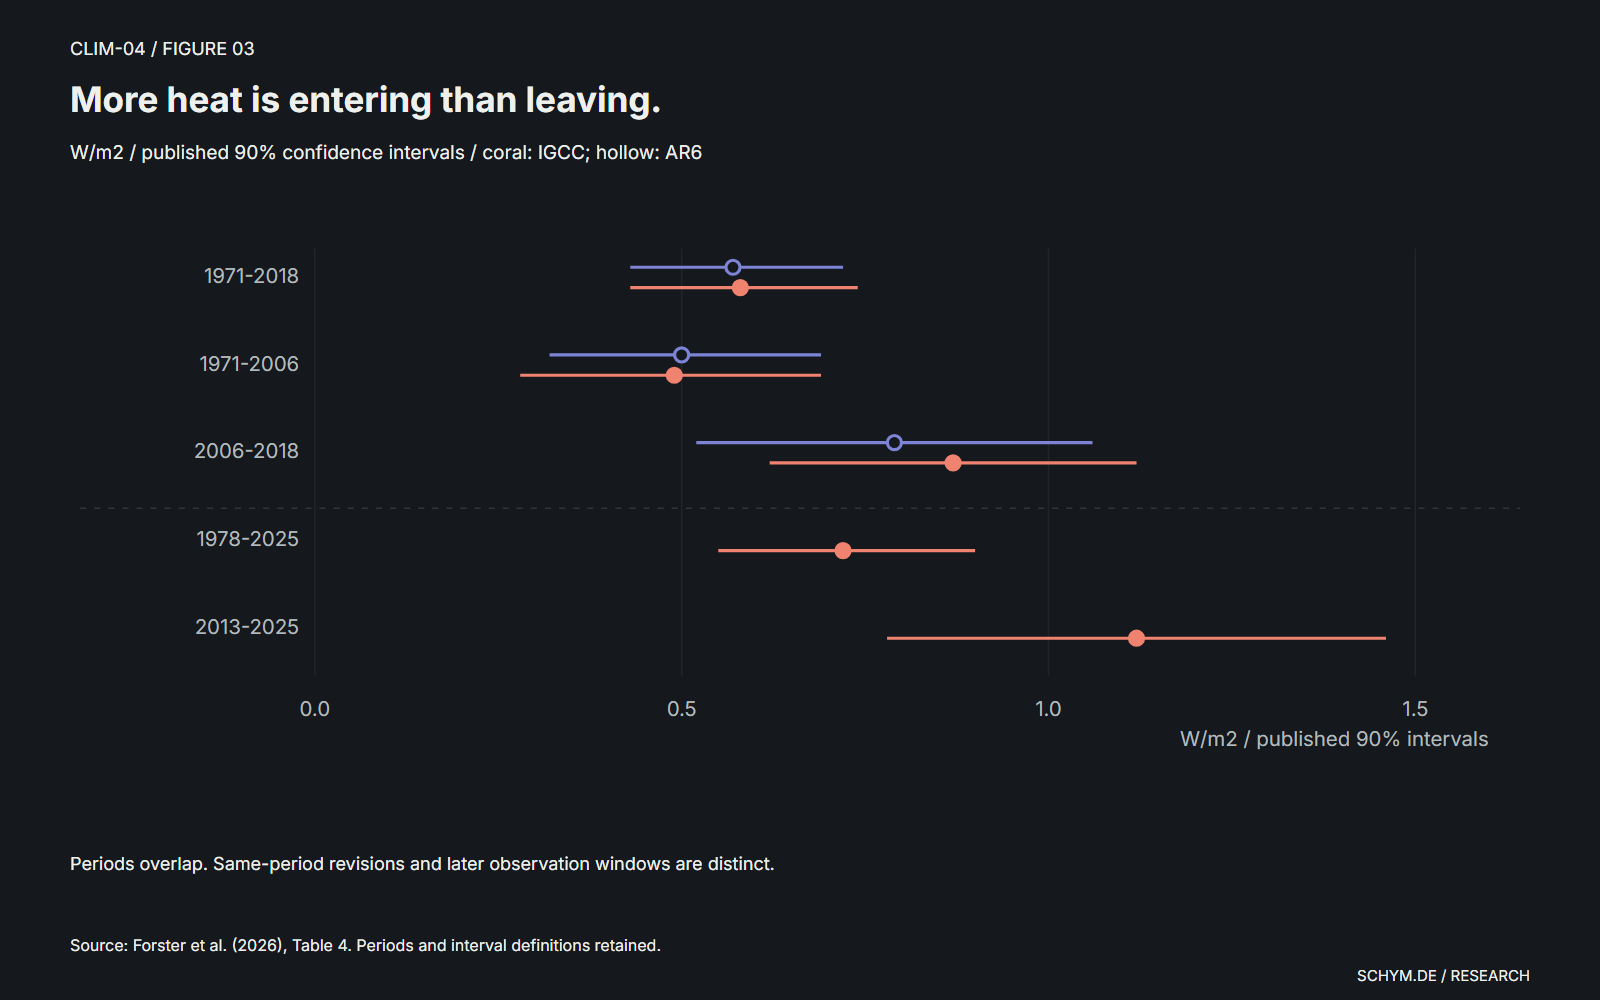
The published assessment makes two comparisons that should not be conflated. For the unchanged 2006-2018 period, AR6 reported 0.79 W/m2 with a 90% confidence interval of 0.52-1.06. IGCC's updated assessment gives 0.87, with an interval of 0.62-1.12. That is a revision of the estimate for the same period. For 2013-2025, IGCC reports 1.12 W/m2, with an interval of 0.78-1.46. That changes the observation period as well.
The whiskers preserve the published intervals, including their overlap. They are not distributions reconstructed from eight numbers, and the period estimates are not independent observations. The paper's conclusion about increasing imbalance rests on its wider assessment and method, not on a significance test invented for this page. What the displayed estimates establish directly is persistent positive net energy accumulation over the stated periods.
03 / The rate of accumulation
More heat is entering than leaving.
Earth energy imbalance / published estimates and 90% confidence intervals
IGCC 2025 / 2013-20251.12 [0.78, 1.46] W/m2
Source: Forster et al. (2026), Table 4. Top three rows compare assessment vintages for unchanged periods. Bottom two extend the window to 2025. Periods overlap; these are not independent experiments. A positive imbalance means net energy accumulation, not a surface-temperature forecast.
Exact values
| Period / assessment | Estimate | Lower | Upper |
|---|---|---|---|
| 1971-2018 / IPCC AR6 | 0.57 | 0.43 | 0.72 |
| 1971-2018 / IGCC 2025 | 0.58 | 0.43 | 0.74 |
| 1971-2006 / IPCC AR6 | 0.50 | 0.32 | 0.69 |
| 1971-2006 / IGCC 2025 | 0.49 | 0.28 | 0.69 |
| 2006-2018 / IPCC AR6 | 0.79 | 0.52 | 1.06 |
| 2006-2018 / IGCC 2025 | 0.87 | 0.62 | 1.12 |
| 1978-2025 / IGCC 2025 | 0.72 | 0.55 | 0.90 |
| 2013-2025 / IGCC 2025 | 1.12 | 0.78 | 1.46 |
IGCC 2025, 2013-2025: 1.12 [0.78, 1.46] W/m2. Published 90% confidence interval.
04 / Inspect the inventory
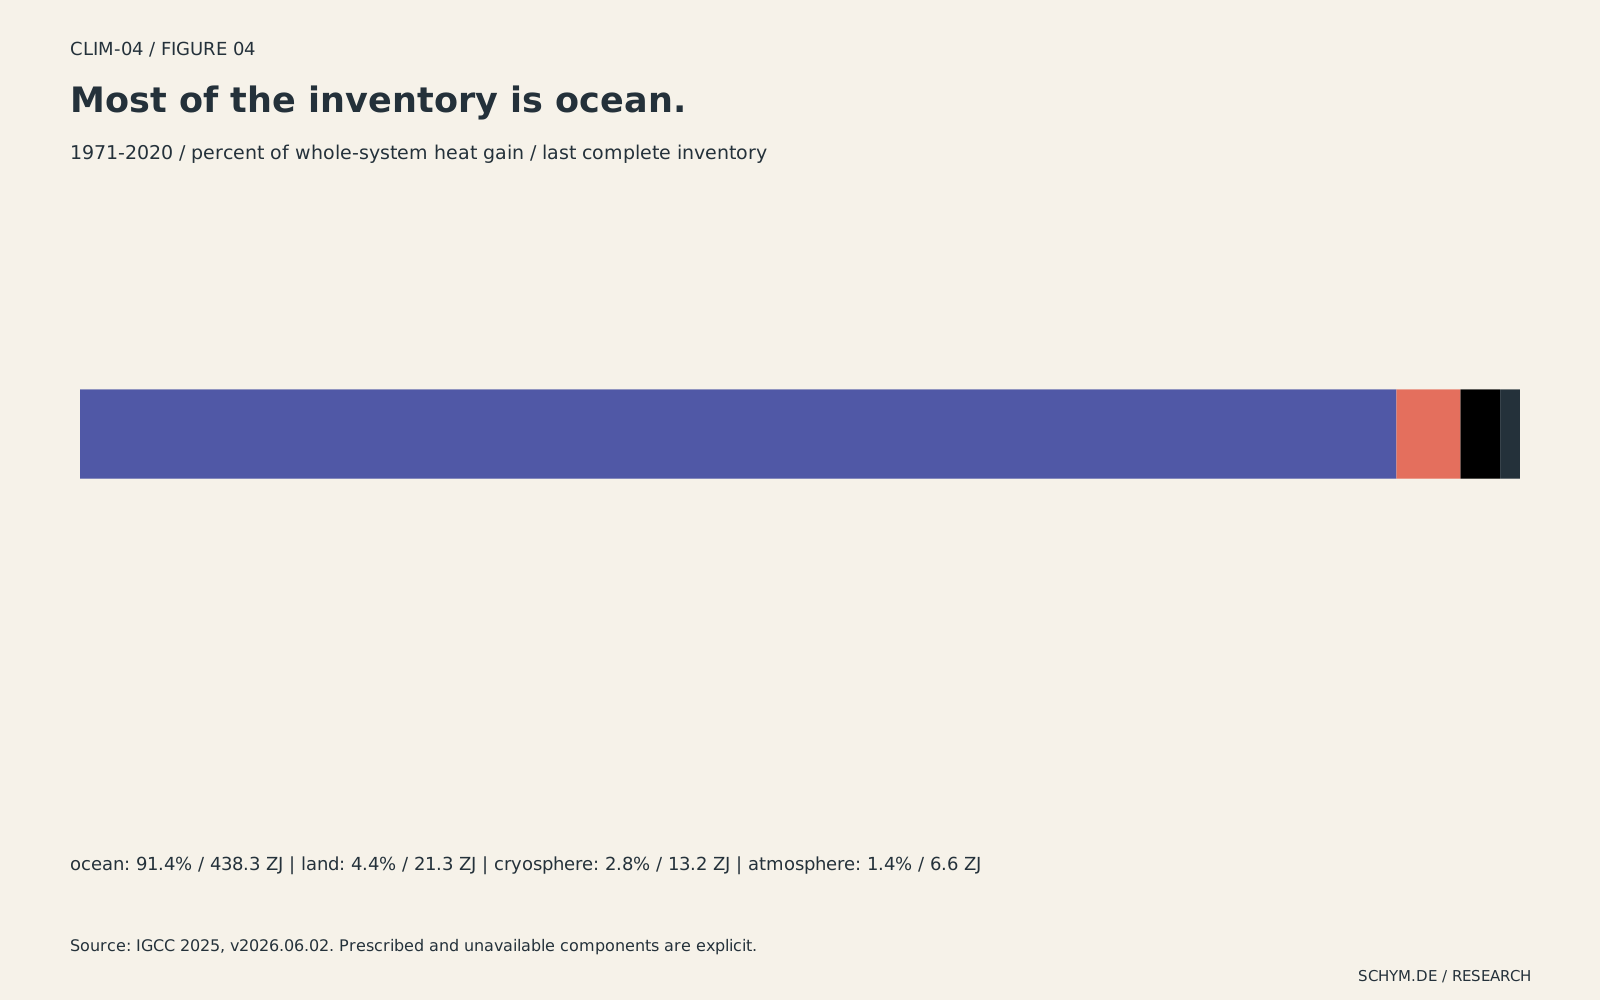
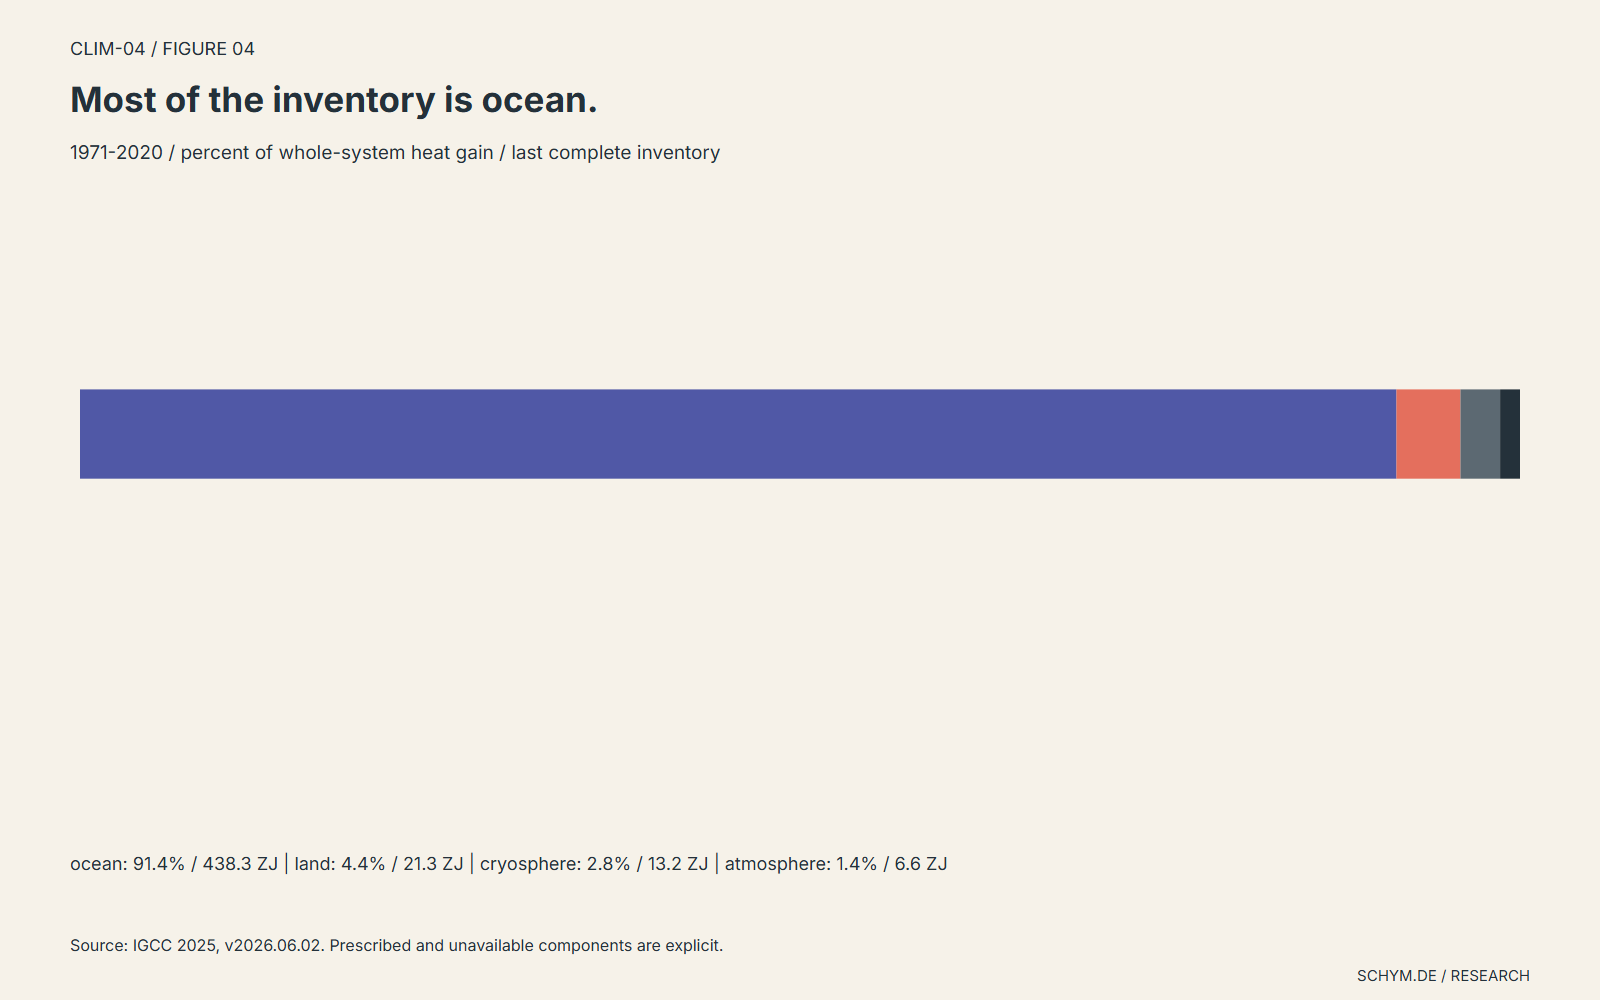
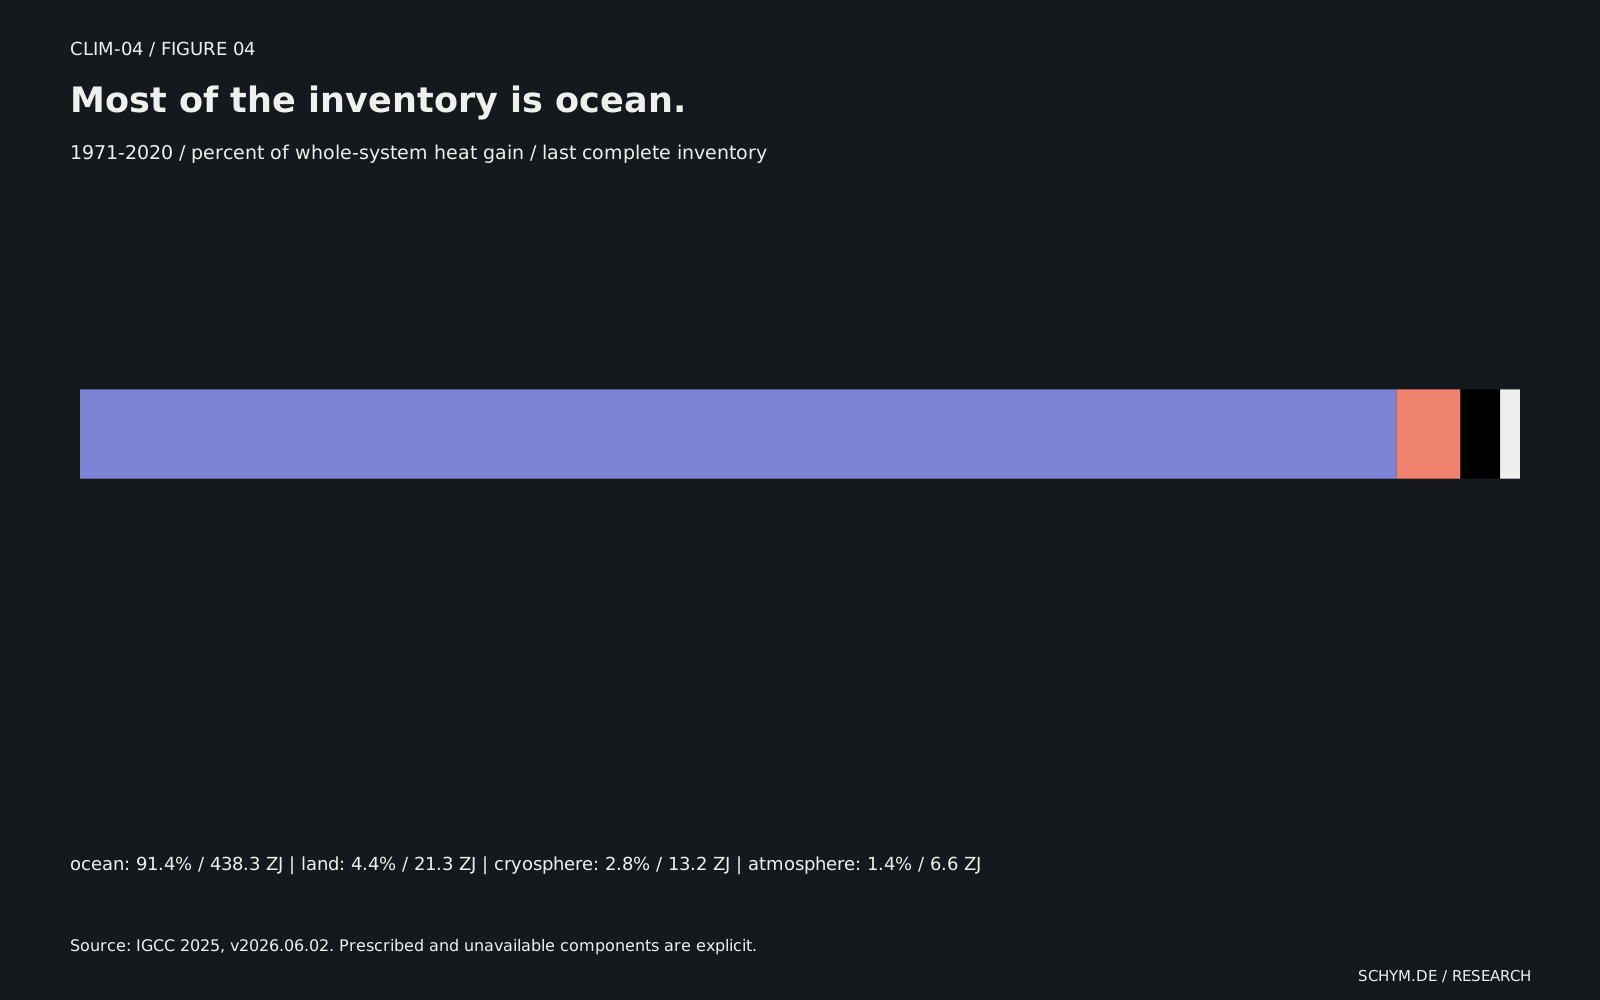
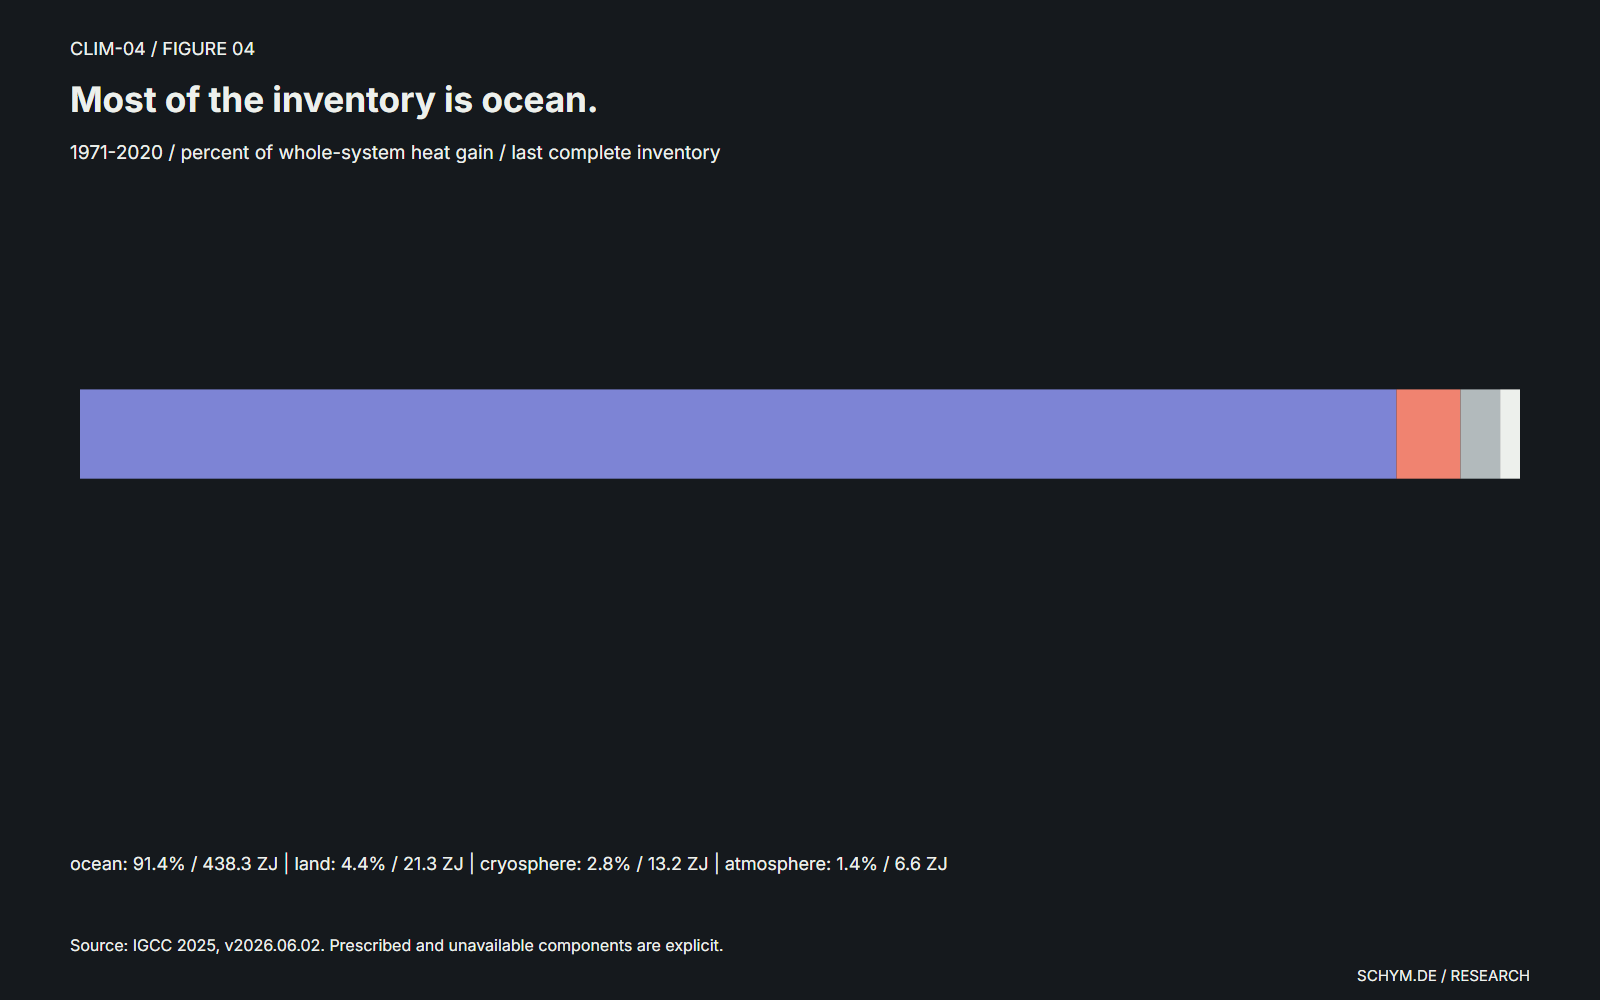
Most of the inventory is ocean. The missing remainder still matters.
The last complete component inventory in this release ends in 2020. Comparing 1971 with 2020, the ocean accounts for 91.4% of the whole-system heat increase. The denominator is the change in the entire inventory, not its endpoint level: atmosphere, land and ocean components do not all begin at zero in the supplied file.
That dominance makes ocean heat indispensable, but it does not make the other components disposable. Heat used to melt ice has consequences that are not summarized by its small percentage of the global energy account. Land and atmospheric warming also matter directly for people and ecosystems. Energy share is not impact share.
For 2021-2025, the IGCC paper estimates whole-system uptake from ocean heat change, scaled by the assessed 91% ocean share. The compact CSV leaves the later land, atmosphere, cryosphere and total fields blank. This article keeps them blank. A visibly incomplete inventory is more informative than a seamlessly extended line whose method has changed without warning.
04 / Where the energy went
Most of the inventory is ocean.
Shares of whole-system heat gain / 1971-2020 / last complete component inventory
- ocean
- 91.4%438.3 ZJ
- land
- 4.4%21.3 ZJ
- cryosphere
- 2.8%13.2 ZJ
- atmosphere
- 1.4%6.6 ZJ
Source: IGCC 2025 heat inventory. This fixed-period comparison does not extend to 2024 or 2025: land, atmosphere and cryosphere components stop in 2020. Permafrost and inland lakes are excluded in this AR6-consistent inventory.
Exact values
| Component | Change / ZJ | Share / % |
|---|---|---|
| ocean | 438.305 | 91.422 |
| land | 21.312 | 4.445 |
| cryosphere | 13.194 | 2.752 |
| atmosphere | 6.621 | 1.381 |
ocean: 91.42%, 438.30 ZJ; land: 4.45%, 21.31 ZJ; cryosphere: 2.75%, 13.19 ZJ; atmosphere: 1.38%, 6.62 ZJ. Fixed 1971-2020 inventory; energy share is not impact share.
The measurement boundary
The method changes before the line ends.
Estimated from observations
The upper and intermediate ocean layers have dated annual estimates through 2024. Historical coverage and analysis methods contribute uncertainty.
Prescribed or proxied
The deep contribution follows an assumed rate. For recent total-system uptake, the paper scales ocean heat change by an assessed 91% share.
Unavailable here
The compact inventory has no dated 2025 heat row and no land, atmosphere or cryosphere values after 2020. Those blanks remain visible.
Keep the thermometer. Add the inventory.
The practical conclusion is to ask two questions together. How warm was the surface over a defined interval? How much energy accumulated in the wider system over a compatible interval? A temporary change in the first does not answer the second.
The evidence also argues for maintaining the observing system. A global inventory depends on repeated ocean measurements, consistent processing, archived observations and explicitly assessed gaps. The apparent precision of a plotted curve cannot replace that infrastructure. Better coverage can revise an estimate without invalidating the physical distinction it measures.
AR6's assessment of widespread ocean change and long-lived consequences supplies the scientific frame. This page updates a limited set of indicators within that frame; it does not estimate local marine exposure, forecast an individual year or translate stored joules into an unavoidable amount of future surface warming. The conclusion is narrower and more useful: the surface record is essential, and it is not the complete heat account.
What these data do not show
- The common dated annual record ends in 2024. The undated final IGCC row is excluded from time comparisons; NASA's incomplete 2026 year is excluded entirely.
- A global heat inventory cannot locate a marine ecosystem's exposure or explain a particular heatwave. It is not a spatial temperature map.
- The below-2,000 meter contribution is prescribed. Whole-system components after 2020 are not present in the compact source; the published assessment uses an ocean-based proxy for later uptake.
- Annual ocean-error magnitudes lack a confidence definition and temporal covariance in the compact CSV. No new confidence interval is invented for endpoint changes or the derived heat share.
- Endpoint differences are descriptive. Overlapping windows and shared inputs cannot be treated as independent evidence of causality or statistical acceleration.
Audit the record
Sources and methods
IGCC heat data are frozen at v2026.06.02, retrieved September 12, 2026; NASA GISTEMP v4 is a separate September 12 retrieval snapshot. The source files are immutable and hash-bound. The parser checks column identities, annual bounds, consecutive years, finite values, nonnegative error magnitudes and layer reconciliation. It retains missing components as null and the final undated heat row as an unassigned source record. NASA's published J-D annual means are used only when all twelve months and the annual mean are available. No temperature rebasing, interpolation or gridded reconstruction is performed.
The interactive interval is end-year minus start-year for either ten or twenty elapsed years, requiring every intervening annual observation. The depth switch changes only the displayed ocean scope; the published full-depth change remains visible. Heat-destination shares divide each component's 1971-2020 change by the corresponding total change. Table 4 is parsed from the publisher's XLSX, preserving the assessment labels, dates and explicit 90% confidence intervals. Raw annual heat-error columns remain in the preserved source; they are not propagated through endpoint differences.
The photograph is contextual NASA imagery of ocean internal-wave patterns, not a measurement of heat content. The article and charts use the existing Schym semantic tokens. No source data are fetched by a reader's browser.
Figure exports
- Forster et al. (2026), Indicators of Global Climate Change 2025
Section 6, Figure 7 and Table 4: heat inventory, depth assumptions, recent ocean-based proxy and assessed energy-imbalance intervals. CC BY 4.0.
- IGCC data release v2026.06.02
Versioned heat inventory. The final row lacks all three time fields; this source defect is preserved and excluded from dated comparisons.
- NASA GISS/GISTEMP v4
Global land-ocean temperature estimates, 1951-1980 reference. Complete annual means from the September 12, 2026 retrieval; cite GISTEMP Team (2026) and Lenssen et al. (2024).
- Lenssen et al. (2024), GISTEMPv4 observational uncertainty ensemble
NASA product methods and uncertainty research; this article does not import or reconstruct the ensemble.
- IPCC AR6 Synthesis Report, Summary for Policymakers
Scientific frame: SPM A.2 and B.3. Post-AR6 indicator updates are distinguished from the 2023 assessment.
Photograph: NASA/STS-44 crew. Sunlight revealing internal-wave patterns in the western Indian Ocean, photographed from Atlantis in 1991. Context, not a heat-content observation.