CLIM-03 / The polar comparison
Two poles, different losses.
The Arctic and Antarctic share a calendar, not an ice history. In September, the recent decade had 31.3% less Arctic sea ice than the 1990s comparison period. The Antarctic difference was 3.4%. Keep both poles in view.
September means / 2016-2025 versus 1991-2000
- Arctic
- −31.3%
- Near the end of the melt season
- Antarctic
- −3.4%
- Near the end of the growth season
Different magnitudes. The same two complete decades. See the exact comparison.
The same month is not the same season.
A global sea-ice total is a possible sum and an incomplete explanation. It combines an ocean surrounded by continents with a continent surrounded by ocean, puts opposite seasons into the same observation, and can conceal a large regional change behind a much larger seasonal cycle. The useful comparison begins one level below that total: the same month, the same definition, two separate histories.
Hover to preview an exact pair without changing the comparison. Click, tap or press Enter on a chart to pin; Escape releases it. Arrow keys select dates. The shaded selection and its permanent link remain distinct from the dashed preview.
01 / Keep the poles apart
Two poles. One comparison.
September is close to the end of the Arctic melt season and the Antarctic growth season. Those are not equivalent physical conditions. They are, however, the same position in the calendar each year, which makes September-to-September comparisons within each pole meaningful.
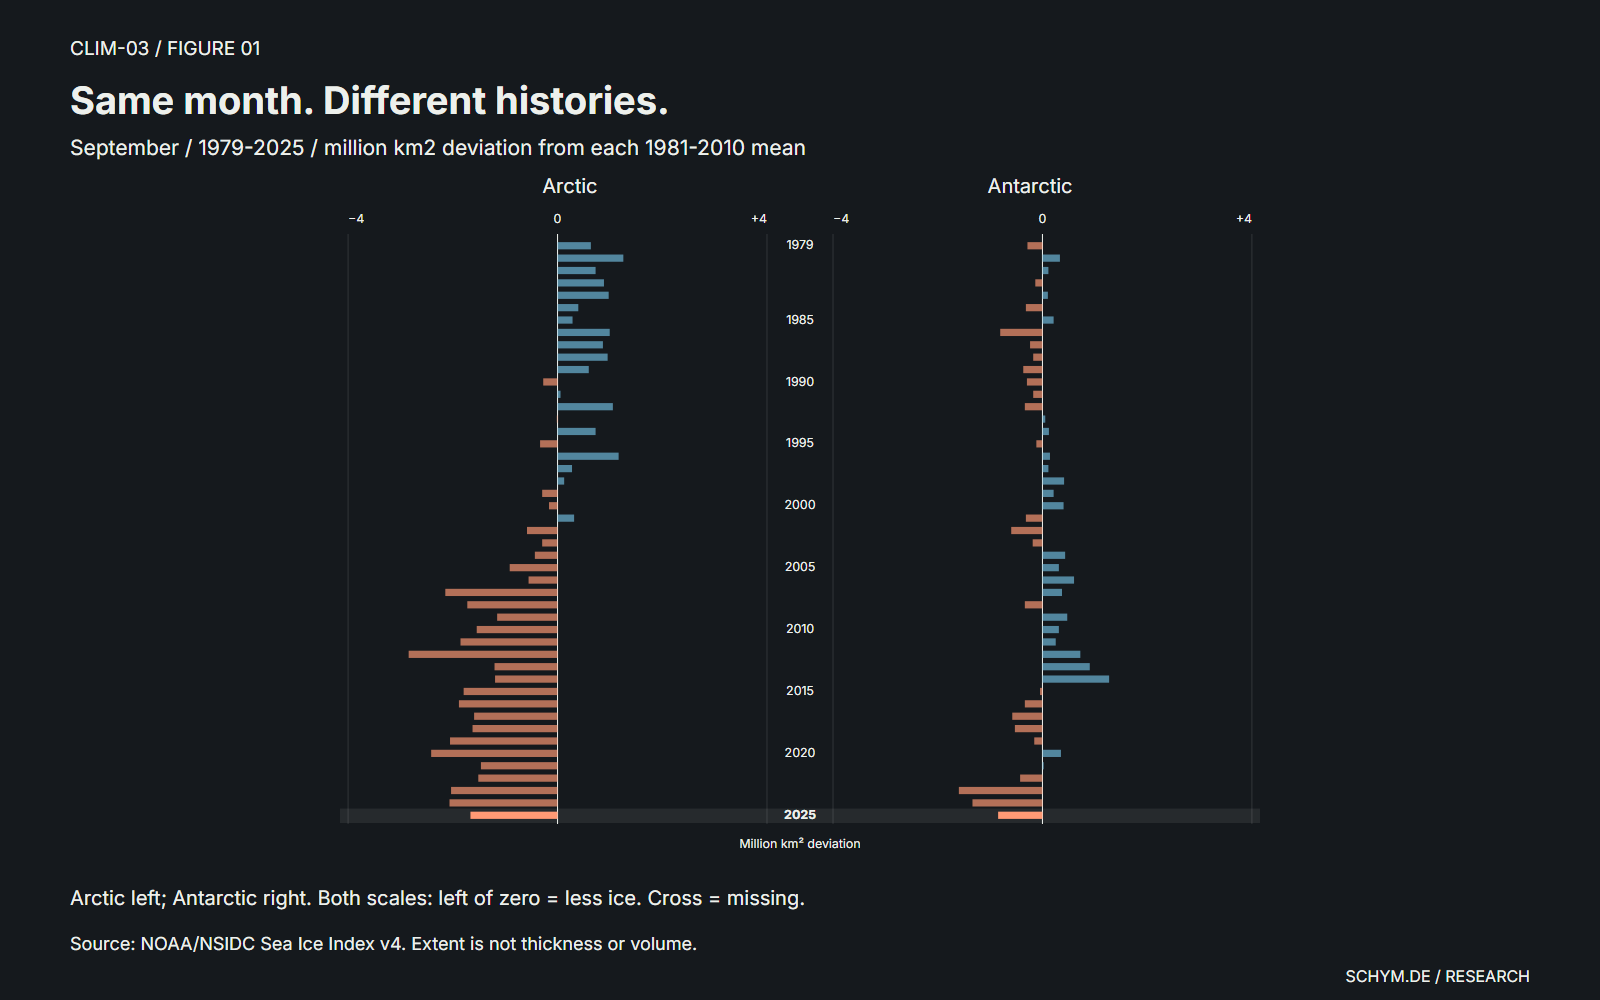
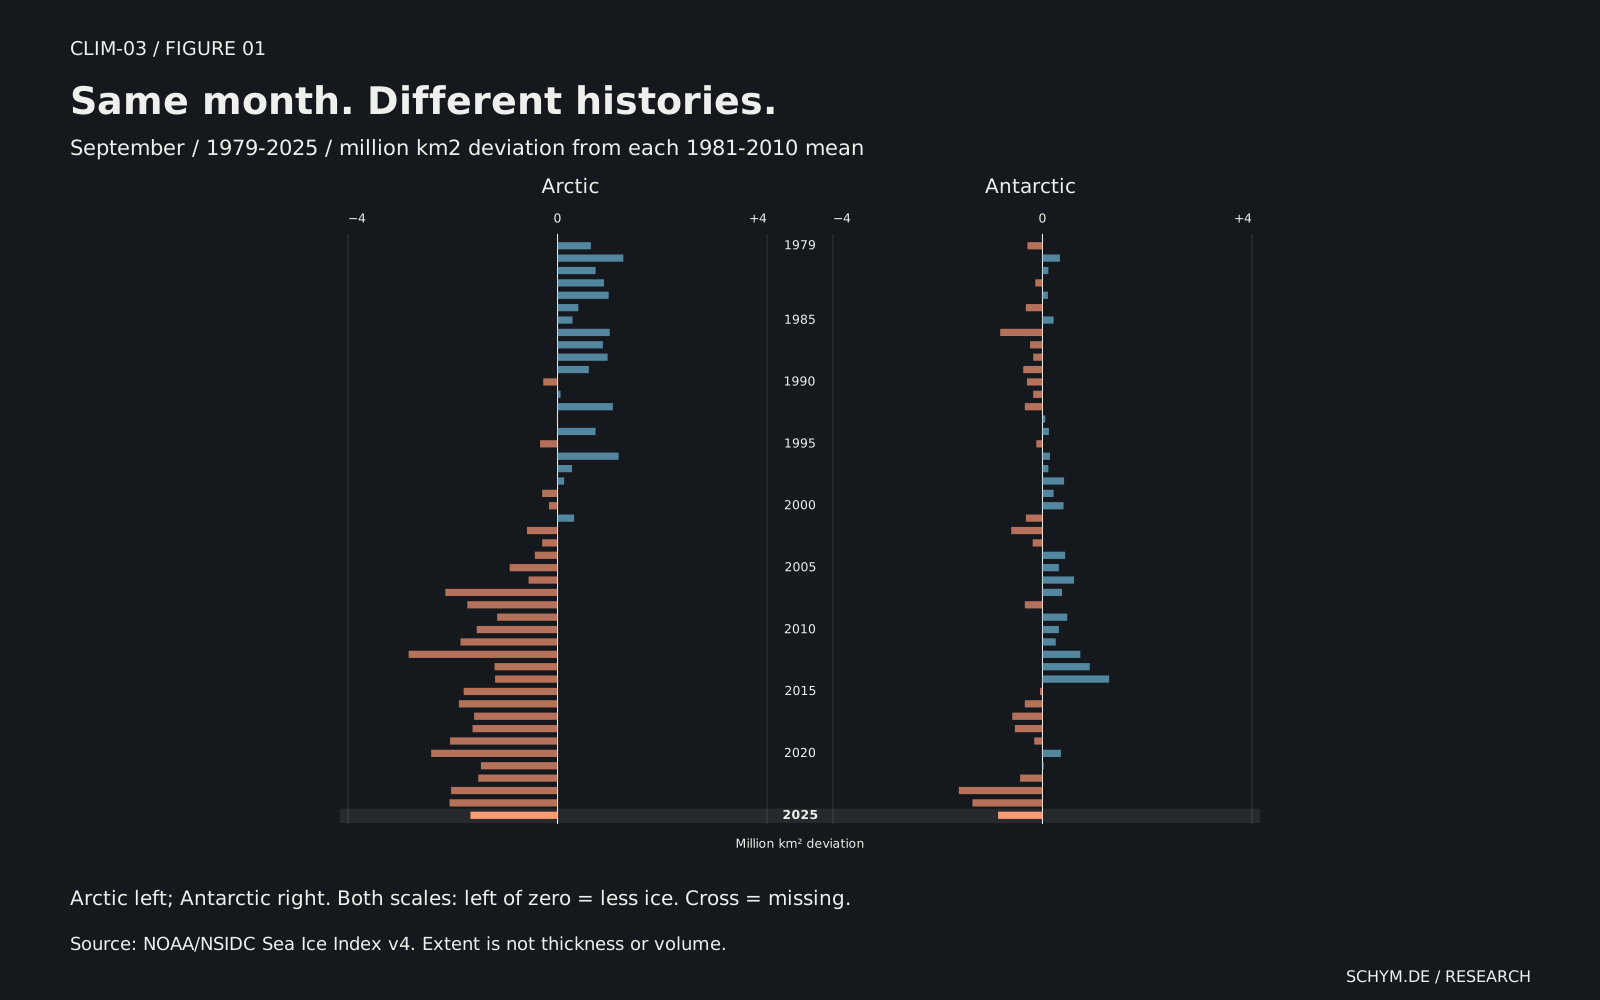
Figure 01 / The paired record
Same month. Different histories.
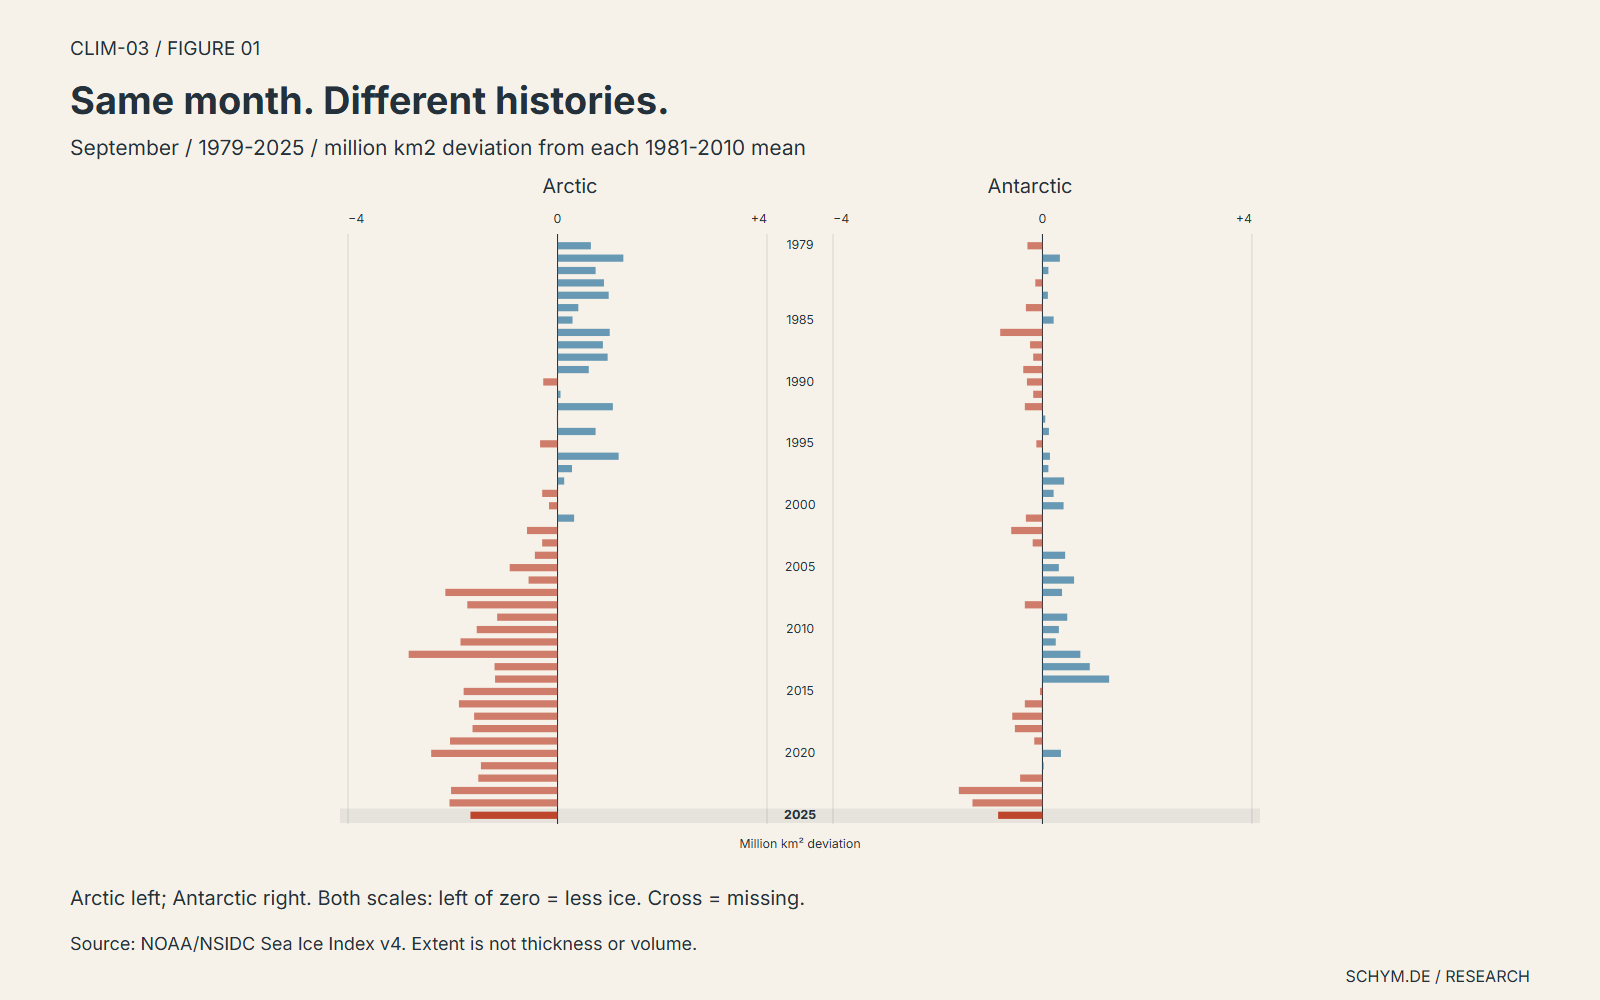
September / 1979-2025 / deviations from each pole's 1981-2010 monthly mean
ArcticOcean inside continents
AntarcticOcean around a continent
Arctic: 4.750 million km2; deviation −1.663 million km2 / −25.94% from its own 1981-2010 monthly mean. Antarctic: 17.640 million km2; deviation −0.847 million km2 / −4.58% from its own 1981-2010 monthly mean
Preview. Click, tap, or press Enter to pin.Source: NOAA/NSIDC Sea Ice Index v4. Reference counts: Arctic 30/30 years; Antarctic 30/30 years. The same month and scale apply to both poles. A cross is missing data, not zero.
Exact values
| Year | Arctic extent | Arctic deviation | Antarctic extent | Antarctic deviation |
|---|---|---|---|---|
| 1979 | 7.05 | +0.637 | 18.20 | −0.287 |
| 1980 | 7.67 | +1.257 | 18.82 | +0.333 |
| 1981 | 7.14 | +0.727 | 18.60 | +0.113 |
| 1982 | 7.30 | +0.887 | 18.35 | −0.137 |
| 1983 | 7.39 | +0.977 | 18.59 | +0.103 |
| 1984 | 6.81 | +0.397 | 18.17 | −0.317 |
| 1985 | 6.70 | +0.287 | 18.70 | +0.213 |
| 1986 | 7.41 | +0.997 | 17.68 | −0.807 |
| 1987 | 7.28 | +0.867 | 18.25 | −0.237 |
| 1988 | 7.37 | +0.957 | 18.31 | −0.177 |
| 1989 | 7.01 | +0.597 | 18.12 | −0.367 |
| 1990 | 6.14 | −0.273 | 18.19 | −0.297 |
| 1991 | 6.47 | +0.057 | 18.31 | −0.177 |
| 1992 | 7.47 | +1.057 | 18.15 | −0.337 |
| 1993 | 6.40 | −0.013 | 18.54 | +0.053 |
| 1994 | 7.14 | +0.727 | 18.61 | +0.123 |
| 1995 | 6.08 | −0.333 | 18.37 | −0.117 |
| 1996 | 7.58 | +1.167 | 18.63 | +0.143 |
| 1997 | 6.69 | +0.277 | 18.60 | +0.113 |
| 1998 | 6.54 | +0.127 | 18.90 | +0.413 |
| 1999 | 6.12 | −0.293 | 18.70 | +0.213 |
| 2000 | 6.25 | −0.163 | 18.89 | +0.403 |
| 2001 | 6.73 | +0.317 | 18.17 | −0.317 |
| 2002 | 5.83 | −0.583 | 17.89 | −0.597 |
| 2003 | 6.12 | −0.293 | 18.30 | −0.187 |
| 2004 | 5.98 | −0.433 | 18.92 | +0.433 |
| 2005 | 5.50 | −0.913 | 18.80 | +0.313 |
| 2006 | 5.86 | −0.553 | 19.09 | +0.603 |
| 2007 | 4.27 | −2.143 | 18.86 | +0.373 |
| 2008 | 4.69 | −1.723 | 18.15 | −0.337 |
| 2009 | 5.26 | −1.153 | 18.96 | +0.473 |
| 2010 | 4.87 | −1.543 | 18.80 | +0.313 |
| 2011 | 4.56 | −1.853 | 18.74 | +0.253 |
| 2012 | 3.57 | −2.843 | 19.21 | +0.723 |
| 2013 | 5.21 | −1.203 | 19.39 | +0.903 |
| 2014 | 5.22 | −1.193 | 19.76 | +1.273 |
| 2015 | 4.62 | −1.793 | 18.44 | −0.047 |
| 2016 | 4.53 | −1.883 | 18.15 | −0.337 |
| 2017 | 4.82 | −1.593 | 17.91 | −0.577 |
| 2018 | 4.79 | −1.623 | 17.96 | −0.527 |
| 2019 | 4.36 | −2.053 | 18.33 | −0.157 |
| 2020 | 4.00 | −2.413 | 18.84 | +0.353 |
| 2021 | 4.95 | −1.463 | 18.51 | +0.023 |
| 2022 | 4.90 | −1.513 | 18.06 | −0.427 |
| 2023 | 4.38 | −2.033 | 16.89 | −1.597 |
| 2024 | 4.35 | −2.063 | 17.15 | −1.337 |
| 2025 | 4.75 | −1.663 | 17.64 | −0.847 |
The paired histories subtract each pole's own 1981-2010 mean for the selected month. The reference is a comparison period, not an undisturbed climate and not a target. Bars to the left of zero represent less extent; bars to the right represent more. Both poles use the same direction and the same scale.
The northern history has a persistent recent shortfall. Antarctica has a different sequence, including years above its reference before the more recent low observations. A selected endpoint can therefore change the impression much more than the word 'global' suggests. Neither pole is a control group for the other.
02 / Keep the periods fixed
The comparison window
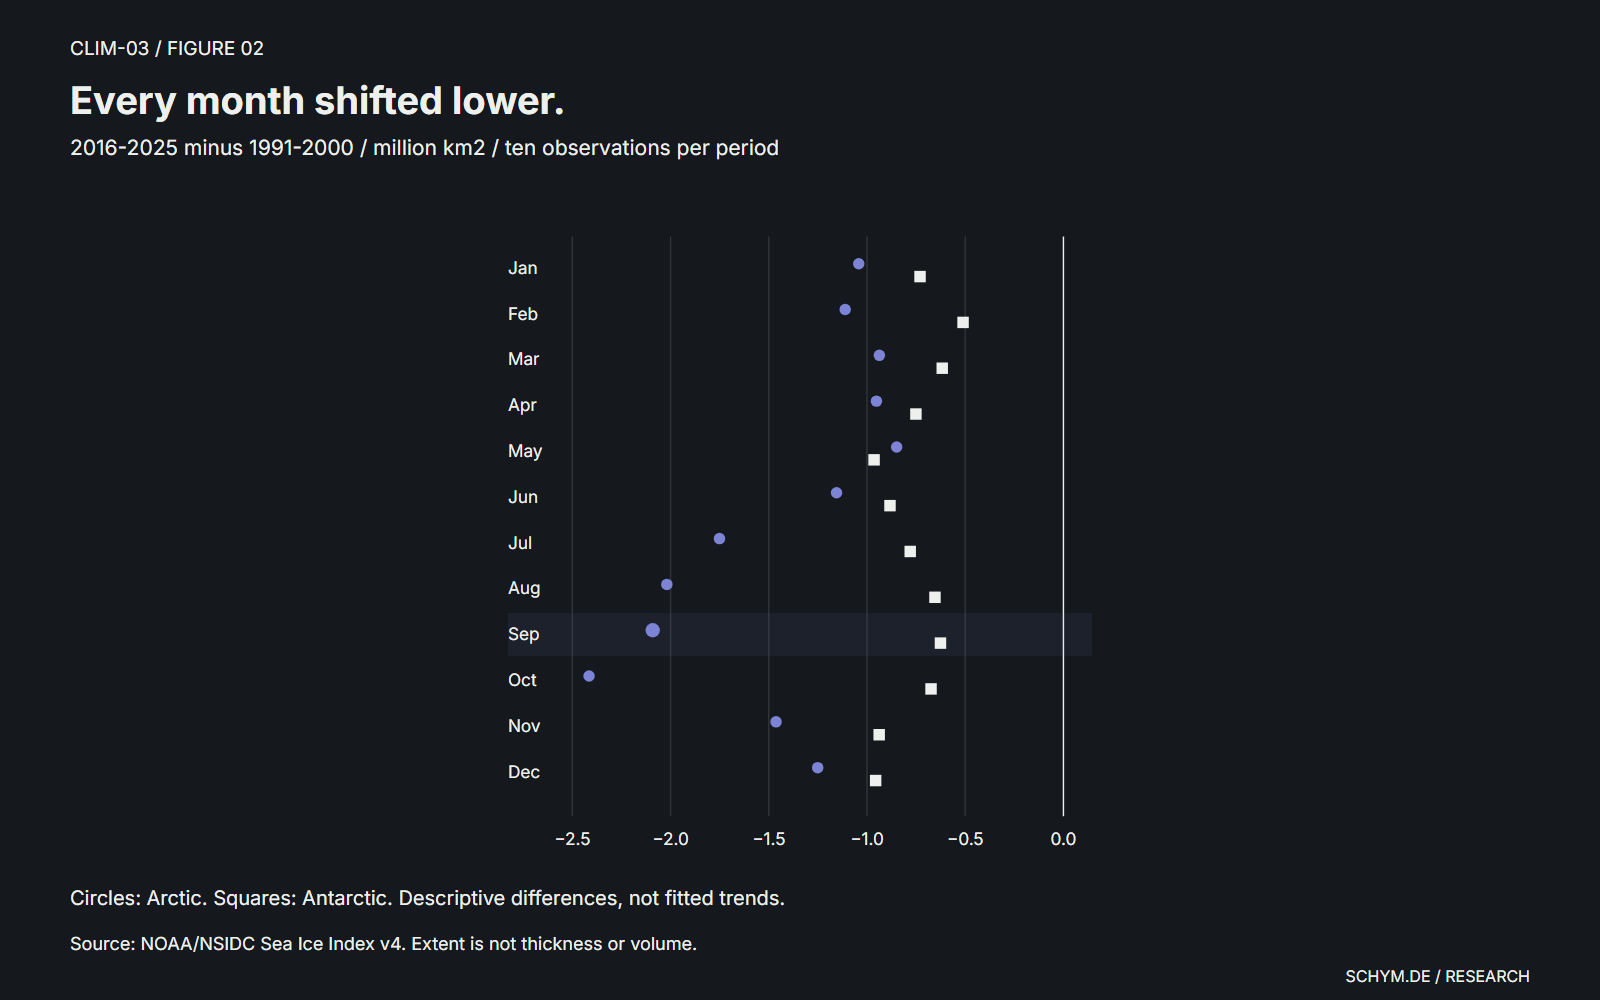
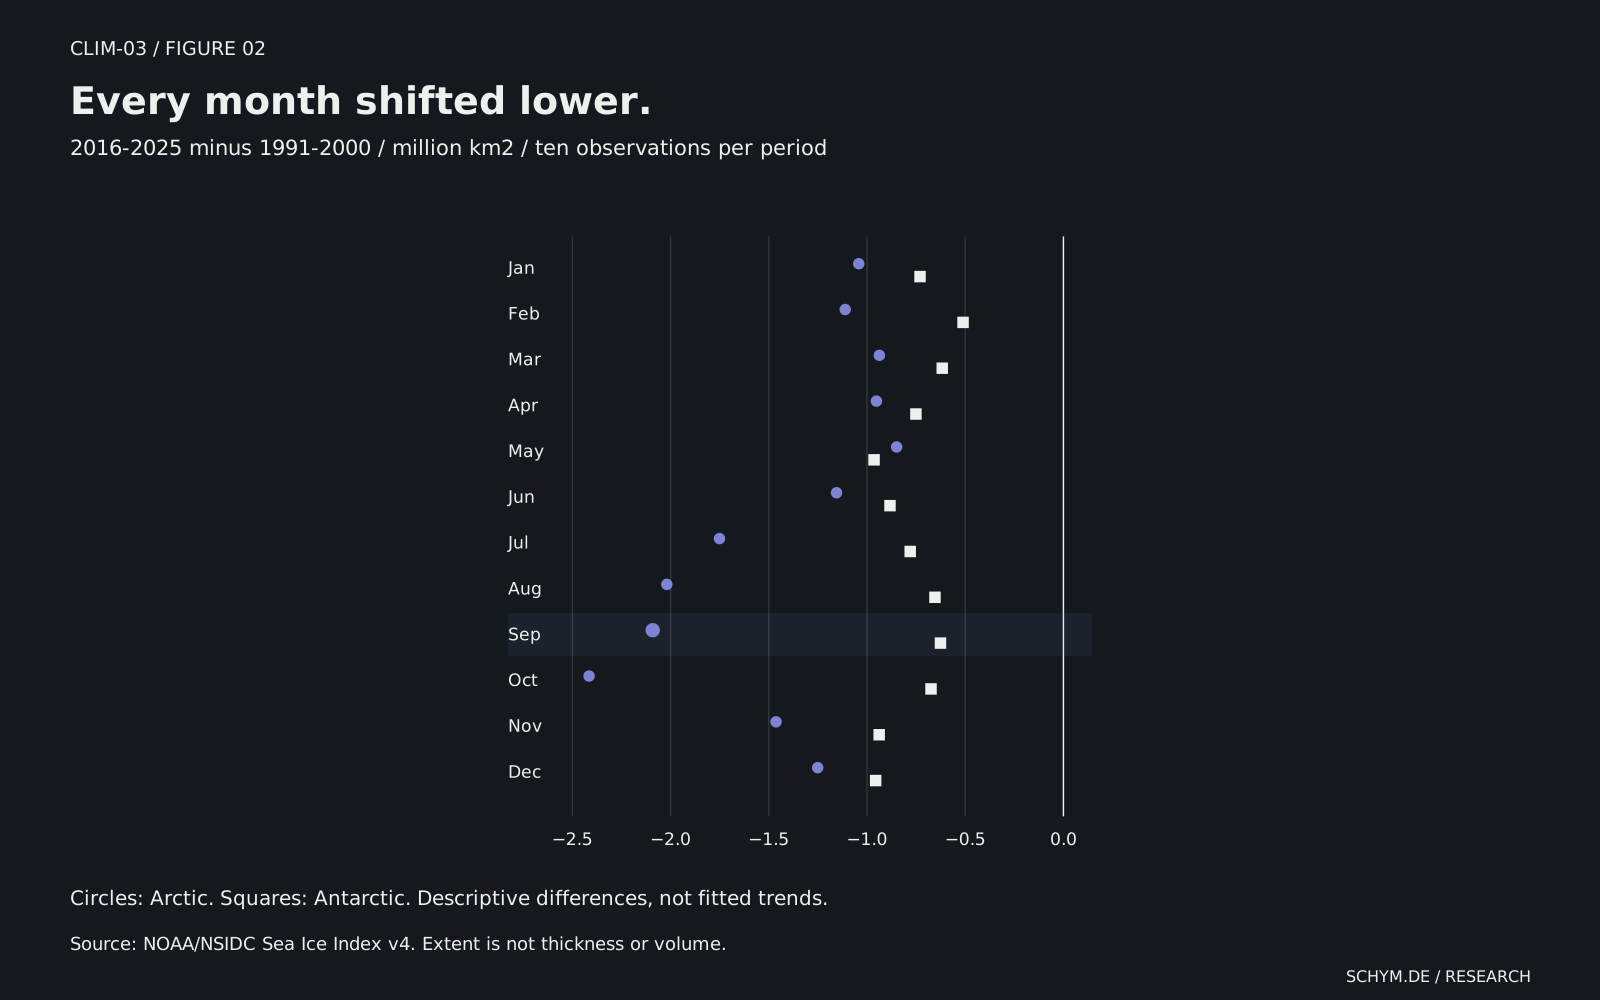
A single exceptional year is not a decade. This comparison holds two ten-year periods fixed: 1991-2000 and 2016-2025. Each point is the difference between ten published observations for the same calendar month.
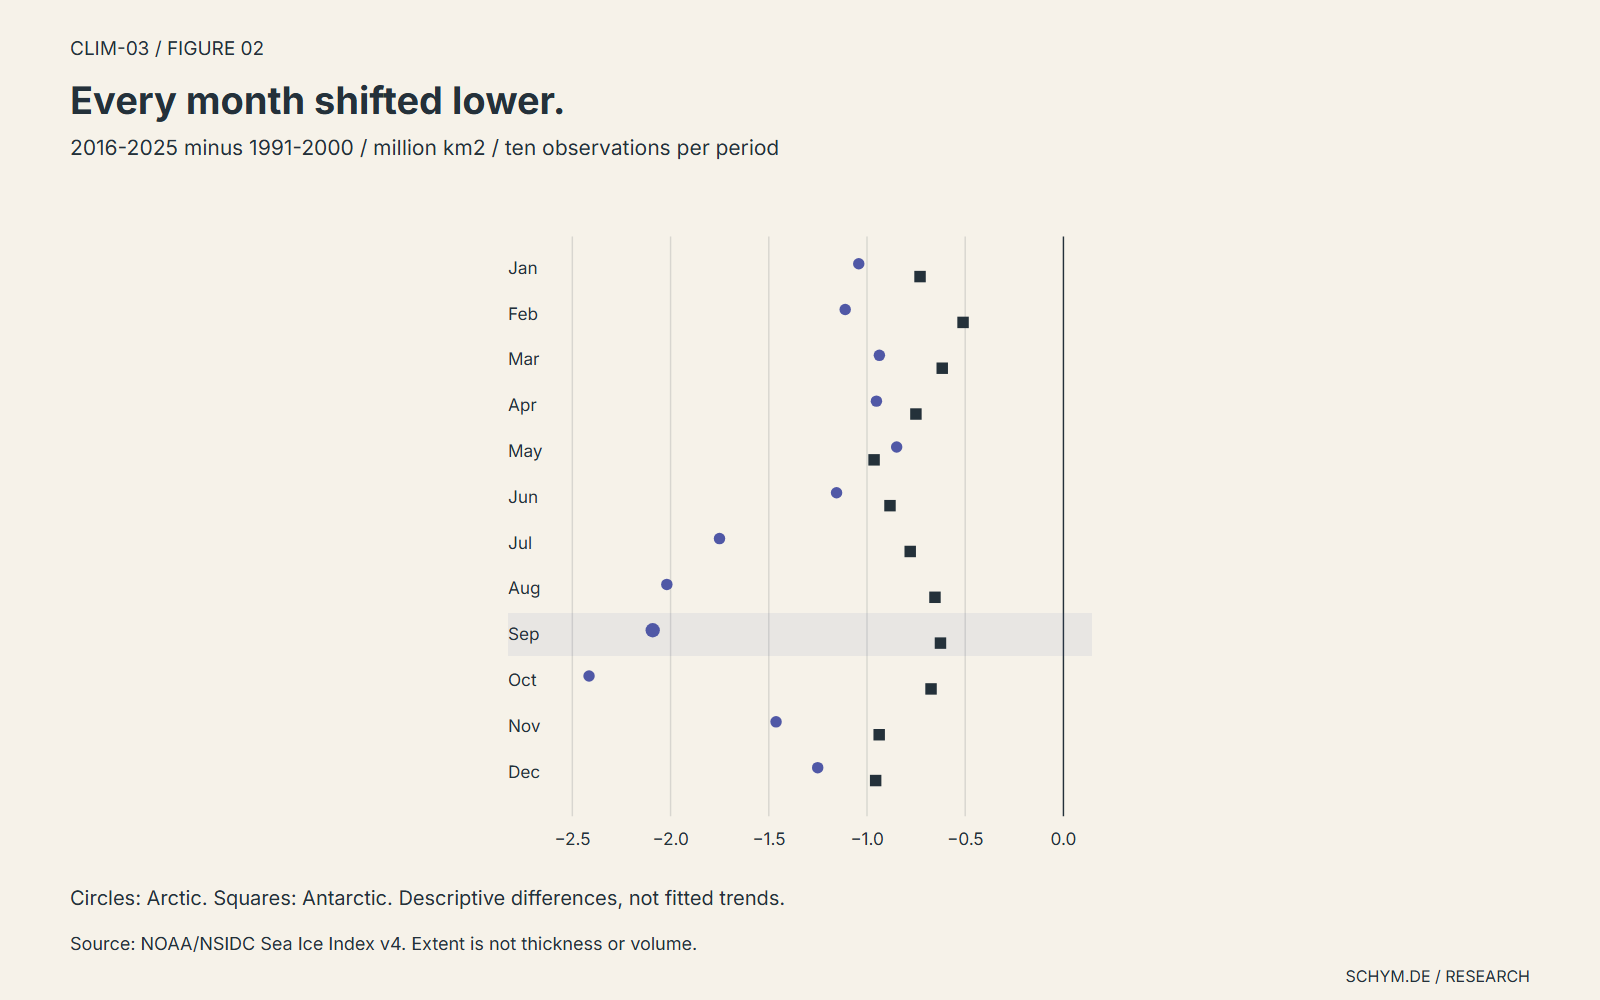
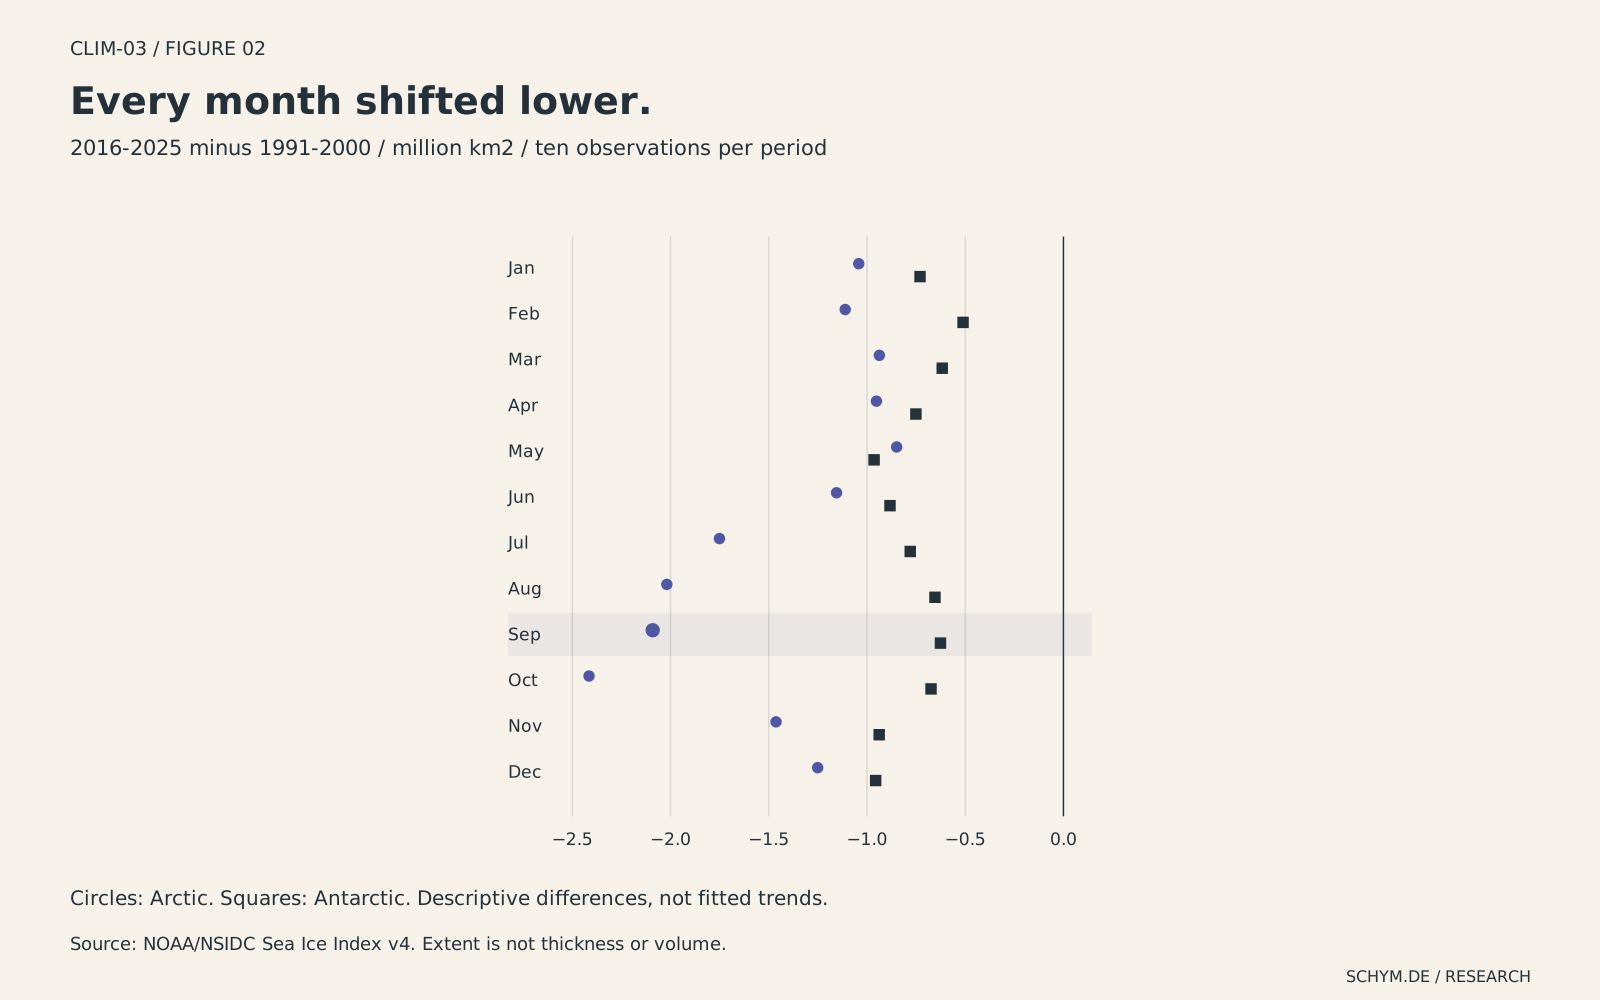
Figure 02 / Fixed decades
Every month shifted lower.
2016-2025 minus 1991-2000 / million km²
Arctic: −2.091 million km2; −31.33% of its 1991-2000 mean. 2016-2025 minus 1991-2000. Antarctic: −0.626 million km2; −3.37% of its 1991-2000 mean. 2016-2025 minus 1991-2000.
Preview. Click, tap, or press Enter to pin.Selected / SeptemberArctic: −2.091 million km2 / −31.3%Antarctic: −0.626 million km2 / −3.4%
Source: NOAA/NSIDC Sea Ice Index v4. Ten observed years in each period and month, at both poles. These are differences of means, not fitted trends; no confidence interval is inferred.
Exact values
| Month / pole | 1991-2000 | 2016-2025 | Difference | Change / % |
|---|---|---|---|---|
| January / Arctic | 14.512 | 13.470 | −1.042 | −7.18 |
| February / Arctic | 15.398 | 14.287 | −1.111 | −7.22 |
| March / Arctic | 15.433 | 14.496 | −0.937 | −6.07 |
| April / Arctic | 14.727 | 13.775 | −0.952 | −6.46 |
| May / Arctic | 13.341 | 12.492 | −0.849 | −6.36 |
| June / Arctic | 11.857 | 10.702 | −1.155 | −9.74 |
| July / Arctic | 9.622 | 7.871 | −1.751 | −18.20 |
| August / Arctic | 7.444 | 5.425 | −2.019 | −27.12 |
| September / Arctic | 6.674 | 4.583 | −2.091 | −31.33 |
| October / Arctic | 8.633 | 6.218 | −2.415 | −27.97 |
| November / Arctic | 10.810 | 9.347 | −1.463 | −13.53 |
| December / Arctic | 12.985 | 11.734 | −1.251 | −9.63 |
| January / Antarctic | 4.921 | 4.191 | −0.730 | −14.83 |
| February / Antarctic | 2.958 | 2.447 | −0.511 | −17.28 |
| March / Antarctic | 4.005 | 3.388 | −0.617 | −15.41 |
| April / Antarctic | 6.962 | 6.211 | −0.751 | −10.79 |
| May / Antarctic | 10.369 | 9.405 | −0.964 | −9.30 |
| June / Antarctic | 13.372 | 12.489 | −0.883 | −6.60 |
| July / Antarctic | 15.971 | 15.191 | −0.780 | −4.88 |
| August / Antarctic | 17.803 | 17.149 | −0.654 | −3.67 |
| September / Antarctic | 18.570 | 17.944 | −0.626 | −3.37 |
| October / Antarctic | 18.119 | 17.445 | −0.674 | −3.72 |
| November / Antarctic | 15.850 | 14.912 | −0.938 | −5.92 |
| December / Antarctic | 10.214 | 9.258 | −0.956 | −9.36 |
Both poles have lower recent-decade means in all twelve months. The size of the loss varies markedly by season. In September, the Arctic mean moved from 6.674 to 4.583 million km2, a difference of 2.091 million km2. The Antarctic mean moved from 18.570 to 17.944 million km2, a difference of 0.626 million km2.
An absolute change asks how much ocean area changed category. A percentage asks how large that change is relative to the early period's mean. Smaller summer ice cover can produce a large percentage difference from a modest absolute change. Neither denominator should quietly replace the other.
03 / Keep the seasons visible
The seasonal offset
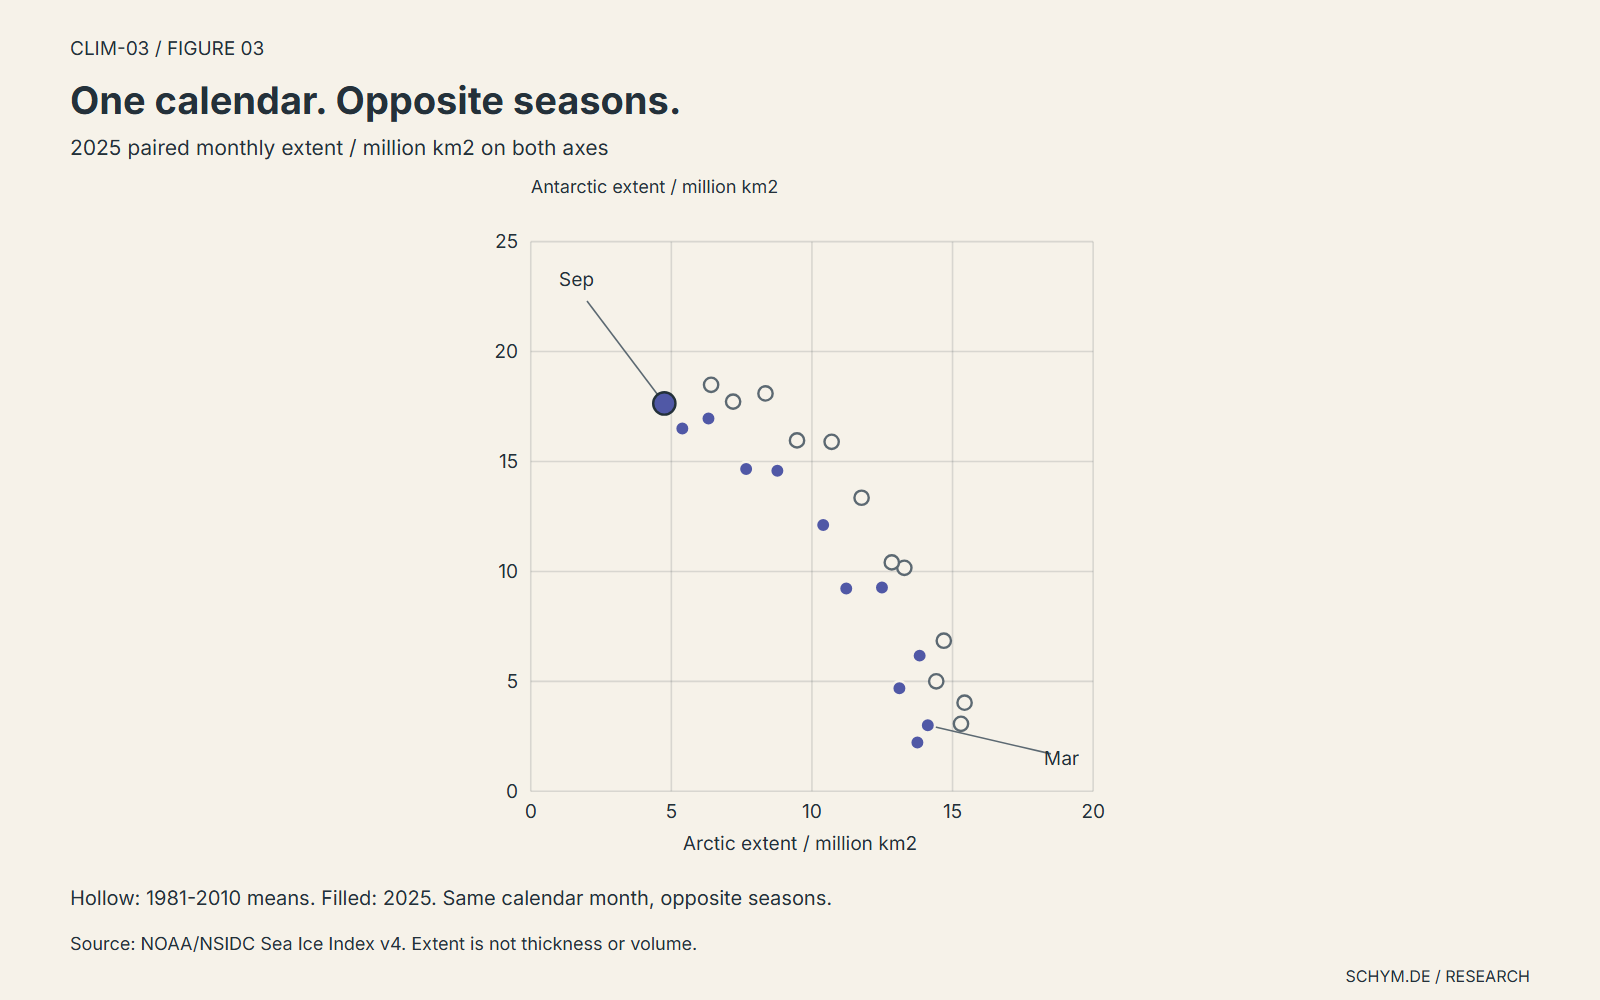
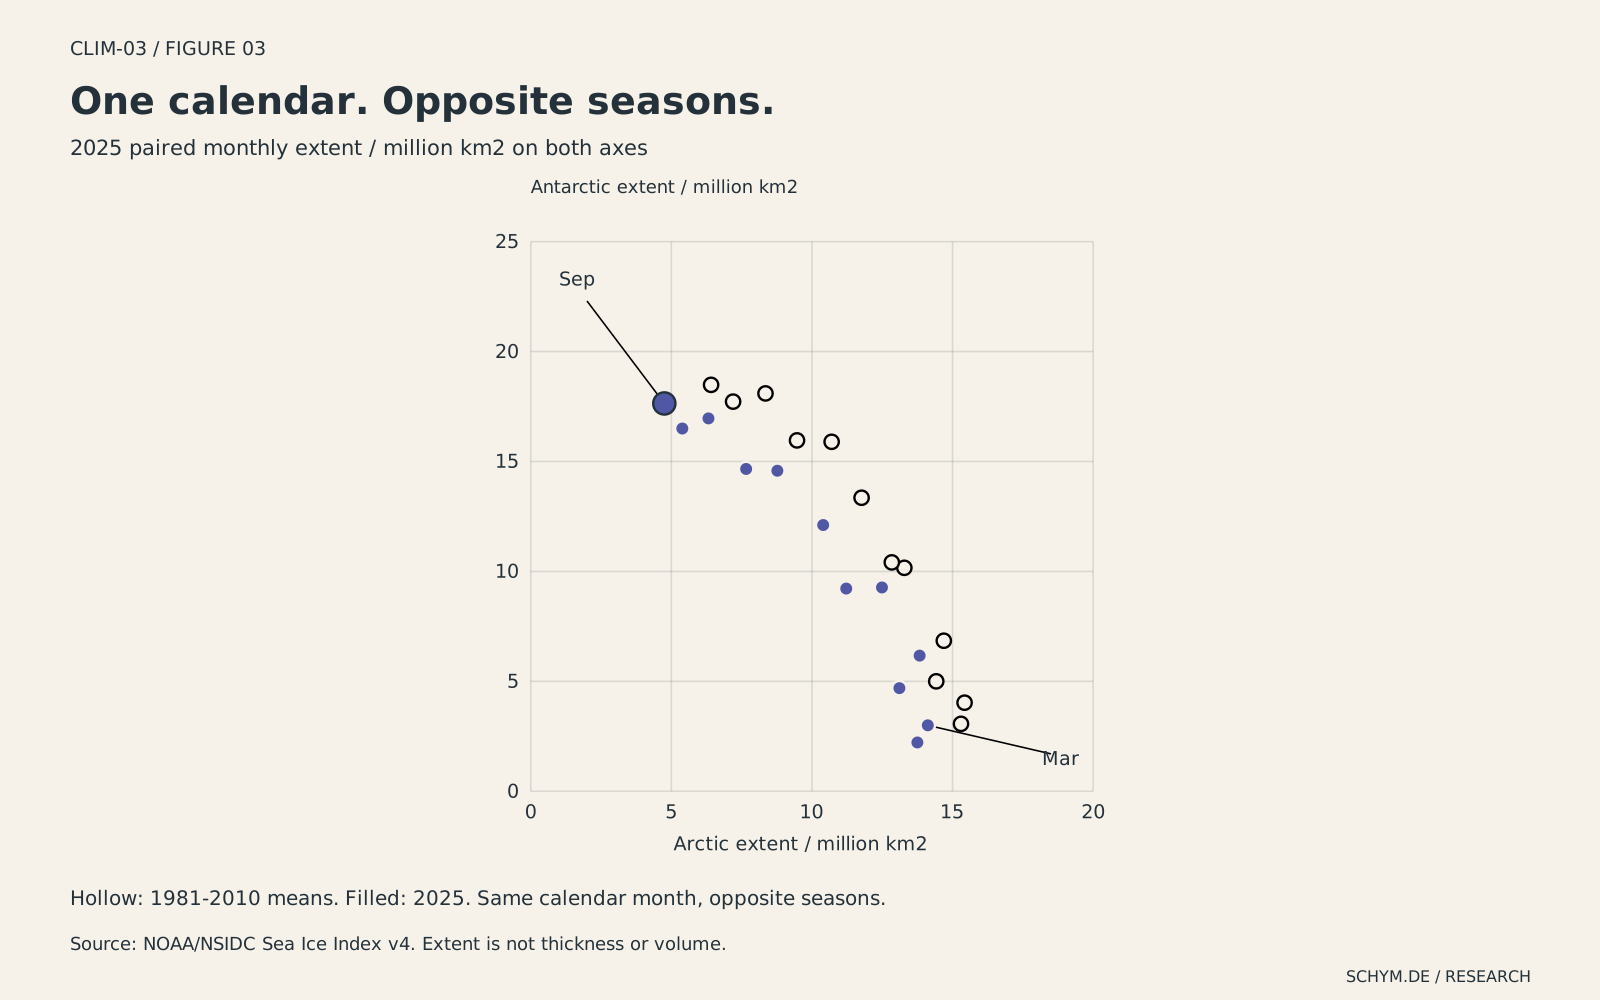
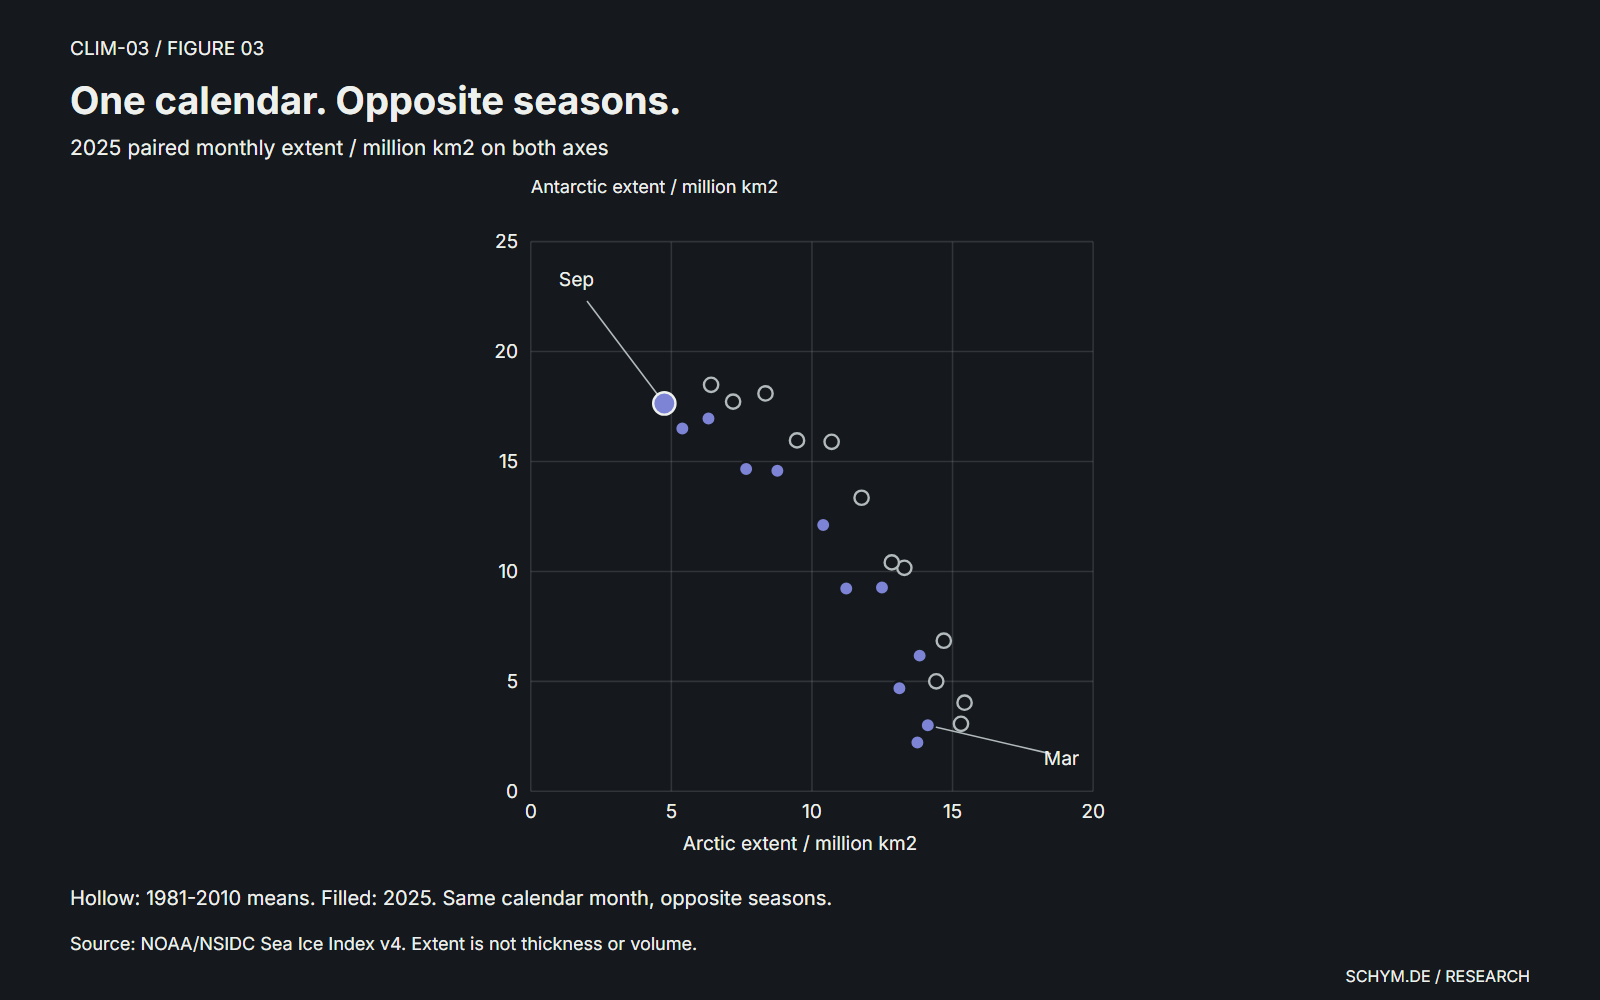
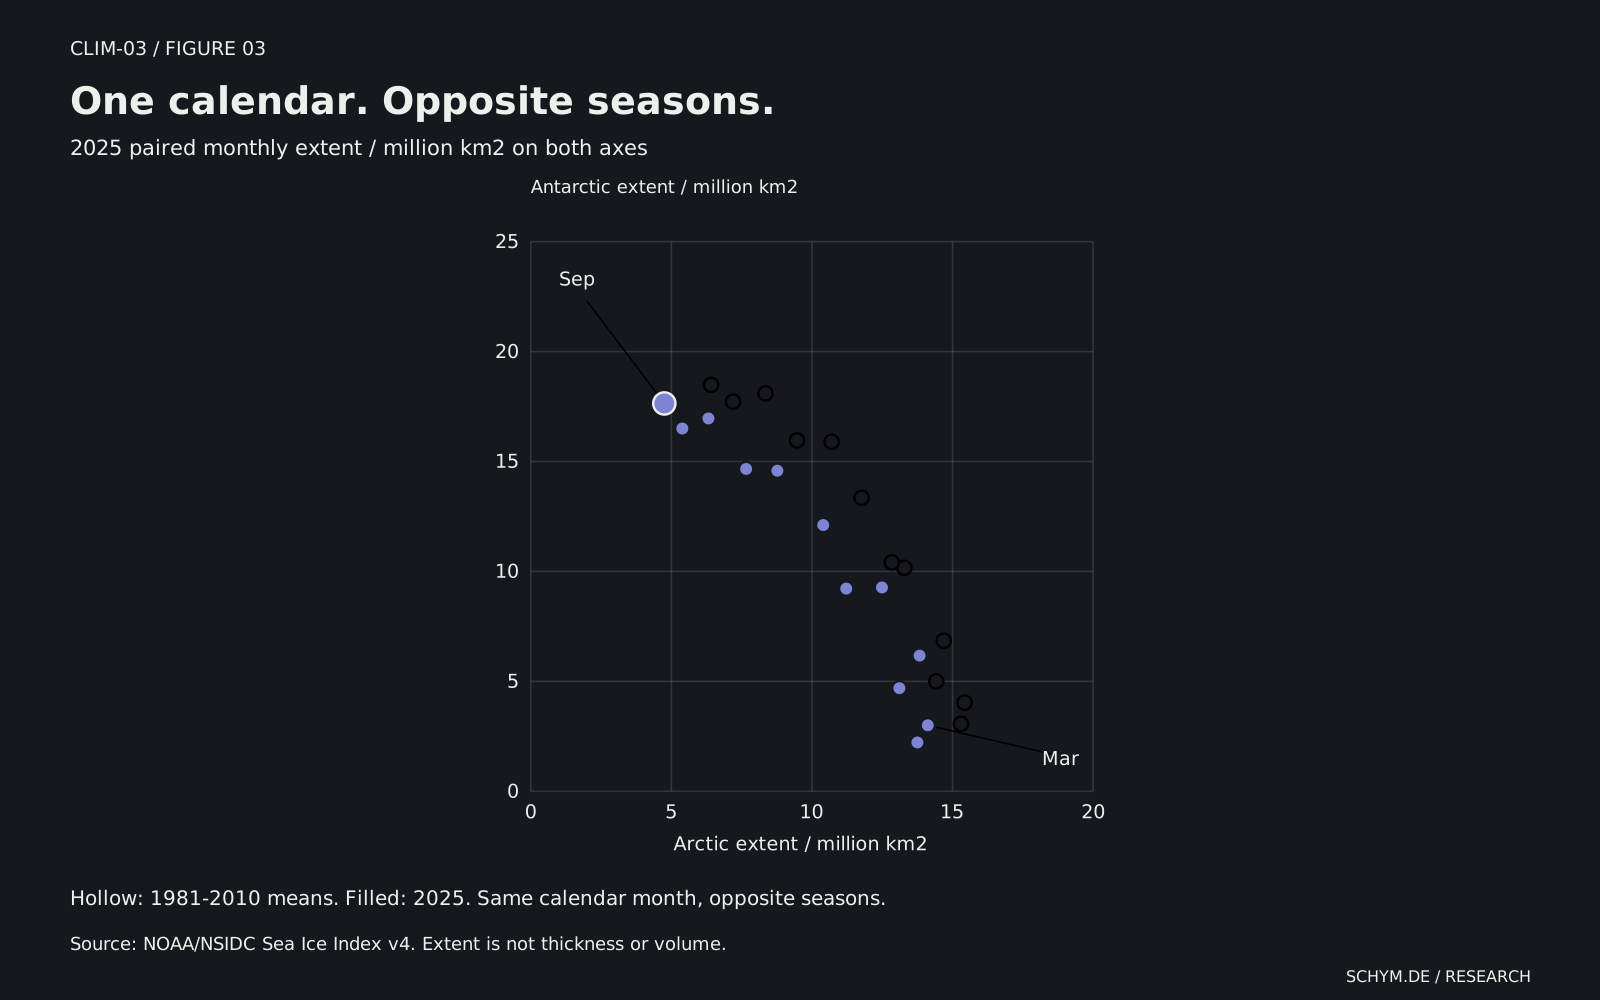
The two-dimensional view puts each month's Arctic extent on one axis and its Antarctic extent on the other. One point therefore carries two measurements, not a global total. Hollow points mark the two reference means; filled points show one selected year.
Figure 03 / Seasonal positions
One calendar. Opposite seasons.
Paired monthly extents / million km2 / 2025
Antarctic extent
Arctic: 4.750 million km2; deviation −1.663 million km2 / −25.94% from its own 1981-2010 monthly mean. Antarctic: 17.640 million km2; deviation −0.847 million km2 / −4.58% from its own 1981-2010 monthly mean. Hollow reference pair: Arctic 6.413, Antarctic 18.487 million km2. Reference positions are not substitute observations.
Preview. Click, tap, or press Enter to pin.Source: NOAA/NSIDC Sea Ice Index v4. Each point pairs the same calendar month, not the same physical season. There is no fitted relationship or interpolation through missing months.
Exact values
| Month | Arctic | Antarctic | Arctic reference | Antarctic reference |
|---|---|---|---|---|
| January | 13.11 | 4.69 | 14.420 | 5.001 |
| February | 13.75 | 2.22 | 15.300 | 3.067 |
| March | 14.12 | 3.00 | 15.428 | 4.030 |
| April | 13.83 | 6.17 | 14.689 | 6.848 |
| May | 12.49 | 9.27 | 13.286 | 10.164 |
| June | 10.40 | 12.11 | 11.765 | 13.351 |
| July | 7.66 | 14.66 | 9.469 | 15.960 |
| August | 5.39 | 16.50 | 7.196 | 17.723 |
| September | 4.75 | 17.64 | 6.413 | 18.487 |
| October | 6.32 | 16.96 | 8.348 | 18.097 |
| November | 8.77 | 14.58 | 10.700 | 15.896 |
| December | 11.22 | 9.22 | 12.840 | 10.411 |
The separation between March and September makes the opposing seasons visible. The distance from a reference point shows a pair of departures, not a causal relationship. There is no fitted line, correlation claim or implied journey through an unobserved month. When either measurement is unavailable, its pair is absent and the table says so.
The measurement boundary
Extent is a boundary, not an inventory.
Sea-ice extent counts the ocean area in grid cells with at least 15% ice concentration. It does not say that the whole counted area is solid ice. Ice area, thickness and volume answer different questions. Floating sea ice is also a different measurement problem from ice sheets on land. These observations cannot be used to calculate a contribution to sea level.
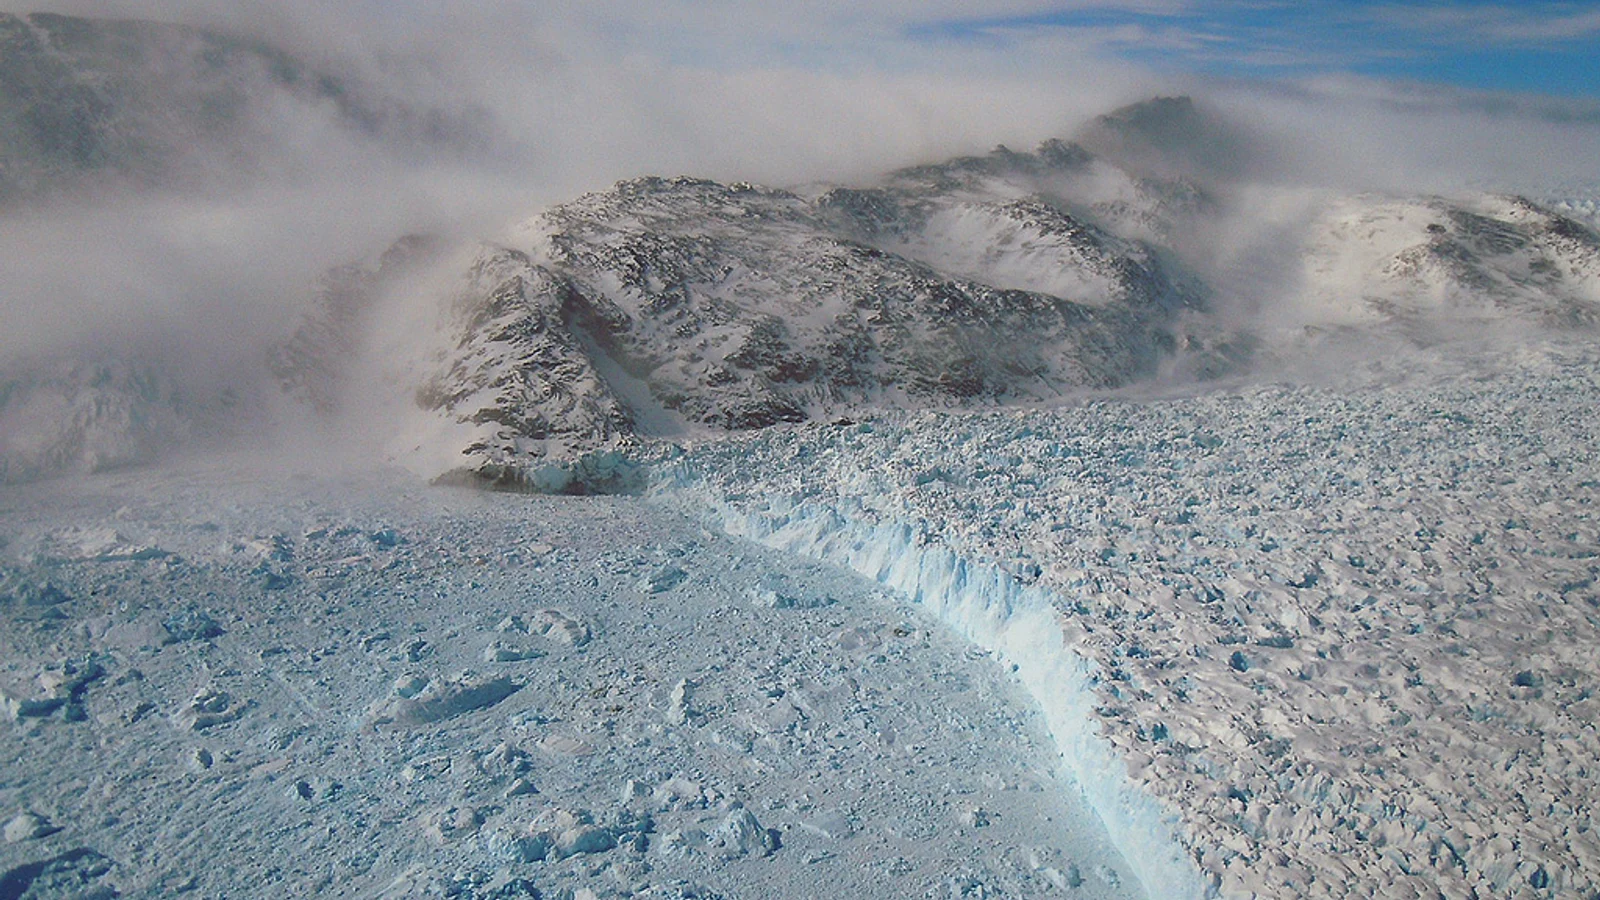
NASA/GSFC/Michael Studinger. The calving front of Gyldenlove Glacier in southeast Greenland, photographed during Operation IceBridge in 2011. This is a calving glacier: land-origin ice, not the sea-ice extent measured in the figures.
04 / From the record to the explanation
Different ice histories need different explanations.
The satellite record establishes a comparison, not a complete causal account. The next six notes connect its patterns to measurement, energy exchange and the wider literature. They separate physical mechanisms, scientific assessments and recent interpretations instead of presenting them as results newly estimated from these charts.
01Measurement definition
An extent threshold is not an ice inventory.
At least 15% ice concentration; extent and area in square kilometers
Passive microwave instruments can observe through clouds and polar darkness. An extent cell counts in full once estimated ice concentration reaches 15%; open water can remain inside that boundary. An area calculation instead weights qualifying cells by their ice concentration. Neither measure tells us how thick the ice is.
What this does not establish. A cell leaving the counted extent does not mean its entire surface was previously solid ice. The source describes retrieval limits, not observation-specific confidence intervals; no new error band is assigned to the frozen CSV values.
Method and interpretation
NSIDC's operational explanation distinguishes thresholded extent from concentration-weighted area. Melt ponds, cracks and the coarse spatial resolution can complicate microwave retrievals. A long, consistently defined footprint remains useful without being a complete inventory of ice.
02Physical distinction
Sea ice and land ice enter different accounts.
Floating sea-ice coverage versus land-ice mass loss and ocean expansion
Sea ice forms when seawater freezes; an ice sheet stores ice on land. That distinction matters when the question changes from ocean coverage to sea level. Water added by shrinking land ice and the expansion of warming seawater enter the sea-level account, whereas these charts measure a floating ice footprint.
What this does not establish. The September extent differences cannot be converted into millimeters of sea-level rise. That measurement boundary does not mean changes in sea ice have no climatic or ecological consequences.
Method and interpretation
The NSIDC definition establishes what sea ice is. IPCC AR6 identifies ocean thermal expansion and land-ice loss as drivers of global mean sea-level rise, with high confidence in the assessed historical contribution account. This article does not reproduce that mass-and-volume assessment.
03Mechanisms and assessed response
Geography changes the energy exchange.
Polar geography, reflectivity and ocean heat storage; no new attribution
Arctic ice is partly confined by surrounding land, while Antarctic ice can drift outward into warmer water. Open water absorbs more sunlight than ice, the ocean stores and transports heat, and winter ice limits heat loss to the atmosphere. These mechanisms help explain unequal responses without making Antarctica a control experiment.
What this does not establish. The amplification statement concerns continued warming, not a historical 1979-2025 ratio calculated here. Its denominator is global surface-temperature warming, not Antarctic warming or sea-ice loss. Albedo alone does not apportion the causes of the displayed extent changes.
Method and interpretation
The ice-albedo feedback concerns reflected sunlight; insulation concerns exchanges between ocean and atmosphere. Ocean storage helps separate an energy gain from immediate surface warming. AR6 assesses continued Arctic warming above the global rate as virtually certain, with high confidence in amplification above twice the global rate.
04Assessed observational relationship
The carbon link comes from a wider body of evidence.
Arctic sea-ice area, 1979-2019; cumulative anthropogenic CO2
AR6 assessed with high confidence that the satellite-observed decline in Arctic sea-ice area is well described as a linear function of global warming and consequently cumulative human CO2 emissions, with internal variability superimposed. Notz and Stroeve's earlier study addressed the September-mean area relationship. Neither result is a regression fitted by this page.
What this does not establish. A high-confidence aggregate relationship does not make an individual September a deterministic readout of that year's emissions. The numerical per-tonne coefficient and its uncertain convention are not imported from the abstract.
Method and interpretation
Chapter 9 brings observations, physical understanding and model comparison together; Figure 9.14 distinguishes observed and simulated behavior. The relevant carbon measure is cumulative CO2 emissions, not an individual year's emissions, and the ice variable is area rather than the extent used in the three figures above.
05Published future assessment
Practically ice-free still has a precise definition.
September-mean Arctic sea-ice area below one million square kilometers
Practically ice-free does not mean that the Arctic loses every piece of ice. In AR6 Chapter 9, it means September-mean sea-ice area below one million square kilometers. The report judged a first occurrence before 2050 likely across the SSP scenarios it considered.
What this does not establish. This is an area threshold, not a threshold applied to the extent data above. It does not mean an ice-free winter or permanent absence of ice after the first occurrence. Future frequency is not independent of emissions.
Method and interpretation
This is the published model-informed assessment in Chapter 9, not an extrapolation of the two decades compared on this page. The threshold, season and likelihood qualifier belong together. A first occurrence is different from its subsequent frequency.
06Peer-reviewed interpretation
Antarctica's recent lows raise a new question.
Evidence reported through 2023; primary abstract verified
Purich and Doddridge examined exceptionally low Antarctic ice coverage in 2023 alongside warmer subsurface Southern Ocean conditions. They described three record-breaking low summers within seven years and unusually low coverage during the subsequent autumn and winter advance, suggesting a different low-extent state.
What this does not establish. The interpretation is not an established diagnosis of a permanent regime shift. Association alone does not identify all causes, and this article's fixed-decade comparison cannot decide the regime question. Earlier assessments with an observation window ending in 2020 are not silently extended to 2025.
Method and interpretation
The verified abstract connects recent ice coverage with subsurface ocean warmth and proposes altered seasonal persistence. This is an observational analysis and mechanism hypothesis. The present source review does not import unverified details of depths, reference climatologies, statistical tests or individual figures.
What follows
The comparison survives. The shortcut does not.
The recent fixed decade is lower than the earlier one in both hemispheres, but the magnitude and timing are not interchangeable. That is stronger than selecting one low season and narrower than declaring a new Antarctic regime. The Arctic result does not require Antarctica to follow the same annual path.
A global aggregate may be useful for some questions. It cannot tell the reader which season changed, which region accounts for the difference, or whether the apparent stability of the sum hides different local histories. The two poles belong in the same comparison, with their differences intact.
The scientific context makes that comparison more useful, not more universal. Extent is not volume; sea ice is not an ice sheet; a published ice-free threshold is not a line we can apply to a different variable. A reader judging a polar headline should ask which ice, which season, which reference period and which method supports the inference. Keeping those four questions visible is more informative than a contest over which pole supplies the more dramatic picture.
The audit
Sources, definitions and gaps
The source is NOAA/NSIDC Sea Ice Index version 4 (G02135), frozen on September 11, 2026. Twenty-four monthly CSVs cover the two hemispheres. The public comparison uses 1979-2025: 1,128 explicit hemisphere-month-year records, including four missing extent observations. Partial 1978 and 2026 observations remain in the immutable source files but are excluded from the displayed window.
The CSV's extent column is used, not its area column. NSIDC's monthly values are averages of hemisphere-wide daily extents; these are not the same calculation as the extent boundaries in monthly-mean concentration maps. We do not reconstruct either product from imagery. The published values are rounded to 0.01 million km2. Derived means use those available rounded values, so additional decimal places in downloads do not imply additional measurement accuracy.
December 1987 and January 1988 are missing in both hemispheres. The 1981-2010 reference therefore uses 29 observations for each of those months and 30 for the others. Arctic August 1987 has valid extent but missing area; its extent is retained. No missing extent is replaced with zero or interpolated. The two fixed comparison decades are complete for every month and hemisphere.
The source_dataset field is retained, including the quoted combined identifier NSIDC-0051,NSIDC-0081 and the official transition to NSIDC-0803. These are components of the publisher's version-4 product, not independently selected vintages. Source-product metadata is not a numerical quality score. The source guide discusses sensor, pole-hole and retrieval limitations; the CSV does not supply observation-specific confidence intervals.
All results here are descriptive. No breakpoint, trend significance, causal attribution, future projection or uncertainty interval is fitted. The exact input hashes, source URLs, observation keys and generation commands accompany the data.
The six scientific-context notes were reviewed on September 17, 2026 and are frozen separately from the observational data. They use original explanatory prose with primary-source or official-assessment citations. They do not add new rows to the Sea Ice Index, calculate an attribution fraction or fit a forecast. The area-based carbon relationship and practically ice-free threshold are not applied to the extent series.
NSIDC explanations and the relevant AR6 passages were reviewed for their definitions and scope. The Notz-Stroeve and Purich-Doddridge references are limited to verified primary abstracts; their full methods were not independently replicated. No unverified per-tonne coefficient, historical amplification ratio, Antarctic depth range, statistical significance or permanent regime claim is imported. Model-informed assessments retain their original likelihood language and time windows.
- NOAA/NSIDC Sea Ice Index, Version 4
G02135; DOI 10.7265/A98X-0F50. Monthly north/south extent CSVs, 1979-2025 display subset; retrieved September 11, 2026. Data reused with NSIDC attribution.
- Sea Ice Index v4 User Guide
Monthly CSV definitions and calculation in section 3.1.6; missing observations, retrieval and source-product transitions retained as limitations.
- IPCC AR6 Synthesis Report
Assessment context, SPM A.2 and B.1. These charts do not reproduce an attribution assessment or identify a new climate regime.
- NSIDC: Sea ice area and extent
Thresholded extent, concentration-weighted area and passive-microwave retrieval limits.
- NSIDC: Sea Ice
Sea-ice definition and geographical differences between the poles.
- NSIDC: Science of Sea Ice
Sunlight reflection and ice-albedo feedback; no local attribution fraction is calculated.
- NSIDC: Why Sea Ice Matters
Ocean-atmosphere insulation and other climatic consequences of sea ice.
- IPCC AR6 WGI: Summary for Policymakers
A.4.3 on sea-level processes and B.2.1 on projected Arctic amplification. Preserve the assessment periods and confidence language.
- IPCC AR6 WGI Chapter 9: Ocean, Cryosphere and Sea Level Change
Executive Summary, footnote 1, sections 9.2.2.1 and 9.3.1.1, Figure 9.14. Ocean heat storage, observed Arctic sea-ice area and cumulative emissions, and the practically ice-free September assessment.
- Notz and Stroeve (2016): Arctic sea-ice loss and anthropogenic CO2
Primary abstract verified via PMID 27811286; September-mean area relationship. No unverified coefficient, uncertainty convention or extrapolation is imported.
- Purich and Doddridge (2023): Record low Antarctic sea ice coverage
Publisher-deposited abstract verified. A low-extent-state interpretation involving subsurface warmth, not an established permanent regime diagnosis. Full methods and figure-specific quantities were not independently reviewed for this extension.