CLIM-01 / SPM.A.1 / Observations and attribution
What does a cooler year say about warming?
2025 was cooler than 2024. The latest complete decade was substantially warmer than the one before it. A frozen global temperature record shows why both statements can be true.
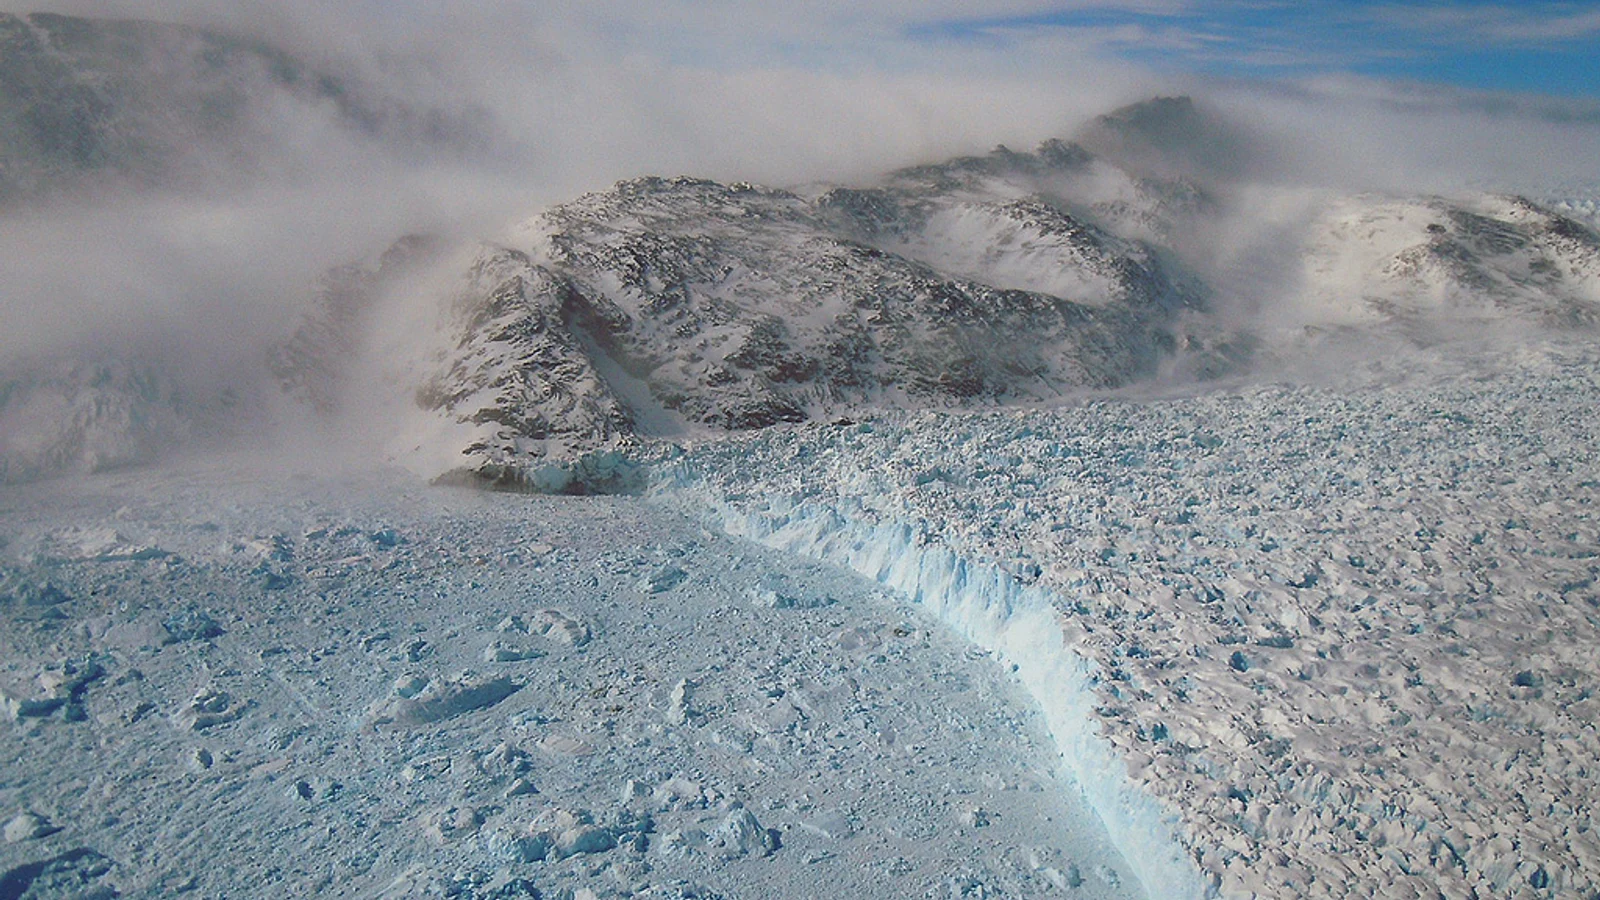
NASA/GSFC/Michael Studinger. The calving front of Gyldenlove Glacier in southeast Greenland, photographed during Operation IceBridge in 2011. Contextual image; not used to estimate a trend. Image credits.
- 2025 minus 2024
- −0.12°C
- 2016-2025 minus 2006-2015
- +0.32°C
- Reference baseline
- 1850–1900
- Evidence vintage
- IGCC 2025 / June 2026
Michael Schymura / September 8, 2026 / Updated September 16, 2026
The decade is warmer even when the year cools.
The global mean surface temperature estimate fell by 0.12 degrees Celsius between 2024 and 2025 in the Indicators of Global Climate Change 2025 dataset. That is a real annual decrease in this observational product. Yet the average for 2016-2025 was 1.256 degrees above 1850-1900, compared with 0.9338 degrees for 2006-2015: an increase of 0.3222 degrees between two complete, non-overlapping decades.
The apparent contradiction disappears once the unit of comparison is explicit. One statistic compares two annual observations. The other compares two groups of ten years. Neither should be renamed to make an argument easier, and neither is, by itself, a new estimate of human influence. The question is what each measure can establish.
01 / The annual observation
Keep the year. Change the window.
A global annual temperature estimate combines a long-run change in the climate system with natural forcing, internal variability, and observational uncertainty. A relatively cool year can occur within a warmer sequence, just as an unusually warm year can sit above it. The 2026 indicator assessment discusses the influence of internal ocean variability and natural drivers alongside human-caused warming.
The year fluctuates; the longer record accumulates
°C relative to 1850-1900. Annual observational estimates, 1850-2025; means include the selected end year.
Annual estimate +1.391°C; 10-year mean +1.256°C. Relative to 1850-1900. A descriptive mean is not an attribution estimate.
Preview. Click, tap, or press Enter to pin.Source: IGCC 2025 / Forster et al. (2026), release v2026.06.02; retrieved September 8, 2026. No rebasing. Descriptive means are not attribution estimates or a test of a sustained warming threshold.
Exact values
| Year | Annual °C | 10-year mean °C |
|---|---|---|
| 2025 | 1.391 | 1.256 |
| 2024 | 1.511 | 1.231 |
| 2023 | 1.439 | 1.180 |
| 2022 | 1.139 | 1.129 |
| 2021 | 1.096 | 1.105 |
| 2020 | 1.249 | 1.082 |
| 2019 | 1.214 | 1.056 |
| 2018 | 1.094 | 1.026 |
| 2017 | 1.166 | 0.995 |
| 2016 | 1.261 | 0.970 |
| 2015 | 1.144 | 0.934 |
| 2014 | 0.994 | 0.914 |
| 2013 | 0.929 | 0.895 |
| 2012 | 0.899 | 0.889 |
| 2011 | 0.866 | 0.887 |
| 2010 | 0.989 | 0.881 |
| 2009 | 0.919 | 0.847 |
| 2008 | 0.786 | 0.820 |
| 2007 | 0.911 | 0.831 |
| 2006 | 0.901 | 0.815 |
| 2005 | 0.946 | 0.785 |
| 2004 | 0.799 | 0.763 |
| 2003 | 0.871 | 0.740 |
| 2002 | 0.879 | 0.703 |
| 2001 | 0.804 | 0.662 |
| 2000 | 0.654 | 0.648 |
| 1999 | 0.651 | 0.652 |
| 1998 | 0.894 | 0.637 |
| 1997 | 0.749 | 0.609 |
| 1996 | 0.604 | 0.591 |
| 1995 | 0.721 | 0.575 |
| 1994 | 0.569 | 0.541 |
| 1993 | 0.509 | 0.524 |
| 1992 | 0.466 | 0.529 |
| 1991 | 0.666 | 0.521 |
| 1990 | 0.689 | 0.513 |
| 1989 | 0.501 | 0.497 |
| 1988 | 0.619 | 0.489 |
| 1987 | 0.569 | 0.461 |
| 1986 | 0.444 | 0.449 |
| 1985 | 0.381 | 0.419 |
| 1984 | 0.394 | 0.404 |
| 1983 | 0.564 | 0.381 |
| 1982 | 0.381 | 0.365 |
| 1981 | 0.584 | 0.353 |
| 1980 | 0.536 | 0.309 |
| 1979 | 0.421 | 0.282 |
| 1978 | 0.336 | 0.271 |
| 1977 | 0.449 | 0.254 |
| 1976 | 0.141 | 0.231 |
| 1975 | 0.229 | 0.237 |
| 1974 | 0.169 | 0.228 |
| 1973 | 0.399 | 0.215 |
| 1972 | 0.261 | 0.205 |
| 1971 | 0.149 | 0.205 |
| 1970 | 0.264 | 0.222 |
| 1969 | 0.309 | 0.218 |
| 1968 | 0.169 | 0.216 |
| 1967 | 0.224 | 0.230 |
| 1966 | 0.194 | 0.237 |
| 1965 | 0.141 | 0.224 |
| 1964 | 0.039 | 0.222 |
| 1963 | 0.299 | 0.236 |
| 1962 | 0.266 | 0.245 |
| 1961 | 0.311 | 0.251 |
| 1960 | 0.226 | 0.243 |
| 1959 | 0.289 | 0.229 |
| 1958 | 0.309 | 0.216 |
| 1957 | 0.294 | 0.203 |
| 1956 | 0.066 | 0.197 |
| 1955 | 0.124 | 0.210 |
| 1954 | 0.181 | 0.232 |
| 1953 | 0.386 | 0.260 |
| 1952 | 0.319 | 0.255 |
| 1951 | 0.231 | 0.253 |
| 1950 | 0.086 | 0.265 |
| 1949 | 0.161 | 0.296 |
| 1948 | 0.179 | 0.308 |
| 1947 | 0.241 | 0.319 |
| 1946 | 0.191 | 0.325 |
| 1945 | 0.346 | 0.321 |
| 1944 | 0.464 | 0.298 |
| 1943 | 0.336 | 0.266 |
| 1942 | 0.299 | 0.232 |
| 1941 | 0.351 | 0.218 |
| 1940 | 0.391 | 0.202 |
| 1939 | 0.284 | 0.178 |
| 1938 | 0.291 | 0.143 |
| 1937 | 0.301 | 0.123 |
| 1936 | 0.151 | 0.101 |
| 1935 | 0.111 | 0.104 |
| 1934 | 0.146 | 0.099 |
| 1933 | -0.001 | 0.086 |
| 1932 | 0.151 | 0.087 |
| 1931 | 0.199 | 0.071 |
| 1930 | 0.151 | 0.059 |
| 1929 | -0.071 | 0.047 |
| 1928 | 0.089 | 0.054 |
| 1927 | 0.084 | 0.037 |
| 1926 | 0.186 | 0.008 |
| 1925 | 0.054 | -0.019 |
| 1924 | 0.014 | -0.012 |
| 1923 | 0.014 | -0.006 |
| 1922 | -0.009 | -0.019 |
| 1921 | 0.076 | -0.031 |
| 1920 | 0.036 | -0.059 |
| 1919 | -0.001 | -0.081 |
| 1918 | -0.081 | -0.103 |
| 1917 | -0.209 | -0.114 |
| 1916 | -0.089 | -0.109 |
| 1915 | 0.131 | -0.097 |
| 1914 | 0.076 | -0.118 |
| 1913 | -0.119 | -0.150 |
| 1912 | -0.129 | -0.158 |
| 1911 | -0.206 | -0.151 |
| 1910 | -0.186 | -0.124 |
| 1909 | -0.219 | -0.093 |
| 1908 | -0.191 | -0.068 |
| 1907 | -0.154 | -0.060 |
| 1906 | 0.026 | -0.035 |
| 1905 | -0.074 | -0.029 |
| 1904 | -0.251 | -0.028 |
| 1903 | -0.191 | -0.016 |
| 1902 | -0.069 | -0.011 |
| 1901 | 0.071 | -0.017 |
| 1900 | 0.121 | -0.028 |
| 1899 | 0.029 | -0.056 |
| 1898 | -0.106 | -0.046 |
| 1897 | 0.094 | -0.035 |
| 1896 | 0.084 | -0.060 |
| 1895 | -0.059 | -0.079 |
| 1894 | -0.136 | -0.084 |
| 1893 | -0.134 | -0.082 |
| 1892 | -0.131 | -0.067 |
| 1891 | -0.044 | -0.048 |
| 1890 | -0.154 | -0.030 |
| 1889 | 0.124 | -0.010 |
| 1888 | 0.006 | -0.014 |
| 1887 | -0.159 | 0.021 |
| 1886 | -0.101 | 0.068 |
| 1885 | -0.109 | 0.074 |
| 1884 | -0.116 | 0.084 |
| 1883 | 0.016 | 0.090 |
| 1882 | 0.061 | 0.090 |
| 1881 | 0.134 | 0.087 |
| 1880 | 0.039 | 0.074 |
| 1879 | 0.084 | 0.072 |
| 1878 | 0.364 | 0.071 |
| 1877 | 0.306 | 0.040 |
| 1876 | -0.041 | 0.008 |
| 1875 | -0.006 | 0.014 |
| 1874 | -0.056 | 0.018 |
| 1873 | 0.016 | 0.016 |
| 1872 | 0.034 | 0.011 |
| 1871 | -0.004 | -0.011 |
| 1870 | 0.026 | -0.022 |
| 1869 | 0.066 | -0.031 |
| 1868 | 0.059 | -0.033 |
| 1867 | -0.011 | -0.043 |
| 1866 | 0.014 | -0.054 |
| 1865 | 0.034 | -0.057 |
| 1864 | -0.074 | -0.053 |
| 1863 | -0.039 | -0.041 |
| 1862 | -0.184 | -0.031 |
| 1861 | -0.116 | -0.003 |
| 1860 | -0.059 | 0.013 |
| 1859 | 0.051 | 0.014 |
| 1858 | -0.049 | Unavailable |
| 1857 | -0.114 | Unavailable |
| 1856 | -0.021 | Unavailable |
| 1855 | 0.076 | Unavailable |
| 1854 | 0.049 | Unavailable |
| 1853 | 0.054 | Unavailable |
| 1852 | 0.099 | Unavailable |
| 1851 | 0.041 | Unavailable |
| 1850 | -0.046 | Unavailable |
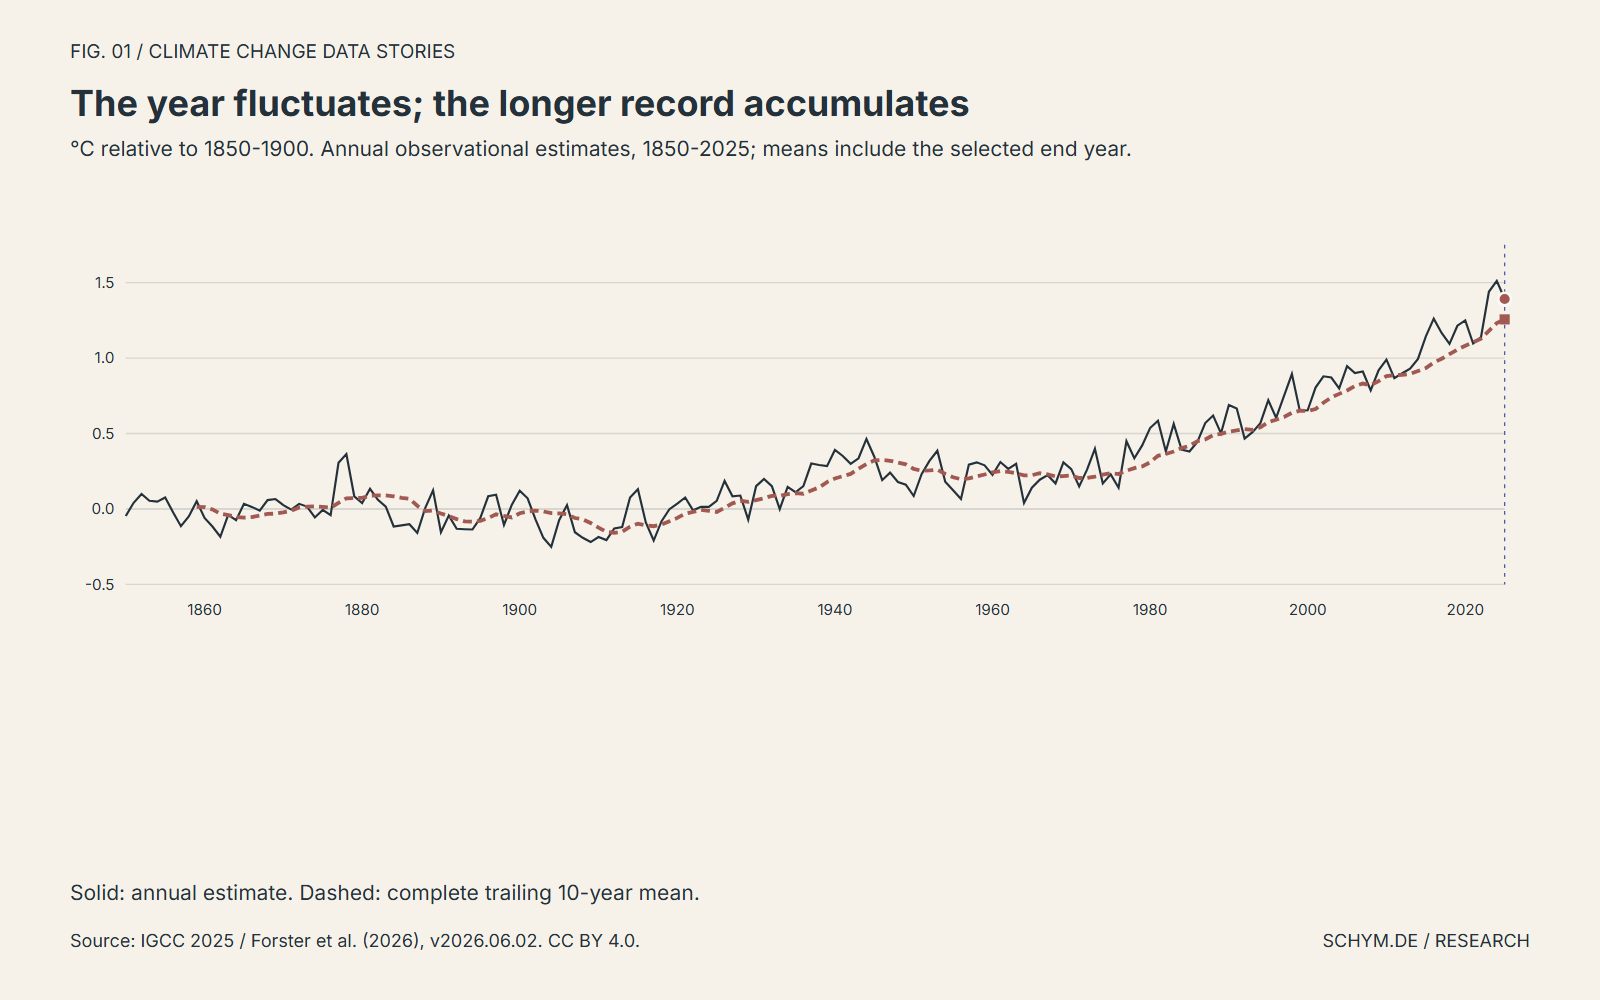
Selected evidence: 2025, 10-year window. Annual +1.391°C; mean +1.256°C.
The comparison below carries one year through different averaging windows. The default keeps 2025 fixed and compares its annual estimate, 1.391 degrees, with the ten-year mean ending in that year, 1.256 degrees. The averaging window includes its end year. A twenty- or thirty-year mean looks farther back and therefore answers a different question about the same record. It does not produce an alternative causal model.
Longer trailing means can lag a changing climate, because older observations retain weight. They reduce the prominence of an individual year but do not remove every source of variability. These windows are descriptive tools, not interchangeable definitions of the present warming level. The series and every comparison retain the original 1850-1900 baseline.
02 / The distribution
The shift is larger than one exceptional year.
An average can hide how its observations are distributed. The second view therefore keeps each annual estimate visible within a complete calendar decade. Ten points mean ten years, not ten independent experiments or ten climate models. The short mark identifies their arithmetic mean; it is not an uncertainty interval.
Whole groups of years move toward warmer conditions
°C relative to 1850-1900. Complete calendar decades, 1850-2019; ten observed years per row.
+1.391°C relative to 1850-1900. Outside the complete calendar decades shown.
Preview. Click, tap, or press Enter to pin.Source: IGCC 2025 / Forster et al. (2026), release v2026.06.02; retrieved September 8, 2026. Dots are observed years; vertical ticks are means, not intervals. The incomplete 2020s are excluded.
Exact values
| Period | Years | Mean °C | Min | Max |
|---|---|---|---|---|
| 1850-1859 | 10 | 0.014 | -0.114 | 0.099 |
| 1860-1869 | 10 | -0.031 | -0.184 | 0.066 |
| 1870-1879 | 10 | 0.072 | -0.056 | 0.364 |
| 1880-1889 | 10 | -0.011 | -0.159 | 0.134 |
| 1890-1899 | 10 | -0.056 | -0.154 | 0.094 |
| 1900-1909 | 10 | -0.093 | -0.251 | 0.121 |
| 1910-1919 | 10 | -0.081 | -0.209 | 0.131 |
| 1920-1929 | 10 | 0.047 | -0.071 | 0.186 |
| 1930-1939 | 10 | 0.178 | -0.001 | 0.301 |
| 1940-1949 | 10 | 0.296 | 0.161 | 0.464 |
| 1950-1959 | 10 | 0.229 | 0.066 | 0.386 |
| 1960-1969 | 10 | 0.218 | 0.039 | 0.311 |
| 1970-1979 | 10 | 0.282 | 0.141 | 0.449 |
| 1980-1989 | 10 | 0.497 | 0.381 | 0.619 |
| 1990-1999 | 10 | 0.652 | 0.466 | 0.894 |
| 2000-2009 | 10 | 0.847 | 0.654 | 0.946 |
| 2010-2019 | 10 | 1.056 | 0.866 | 1.261 |
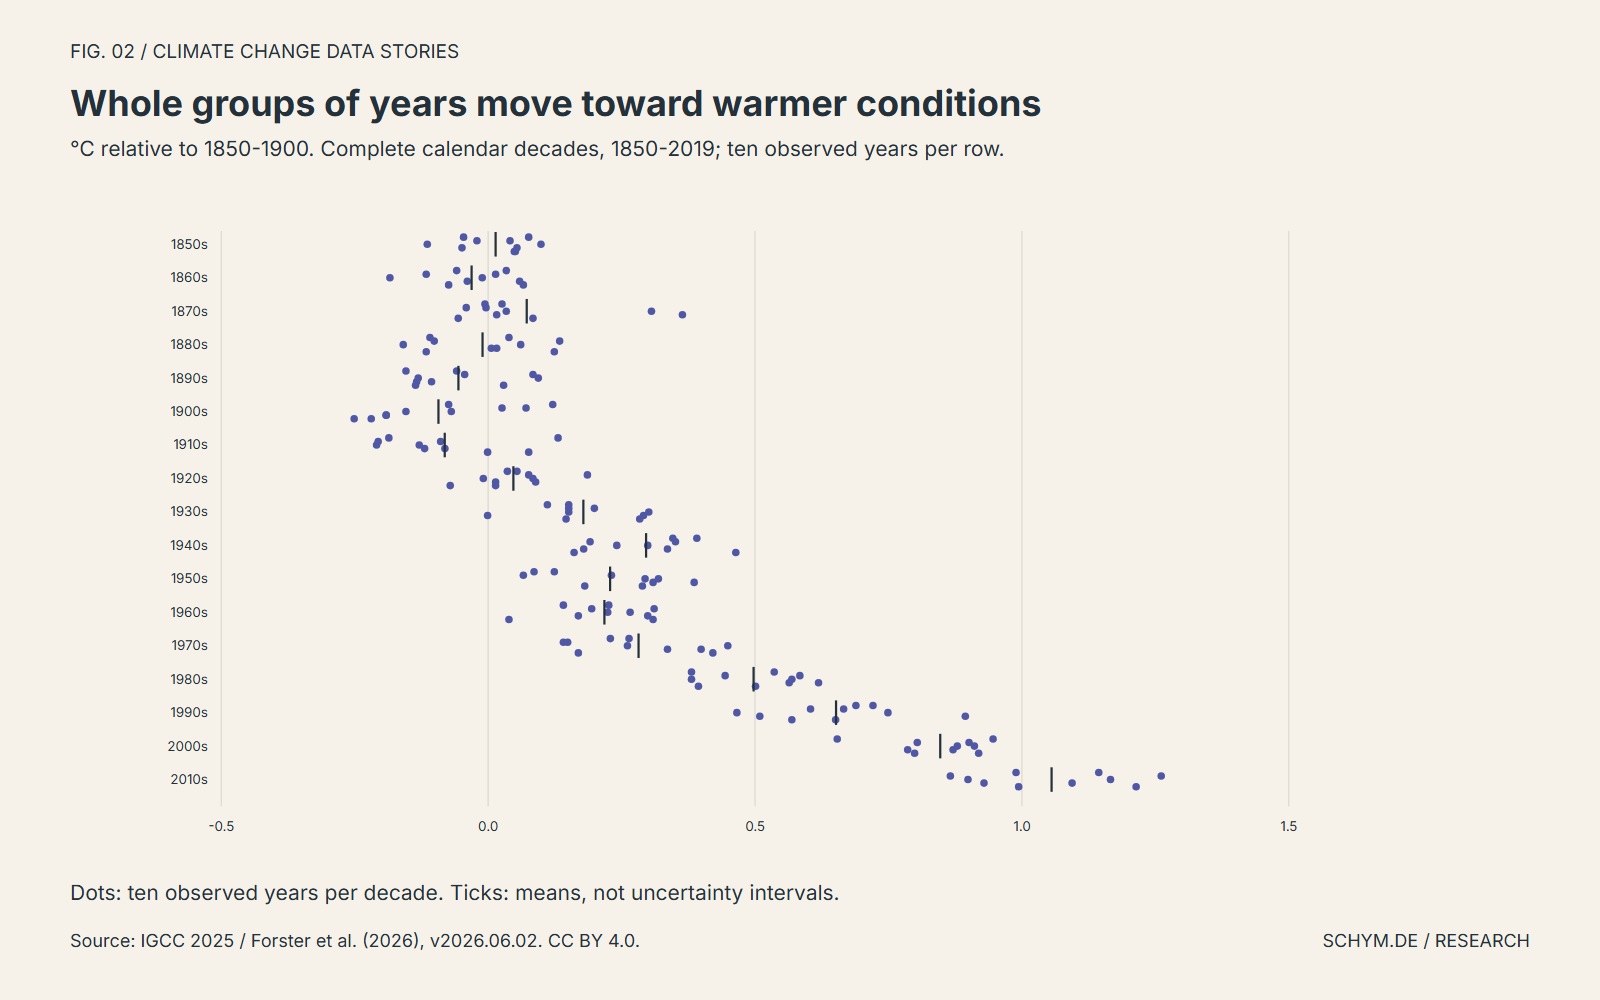
The groups move toward warmer conditions across the later part of the record, while variation remains within each decade. The question is not only which year holds a record, but where ordinary years lie relative to earlier groups. This is why selecting the two most recent observations can be an inadequate description of a longer change.
Calendar decades here run from 1850-1859 through 2010-2019. The incomplete 2020-2029 group is excluded rather than compared as though it contained ten observations. The headline comparison uses the complete rolling decades 2006-2015 and 2016-2025 instead. Those two windows do not overlap. The distinction between the figure's calendar groups and the headline's complete recent windows is deliberate.
03 / The counter-evidence
Annual decreases do not disappear from a warming record.
The strongest version of the annual-cooling claim starts with a correct observation: the latest annual estimate fell. The error would be to treat the sign of that one change as the sign of the underlying long-run process. A first-difference view makes the test explicit.
A cooling year is part of the record
Annual change in °C, 1970-2025; zero means unchanged from the preceding year.
−0.120°C. Negative means cooler than the preceding year, not cooler than the pre-industrial baseline.
Preview. Click, tap, or press Enter to pin.Source: IGCC 2025 / Forster et al. (2026), release v2026.06.02; retrieved September 8, 2026. Negative changes do not mean temperatures below the pre-industrial baseline. This count is not a probability forecast.
Exact values
| Year | Annual change °C |
|---|---|
| 1970 | -0.045 |
| 1971 | -0.115 |
| 1972 | 0.112 |
| 1973 | 0.138 |
| 1974 | -0.230 |
| 1975 | 0.060 |
| 1976 | -0.088 |
| 1977 | 0.308 |
| 1978 | -0.113 |
| 1979 | 0.085 |
| 1980 | 0.115 |
| 1981 | 0.048 |
| 1982 | -0.203 |
| 1983 | 0.183 |
| 1984 | -0.170 |
| 1985 | -0.013 |
| 1986 | 0.063 |
| 1987 | 0.125 |
| 1988 | 0.050 |
| 1989 | -0.118 |
| 1990 | 0.188 |
| 1991 | -0.023 |
| 1992 | -0.200 |
| 1993 | 0.043 |
| 1994 | 0.060 |
| 1995 | 0.152 |
| 1996 | -0.117 |
| 1997 | 0.145 |
| 1998 | 0.145 |
| 1999 | -0.243 |
| 2000 | 0.003 |
| 2001 | 0.150 |
| 2002 | 0.075 |
| 2003 | -0.008 |
| 2004 | -0.072 |
| 2005 | 0.147 |
| 2006 | -0.045 |
| 2007 | 0.010 |
| 2008 | -0.125 |
| 2009 | 0.133 |
| 2010 | 0.070 |
| 2011 | -0.123 |
| 2012 | 0.033 |
| 2013 | 0.030 |
| 2014 | 0.065 |
| 2015 | 0.150 |
| 2016 | 0.117 |
| 2017 | -0.095 |
| 2018 | -0.072 |
| 2019 | 0.120 |
| 2020 | 0.035 |
| 2021 | -0.153 |
| 2022 | 0.043 |
| 2023 | 0.300 |
| 2024 | 0.072 |
| 2025 | -0.120 |
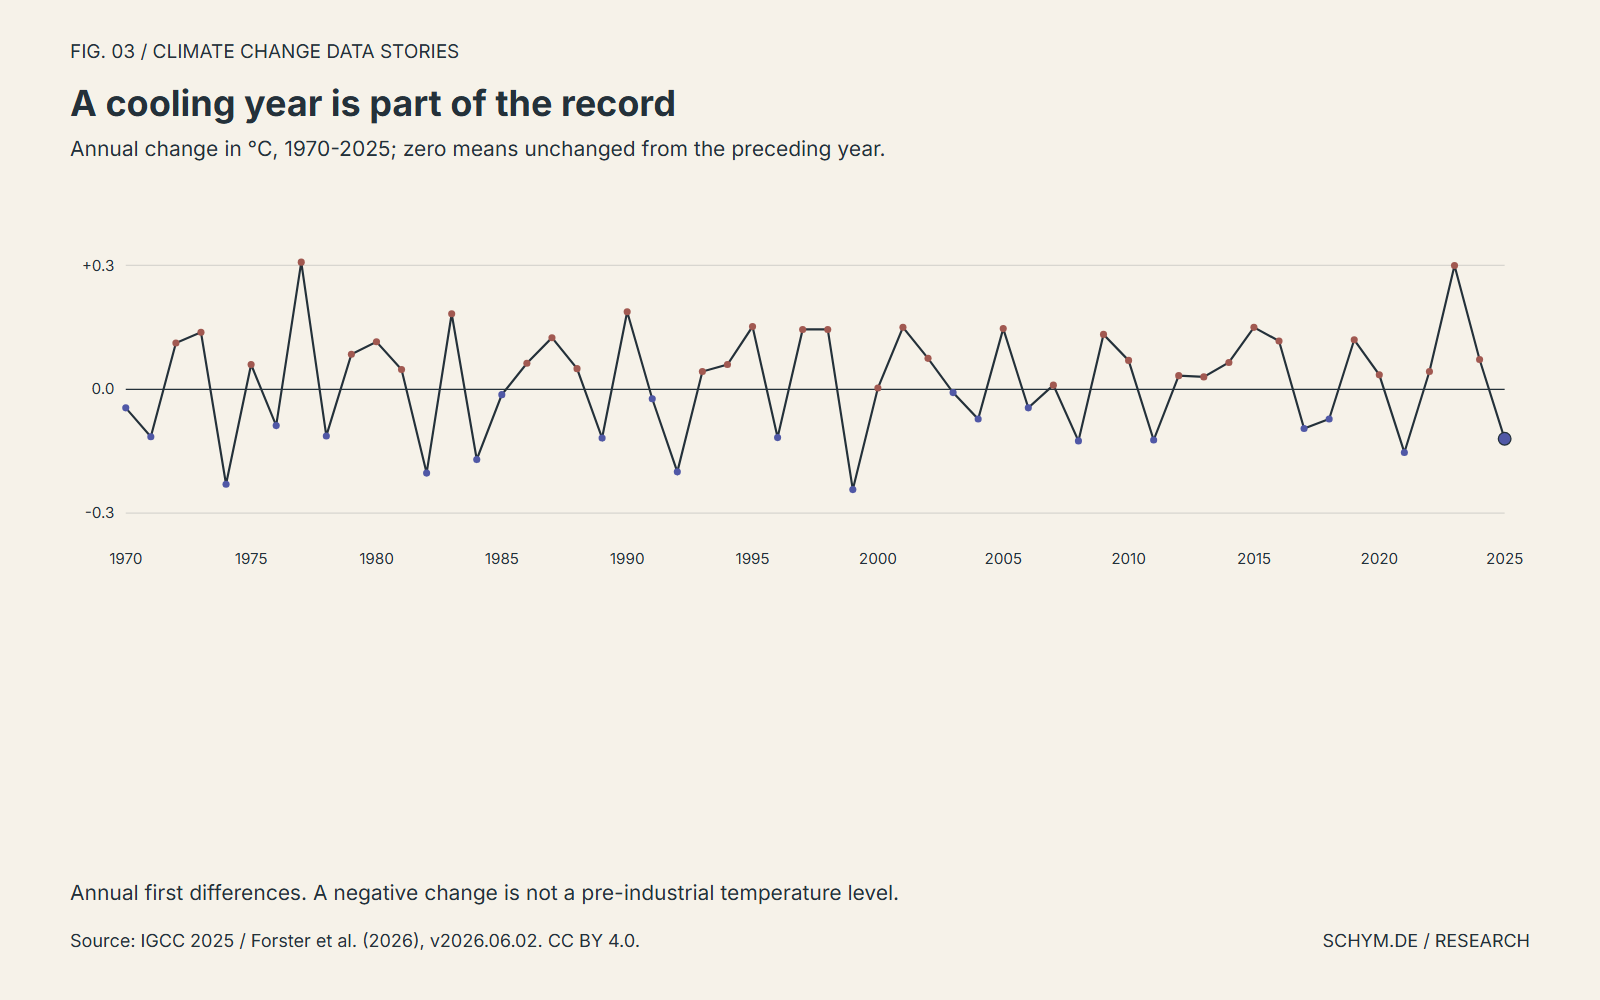
From 1970 through 2025, 22 of the 56 annual changes in this frozen series were negative. The 1970 change uses 1969 as its comparison. Each value measures the difference from the immediately preceding year; it is not the anomaly level shown in the first figure. Positive and negative changes both remain visible around zero.
This count describes the record. It is not the probability that the next year will cool, a test of independence, or an estimate of an acceleration parameter. The selected start year is stated rather than hidden, and the full annual dataset is available for another window. The evidence supports a narrower conclusion: repeated annual decreases can coexist with a much warmer later period.
04 / Beyond the thermometer
Surface temperature is not the whole energy budget.
An annual surface-temperature anomaly describes one part of the climate system. Energy can move between its parts while the planet continues gaining heat overall. A heat inventory therefore asks a different question from the comparison between two annual temperatures.
Earth receives energy from the Sun and loses energy to space through radiation. When absorbed energy exceeds the amount leaving, the difference increases the energy stored in the climate system. The ocean's large heat capacity helps explain why that accumulation cannot be read directly from an annual surface-temperature change.
The two records below retain different observation windows. The ocean share describes accumulated energy during 1971-2018; the more recent imbalance is an average for 2013-2025. Together they widen the evidence beyond the thermometer, without supplying an unobserved heat-budget estimate for 2025 alone.
Most of the extra energy went into the ocean.
- Ocean share of Earth-system energy gain
- 91%
The IPCC assessed that the ocean accounted for 91% of the energy gained by the climate system during 1971-2018. A surface-temperature series therefore describes only one part of a much larger heat inventory.
Boundary. This is a share of accumulated energy, not a temperature change or a newly measured percentage for 2025. It does not locate regional ocean changes.
How this evidence was obtained
The assessment combines estimates of heat accumulated in the ocean, land, atmosphere and cryosphere. The percentage refers to the ocean's share of the total energy gain over the stated period, not to the fraction of incoming sunlight absorbed by the ocean.
The planet's energy account remained positive.
- Mean Earth energy imbalance
- 1.12W/m²
IGCC 2025 estimates an average energy imbalance of 1.12 W/m² during 2013-2025, with a 90% confidence interval of 0.78-1.46 W/m². The denominator is Earth's entire surface, and a positive value means that the climate system gained energy overall.
Boundary. This is a multiyear mean, not the imbalance of 2025 alone. It is neither CO2 radiative forcing nor an annual surface-temperature anomaly.
How this evidence was obtained
Section 6 derives the imbalance from an observation-based energy inventory. For 2021-2025, ocean uptake is scaled to total-system uptake using an assumed 91% ocean share because the other components extend only through 2020. Assessed heating rates and uncertainties below 2,000 m are held constant over the period.
05 / Testing the mechanism
The mechanism leaves a spectral signal.
The greenhouse explanation can be tested at identifiable wavelengths. Spectroscopy establishes where CO2 absorbs and emits infrared radiation; atmospheric measurements and radiative-transfer calculations can then isolate changes in its contribution to the energy exchange.
At initially unchanged temperatures, additional CO2 reduces the escape of infrared energy in relevant spectral regions by changing the atmospheric levels that contribute to radiation reaching space. Those levels are often colder. Subsequent warming increases thermal emission, while feedbacks and heat storage shape the response. This is absorption and emission through an atmosphere, not reflection from a glass roof.
A measured spectral signature provides a different kind of evidence from two quantities rising together over time. The field study below tests the expected physical pathway at two locations. Its result is deliberately kept separate from the global planetary energy imbalance.
CO2 interacts with identifiable infrared wavelengths.
- An important CO2 infrared band
- ~15µm
An important CO2 bending band lies near 667 cm⁻¹, corresponding to approximately 15 micrometers. Its spectral structure gives the greenhouse explanation a physical signature that can be examined in radiation measurements.
Boundary. This is a band, not CO2's only absorption wavelength. Its position alone does not quantify global warming. Absorption is not reflection from a glass roof, and saturation of a line center does not eliminate the effect of additional CO2.
How this evidence was obtained
Molecular absorption and emission vary with wavelength, pressure and temperature. The cited synthesis connects laboratory spectroscopy, radiative-transfer physics and observed atmospheric spectra. In relevant spectral regions, additional CO2 changes the levels from which radiation effectively escapes to space.
The expected radiative change was measured at two sites.
- Approximate CO2-related surface-forcing trend
- 0.20W/m² per decade
Feldman and colleagues reported increases of approximately 0.20 ± 0.06 W/m² per decade at Southern Great Plains and 0.20 ± 0.07 at North Slope of Alaska. These are the paper's reported uncertainties; no additional confidence label is assigned here.
Boundary. Two-site clear-sky surface forcing is not global top-of-atmosphere forcing or total planetary energy imbalance. Neither this trend nor the spectral band alone estimates equilibrium climate sensitivity.
How this evidence was obtained
Infrared measurements, ancillary observations and radiative-transfer calculations isolate the changing CO2 contribution to downward surface radiation under clear skies. The study examined a period in which atmospheric CO2 increased by about 22 ppm. Its method is measurement-based, not model-free.
06 / History and inference
What can a historical test establish?
A temperature reconstruction can agree with later analysis without validating every explanation originally attached to it. Historical climate research becomes more useful when the test matches the claim, rather than treating an old result as either entirely right or entirely wrong.
Callendar's temperature reconstruction offers a concrete example. A later comparison can assess the reconstructed warming pattern on a common geographic and temporal reference. That exercise does not, by itself, validate the original estimates of atmospheric CO2 or the original attribution of the warming.
Modern climate sensitivity is another distinct claim: the response to a specified change in CO2 concentration under specified conditions. It is not an estimate of the temperature of an individual year. Explaining the mechanism and assessing the response prepares the ground for attribution, but the cause of observed warming still requires the separate assessment that follows.
A historical temperature record survived a later comparison.
- Callendar reconstruction versus CRUTEM4
- 0.81correlation r
Hawkins and Jones compared Callendar's 147-land-station reconstruction with CRUTEM4 and reported a correlation of 0.81. They aligned the geographic domain to land between 60°S and 60°N and used an 1880-1935 anomaly reference.
Boundary. A correlation of 0.81 is not 81% accuracy. Agreement does not validate every historical CO2 observation, radiative assumption or attribution claim, and a land-only comparison is not the global land-ocean record plotted above.
How this evidence was obtained
The published reanalysis compares historical land-temperature reconstructions over their common historical period. This checks agreement in the reconstructed pattern under a common domain and reference; it does not turn the two reconstructions into independent experiments. No reanalysis is rerun on this page.
Climate sensitivity answers a different temperature question.
- Best estimate of equilibrium climate sensitivity
- 3.0°C
AR6 assesses a best estimate of 3.0°C for equilibrium climate sensitivity, with a likely range of 2.5-4.0°C. The quantity is a global surface-air-temperature response to doubled atmospheric CO2 concentration after the planetary energy budget balances.
Boundary. This is not the observed 2025 global mean surface-temperature anomaly, an emissions-per-tonne coefficient, or a forecast for a particular calendar year. Ocean heat uptake and the time path of forcing matter for the transient response.
How this evidence was obtained
The assessment combines understanding of feedbacks, the instrumental record, paleoclimate evidence and other constraints. Its likely range is an assessed uncertainty range, not simply the smallest and largest outputs from a collection of models. The metric excludes slow ice-sheet feedbacks.
07 / The attribution boundary
A moving average cannot identify the cause.
The AR6 Synthesis Report assessed that human activities have unequivocally caused global warming, with global surface temperature reaching about 1.1 degrees Celsius above 1850-1900 in 2011-2020. That assessment is a scientific finding, not a conclusion newly inferred from the controls on this page.
Attribution is an assessment, not a moving average
°C relative to 1850-1900. Published 2016-2025 and 2025 assessments, with original likelihood labels.
+1.26°C; very likely range 1.13-1.36 °C. Original likelihood labels are not interchangeable.
Preview. Click, tap, or press Enter to pin.Source: IGCC 2025 / Forster et al. (2026), sections 7 and 8.1, Tables 5 and 6; reviewed assessment extract. Solid circles: observed, very likely ranges. Dashed squares: human-induced, likely ranges. Interval overlap is not a significance test.
Exact values
| Period / quantity | Estimate | Lower | Upper | Range |
|---|---|---|---|---|
| 2016-2025 / Observed warming | 1.26 | 1.13 | 1.36 | very likely |
| 2016-2025 / Human-induced warming | 1.24 | 1.00 | 1.50 | likely |
| 2025 / Observed warming | 1.39 | 1.26 | 1.52 | very likely |
| 2025 / Human-induced warming | 1.37 | 1.10 | 1.70 | likely |
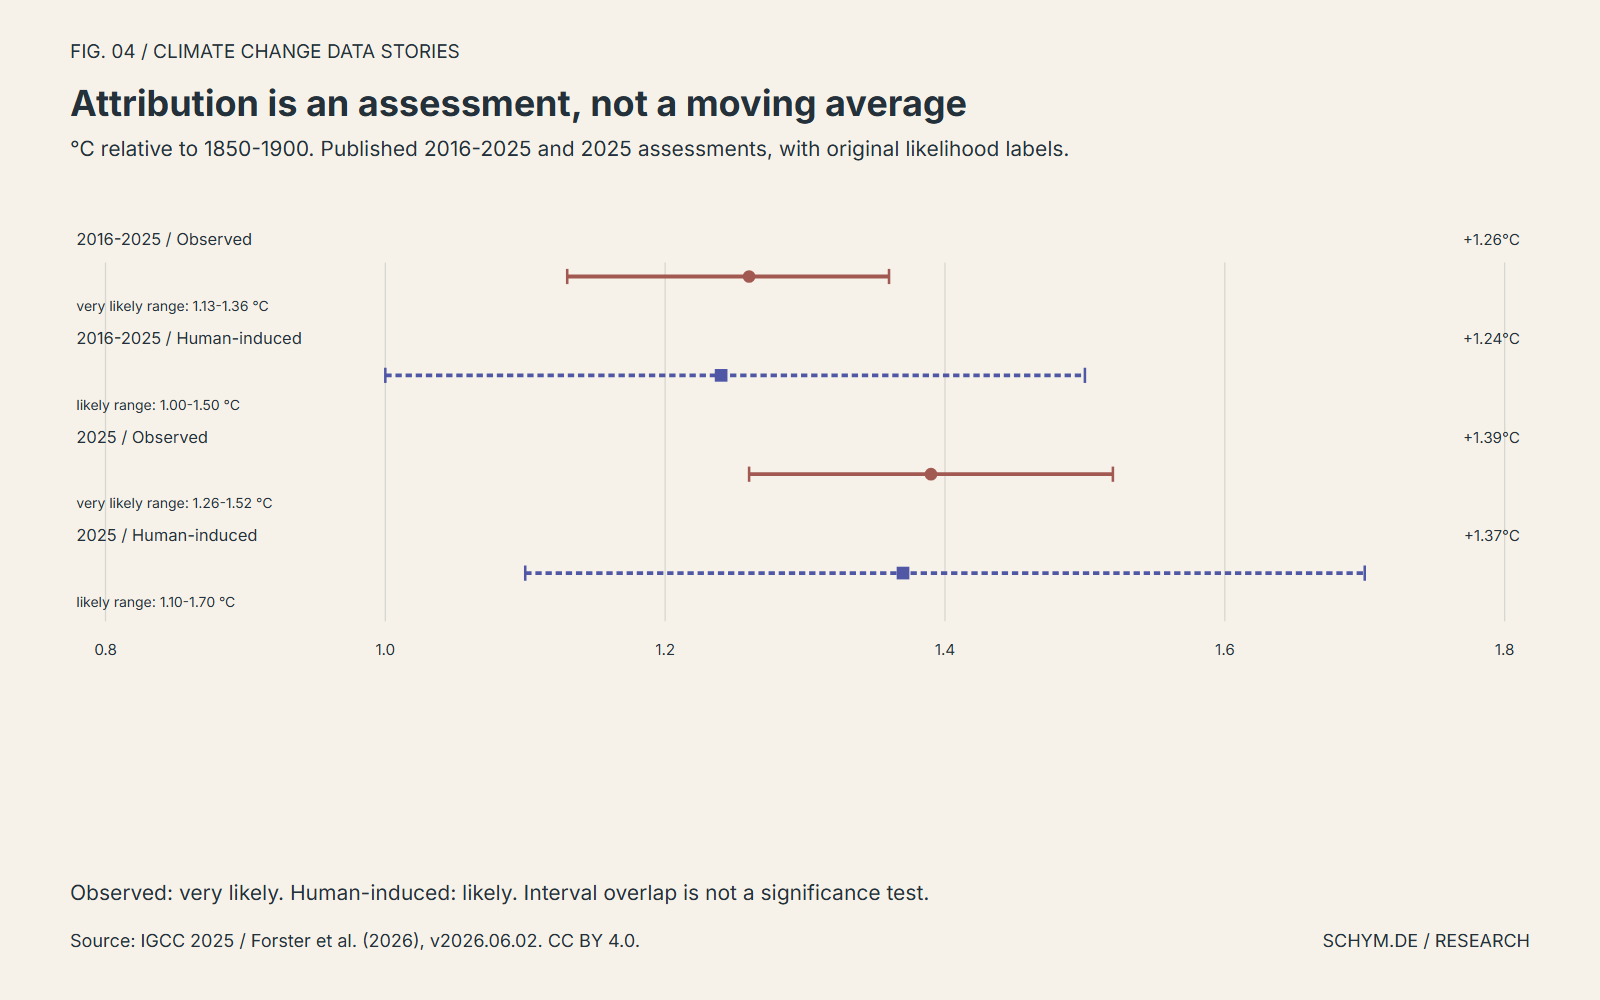
Forster and colleagues' post-AR6 update reports observed warming of 1.26 degrees for 2016-2025, with a very-likely range of 1.13-1.36 degrees. Its separately assessed human-induced warming is 1.24 degrees, with a likely range of 1.0-1.5 degrees. For 2025 alone, the corresponding reported estimates are 1.39 and 1.37 degrees. The figure preserves the source's different interval definitions and reference periods.
Observed and human-induced estimates are not two independent datasets to subtract mechanically, and overlap between their intervals is not a significance test. Attribution draws on assessed methods, forcings, and climate-model information that the annual CSV does not contain. The interactive averages above perform none of that work. The rounded observed decade assessment reconciles with the 1.256-degree mean of the source's annual values, but that numerical agreement does not convert a mean into attribution.
The comparison determines the answer.
For a reader assessing a temperature headline, the first question is which period it compares and against which baseline. A cooler 2025 describes an annual movement. A warmer 2016-2025 describes a complete-period change. The assessment of human influence is a third, separately supported statement.
The same care applies to 1.5 degrees. An annual observation above that level is not, on its own, a finding that a sustained global warming threshold has been crossed. Nor does a later annual decline establish that the longer-run risk has receded. The evidence needs its time scale, its uncertainty, and the method that gives the claim its meaning.
What these data do not show
- This is a global observational-estimate series. It does not locate regional hazards, exposure, vulnerability, damages, or adaptation effectiveness.
- The frozen annual CSV contains no row-level uncertainty ensemble. The page does not invent annual error bars or infer them from the spread of years.
- Trailing means share observations and are not independent estimates. Longer windows are not automatically better estimates of current warming.
- Published attribution intervals use different likelihood language from observed intervals. Their overlap is not a test, and this page fits no new attribution model.
- The IGCC update is not an IPCC report. Source revisions can change historical values; this release preserves v2026.06.02 rather than mixing vintages.
- No 2026 annual estimate is included. The source ends with the complete year 2025. NASA GISTEMP is a separate candidate product and is not used or rebased here.
- The scientific context combines explicitly labeled heat inventories, a physical wavelength, two-site surface forcing, a historical land-temperature comparison and assessed sensitivity. Their periods, domains and units are not interchangeable, and they are not merged into a new quantitative dataset or causal model.
- Feldman's plus/minus values remain reported uncertainties; no unverified confidence level is assigned. Callendar's correlation is not percentage accuracy, and equilibrium sensitivity is not a forecast for a calendar year.
Methods and provenance
The processing script reads the versioned IGCC annual_averages.csv file, validates its exact four-column schema and consecutive time bounds, and preserves all 176 GMST values for 1850-2025. The year is timebound_lower; no anomaly rebasing or missing-value imputation is performed. Trailing means require every year in the selected window. Calendar decades require ten observations. Annual changes subtract the preceding year's published value. Rankings use competition ranks, retaining ties.
Calculations retain source precision and are rounded only for display; generated means are retained to six decimal places. The observational assessment and human-induced estimates are a reviewed transcription of sections 7 and 8.1, Tables 5 and 6 of Forster et al. (2026). Their source wording and interval types are retained separately from the annual calculations.
The dataset was retrieved on September 8, 2026, from the publisher's v2026.06.02 release. The source and derivative receipts retain SHA-256 hashes. Data and assessment material are credited under CC BY 4.0. A later refresh requires its own version record and reconciliation; it must not overwrite this snapshot.
The six scientific-context records were checked against the cited primary literature and official assessments on September 16, 2026. Their frozen extract records the original units, periods, methods, uncertainty conventions and inferential limits. Public author manuscripts are linked rather than redistributed. These records add scientific context without changing the annual temperature values or fitting a new attribution model.
Source-note correction, September 16, 2026: the 2025 observed warming assessment is located in section 7 and Table 6, not the decadal Table 5. The original raw extract is retained, and the downloadable correction record documents the amended locator. No estimate, bound or likelihood label changed.
- IPCC (2023): AR6 Synthesis Report, Summary for PolicymakersScientific frame: A.1, B.1 and calibrated warming-level terminology.
- Forster et al. (2026): Indicators of Global Climate Change 2025Post-AR6 methods, observed warming, attribution and uncertainty; sections 7 and 8, Tables 5 and 6. Planetary energy imbalance: section 6 and Table 4.
- Smith et al. (2026): IGCC 2025 data, v2026.06.02Versioned dataset and CC BY 4.0 data record.
- IPCC AR6 Working Group I (2021): Chapter 7Earth's energy inventory, greenhouse physics and assessed climate sensitivity; section 7.2.2.2, Table 7.1, Box 7.1 and section 7.5.5.
- Pierrehumbert (2011): Infrared radiation and planetary temperatureRadiative-transfer explanation and CO2 spectral band; Physics Today 64(1), pages 33-38, especially Figure 2. Public author copy.
- Feldman et al. (2015): Observational determination of surface radiative forcingTwo-site clear-sky CO2 surface forcing, 2000-2010; Nature 519, pages 339-343, Figure 4 and Methods. Public DOE-hosted author copy.
- Hawkins and Jones (2013): 75 years after CallendarRetrospective comparison of a historical land-temperature reconstruction with CRUTEM4; section 2, Figure 1 and footnote. Public accepted manuscript.
The original research brief
The question
2025 was 0.12 degrees Celsius cooler than 2024, while 2016-2025 was about 0.32 degrees warmer than 2006-2015. A frozen IGCC record separates annual changes, period averages, and published attribution.
Why it matters
Readers need a defensible way to interpret temperature headlines without confusing short-run variability with a sustained warming level.
The AR6 anchor
AR6 assesses human-caused warming, with global surface temperature about 1.1 degC above 1850-1900 in 2011-2020.
AR6 Synthesis Report (2023) / A.1; B.1.
Evidence and comparison
- Unit of analysis
- World-year; derived complete ten-year windows within one product.
- Baseline and denominator
- IGCC retains 1850-1900. NASA remains a separate companion on its native 1951-1980 baseline: no merging, rebasing, or assumed offset.
- First descriptive test
- Compare adjacent annual changes with 2006-2015 and 2016-2025 means, retaining exact annual observations and identifying the distinction between overlapping and non-overlapping windows.
- Deeper analysis
- Compare annual, ten-, twenty-, and thirty-year trailing means with complete calendar-decade distributions and first differences. These windows do not define Paris Agreement compliance or reproduce attributed warming.
- Attribution status
- descriptive observation
- Uncertainty
- Preserve source uncertainty where supplied; a rolling average does not create an attribution interval. Do not manufacture row-level bounds from rounded assessment ranges.
Principal sources
- Indicators of Global Climate Change
Year; Observed global mean surface temperature anomaly (degC); Published observed and human-induced warming estimates and interval bounds.
1850-2025; annual_averages.csv, v2026.06.02; retrieved 2026-09-08. Published assessment periods: 2016-2025 and 2025. Verified pilot import. - NASA GISTEMP v4
Year; Annual land-ocean temperature anomaly (degC).
Candidate operational companion, not imported: initial CSV request failed. Native 1951-1980 baseline retained in the source description. Not used in the implemented analysis.
Alternative explanations
- Internal ocean variability
- Volcanic and aerosol influences
- Observational revisions
The visual argument
Validated annual line chart with a selected year and complete averaging-window control; exact readout, keyboard and tap selection, and restorable evidence URL.
- Strip plot of complete calendar decades
- Zero-centered annual-change run chart
- Published observed and attributed point-and-whisker assessments
- Exact tables and downloadable CSVs
What these data do not show
- One year cannot establish a sustained warming level.
- Shared underlying observations limit independence between products.
Reproducibility and next release
Run node scripts/climate-change/fetch.mjs to verify or acquire the immutable source, then node scripts/climate-change/generate.mjs and its --check mode. Frozen data/raw/v2026.06.02 inputs, processed CSV and provenance/qa-data.json retain source identity, coverage, calculations and hashes.
- After approval: web study and methods
- Responsive charts and exact values
- 16:9 hero
- LinkedIn launch; optional PDF carousel
- Light/dark exports
- Processed CSV and provenance