CLIM-19 / SPM.C / Research primer
Which German sectors account for the emissions change?
How are changes in Germany's reported greenhouse gas emissions distributed across sectors, gases and alternative reference years?
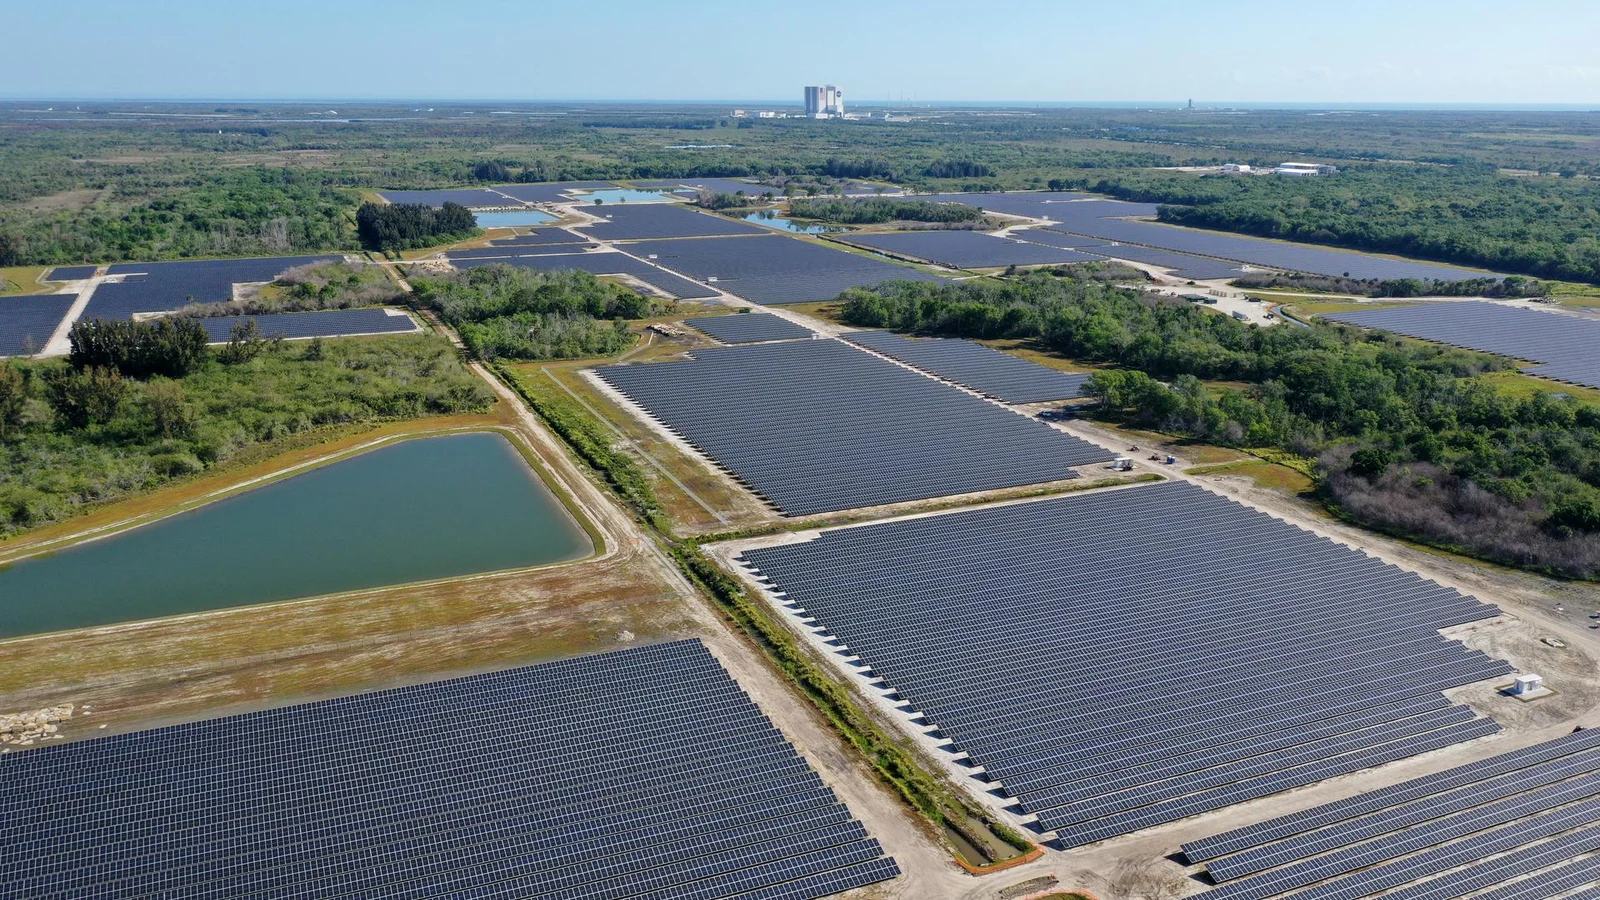
NASA/Kennedy Space Center. Electricity infrastructure at the Discovery Solar Energy Center in Florida in April 2021; energy-system context. Contextual image; not used to estimate a trend. Image credits.
The question
An aggregate decline can combine persistent sectoral change with weather or economic fluctuations. This study would identify the accounting contributions before proposing explanations for them.
Why it matters
Policy priorities depend on which sectors contribute to change and which remain difficult to interpret, not just the national percentage reduction.
The AR6 anchor
AR6 assesses the importance of transitions across sectors and well-aligned policy instruments for deep emissions reductions (high confidence).
AR6 Synthesis Report (2023) / C.3; C.6; A.4.
Evidence and comparison
- Unit of analysis
- Germany-sector-gas-year under explicitly named accounting systems.
- Baseline and denominator
- Compare 1990, 2019 and the latest verified complete year. Keep land use separate and use one documented CO2-equivalent convention within each total.
- First descriptive test
- Decompose national changes into sector contributions in MtCO2e and percentage points of baseline emissions; preserve increases alongside decreases rather than displaying only reductions.
- Deeper analysis
- Reconcile UBA and EDGAR at the narrowest defensible common sectors. Repeat the comparison excluding provisional observations and pandemic endpoints before discussing persistence.
- Attribution status
- descriptive observation
- Uncertainty
- Inventory estimates and preliminary releases have different status. Cross-source differences can reflect system boundaries rather than measurement errors or policy performance.
Principal sources
- UBA Greenhouse Gas Emissions
German GHG emissions by inventory sector; Gas; Inventory status and land-use treatment.
Target 1990-2024; 2025 only if released and explicitly provisional; checks pending. Candidate source; import and publication checks are still required. - JRC EDGAR
German country-sector-gas emissions; Published GWP convention.
Target 1990-2024 EDGAR 2025; common-scope and release checks pending. Candidate source; import and publication checks are still required.
Alternative explanations
- Industrial production
- Winter weather
- Fuel prices
- Inventory methodology
The visual argument
Provisional: sector contribution bars with baseline selection; annotate inventory vintage, land-use exclusion and provisional years, keeping the national reconciliation visible.
- Sector trend small multiples
- Gas-composition comparison
- UBA-EDGAR boundary reconciliation
- Endpoint sensitivity table
What these data do not show
- Sector contributions do not identify policy treatment effects.
- Territorial inventories cannot establish consumption footprints or emissions displaced abroad.
Reproducibility and next release
Plan src/build.mjs and data/processed/german-sector-change.csv from immutable data/raw inventories; test sector crosswalks, totals, gas conventions and reference-year arithmetic, preserving hashes and rights in provenance.
- After approval: German sector study
- Article and inventory methods
- Responsive contributions and exact values
- 16:9 hero and launch copy
- Optional PDF carousel
- Chart exports and processed inventory CSV