CLIM-20 / SPM.C / Research primer
Does clean-energy finance reach the same regions as new capacity?
How does the regional distribution of tracked renewable-energy finance compare with the distribution of wind and solar capacity additions?
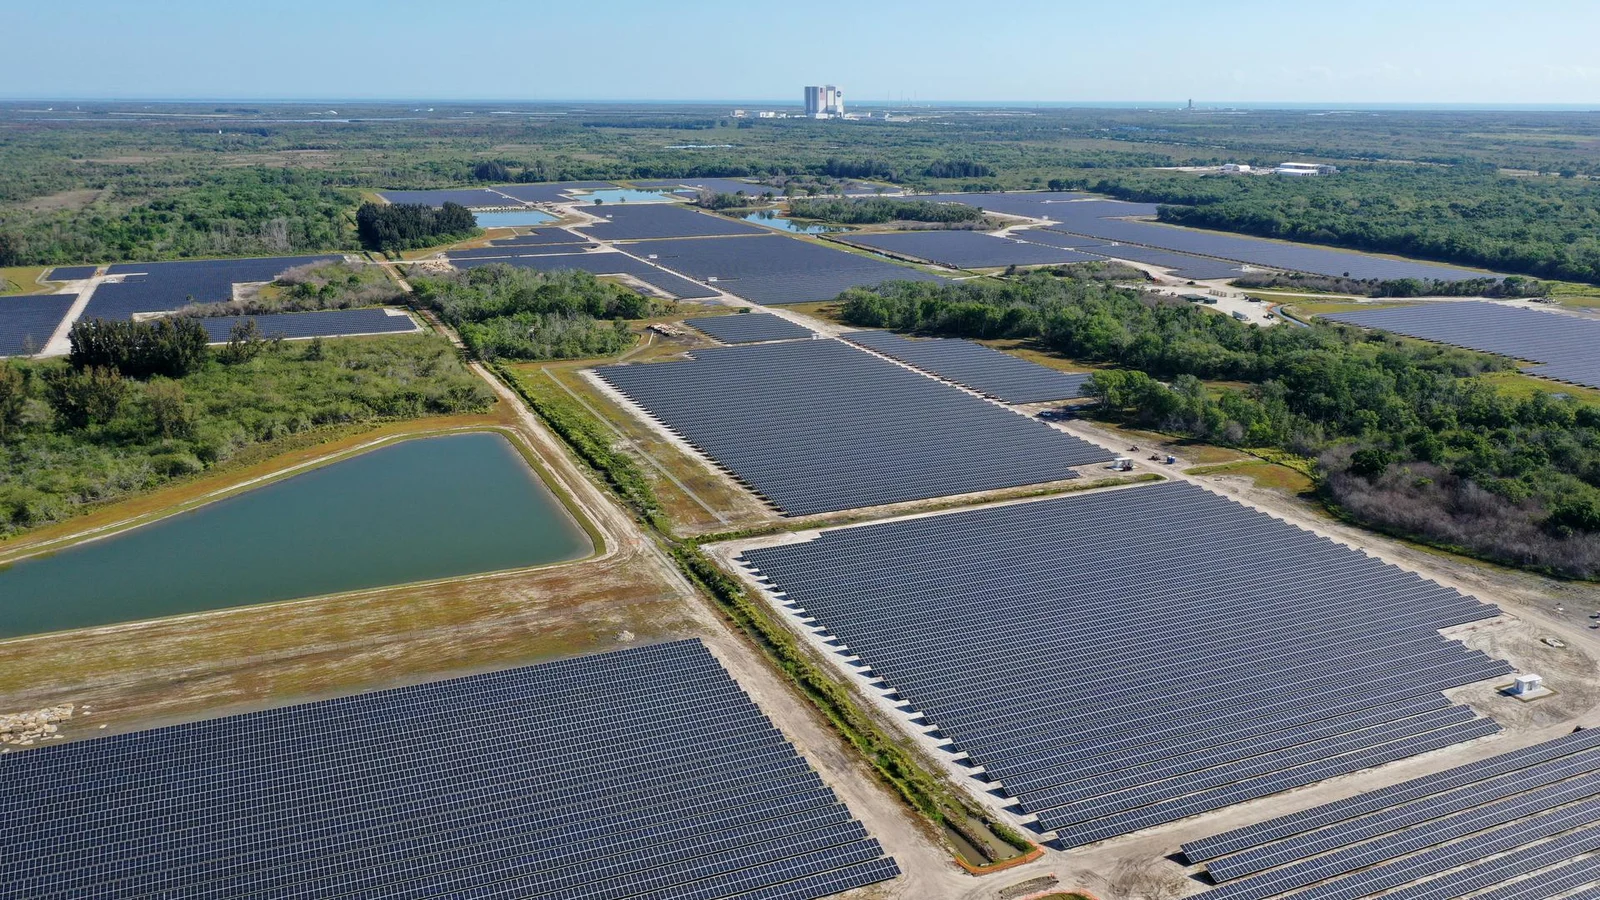
NASA/Kennedy Space Center. Rows of solar panels at the Discovery Solar Energy Center in Florida, photographed in April 2021. Contextual image; not used to estimate a trend. Image credits.
The question
Investment commitments and commissioned capacity occur on different timelines. Their geographical comparison can reveal concentration without pretending that contemporaneous spending purchases contemporaneous megawatts.
Why it matters
Global deployment totals can hide unequal access to capital, but a regional mismatch requires an accounting and timing explanation before a financing-gap claim.
The AR6 anchor
AR6 identifies finance and technology as critical enablers of accelerated climate action, with barriers to redirecting sufficient capital toward climate goals (high confidence).
AR6 Synthesis Report (2023) / C.3; C.7.
Evidence and comparison
- Unit of analysis
- Region-technology-reporting-period, retaining commitment and commissioning dates separately.
- Baseline and denominator
- Compare regional shares within each product's documented global coverage. Match wind and solar finance only if available; broader energy finance remains a separately labeled context.
- First descriptive test
- Contrast regional finance shares with capacity-addition shares over aligned multiyear windows, displaying the unallocated finance category and countries excluded from the crosswalk.
- Deeper analysis
- Test one- to three-year lag windows and concentration measures. Describe additions as net capacity changes unless gross commissioning and retirements are separately available.
- Attribution status
- descriptive observation
- Uncertainty
- Finance tracking and capacity statistics have different coverage. Regional share differences do not measure the amount of investment missing from an economically optimal allocation.
Principal sources
- IRENA Renewable Capacity Statistics
Wind and solar installed capacity; Annual capacity change; Country.
Target 2010-2025, IRENA 2026 tables; revision checks pending. Candidate source; import and publication checks are still required. - Climate Policy Initiative Global Landscape of Climate Finance
Tracked renewable-energy finance; Destination region; Reporting period and technology coverage.
Target 2019-2023 published annual or paired periods; export checks pending. Candidate source; import and publication checks are still required.
Alternative explanations
- Project lead times
- Financing costs
- Technology prices
- Untracked domestic investment
The visual argument
Provisional: paired regional share dots with reporting-window selection; annotate coverage mismatch, unallocated finance and the lag between commitments and commissioning.
- Wind versus solar concentration
- Lag-window sensitivity
- Net capacity additions
- Region-crosswalk coverage table
What these data do not show
- Finance divided by capacity additions is not a project cost estimate.
- Neither source establishes why capital is absent from a particular market.
Reproducibility and next release
Plan src/build.mjs and data/processed/finance-capacity.csv from frozen data/raw summaries; test region crosswalks, coverage shares, period alignment and capacity revisions, recording monetary conventions, hashes and rights in provenance.
- After approval: finance-capacity study
- Article and timing methods
- Responsive comparisons and exact values
- 16:9 hero and LinkedIn launch
- Optional PDF carousel
- Chart exports and regional CSV