CLIM-21 / SPM.C / Research primer
How much do headline carbon prices reveal about emissions coverage?
How do published carbon prices, covered emissions shares and sector coverage differ across national and regional pricing instruments?
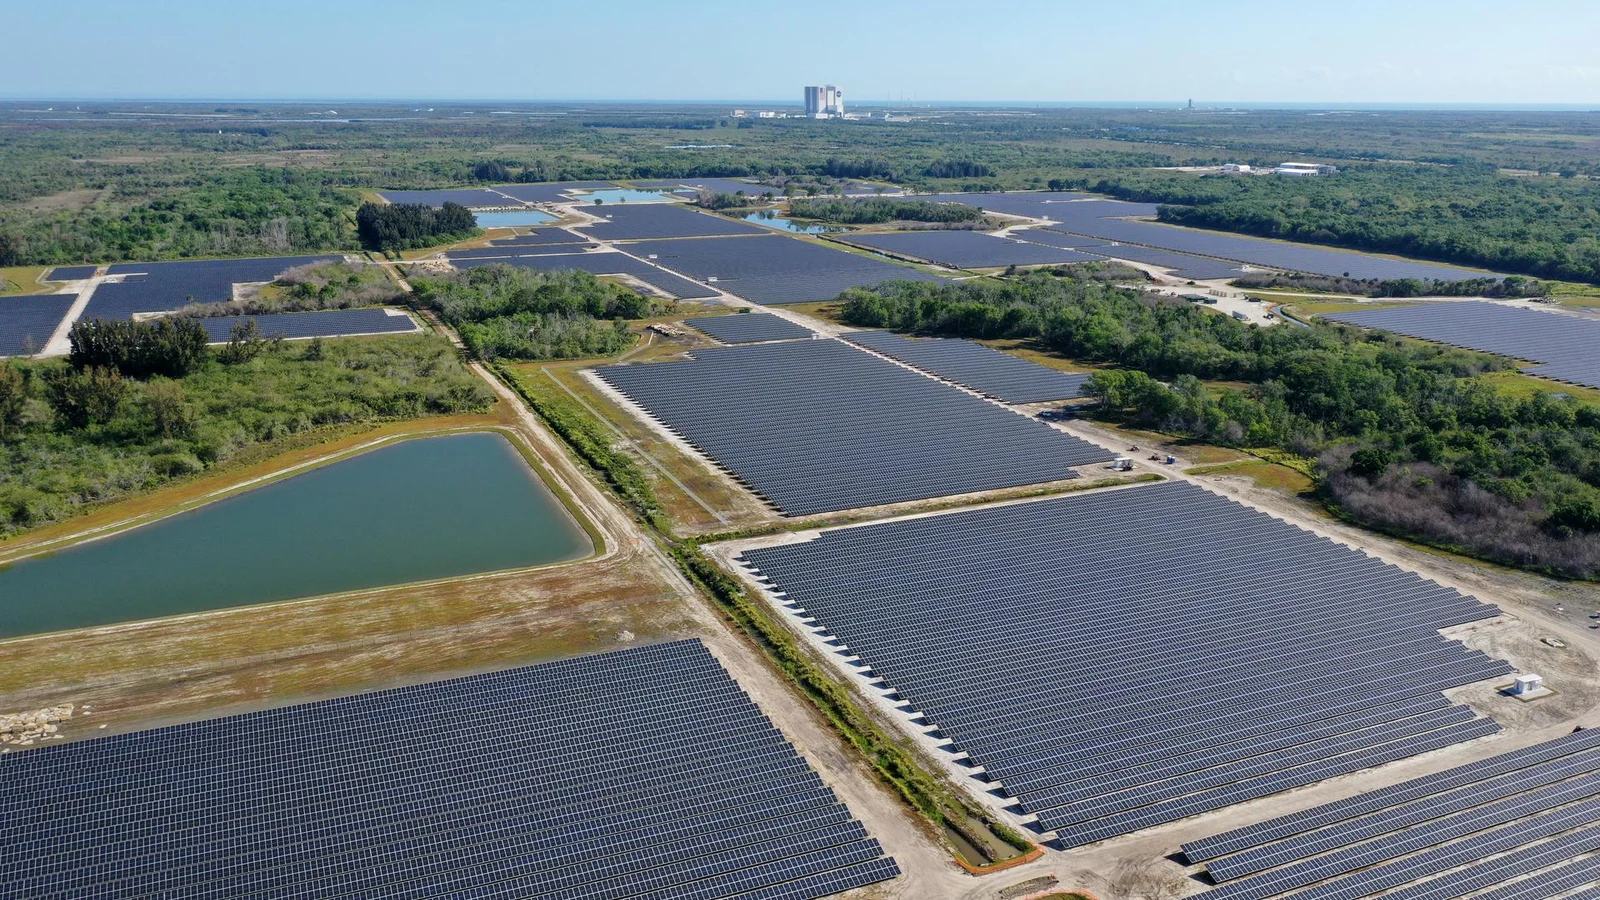
NASA/Kennedy Space Center. Electricity infrastructure at the Discovery Solar Energy Center in Florida in April 2021; energy-system context. Contextual image; not used to estimate a trend. Image credits.
The question
A high quoted price does not describe the entire economy's carbon constraint. This comparison examines the scope of instruments before relating them to national emissions profiles.
Why it matters
Policy comparison needs price, coverage and exemptions together; ranking prices alone can exaggerate the reach of an instrument.
The AR6 anchor
AR6 assesses expanding mitigation policies and finds that widely applied regulatory and economic instruments can support deep emissions reductions (high confidence).
AR6 Synthesis Report (2023) / C.6; A.4.
Evidence and comparison
- Unit of analysis
- Instrument-observation-date, with jurisdiction-sector emissions as dated context.
- Baseline and denominator
- Retain the dashboard's price date, currency and emissions denominator. Map overlapping instruments explicitly; do not add EU and national coverage percentages.
- First descriptive test
- Compare quoted prices with source-reported coverage and instrument status, then show the corresponding sector profile without applying coverage fractions to incompatible EDGAR totals.
- Deeper analysis
- Separate implemented from scheduled instruments and test classifications under overlapping coverage. A sector-scope concordance is preferable to an invented economy-wide effective carbon price.
- Attribution status
- descriptive observation
- Uncertainty
- Coverage and prices can refer to different dates. A spot allowance price is not the average price paid or the marginal incentive faced by every emitter.
Principal sources
- World Bank Carbon Pricing Dashboard
Published carbon price; Emissions coverage; Instrument status and covered sectors.
Target dated 2026 dashboard snapshot and 2024/2025 coverage years; verification pending. Candidate source; import and publication checks are still required. - JRC EDGAR
Country-sector GHG emissions; Gas coverage and accounting convention.
Target 2024 EDGAR 2025 inventory; matched-scope verification pending. Candidate source; import and publication checks are still required.
Alternative explanations
- Free allocation
- Exemptions
- Overlapping instruments
- Exchange rates and price volatility
The visual argument
Provisional: price-coverage comparison with instrument-type filtering; annotate observation dates, scheduled status and overlaps, keeping national emissions context in a separate panel.
- Sector-scope matrix
- Implemented versus scheduled instruments
- Overlapping-jurisdiction diagram
- Price-date and currency table
What these data do not show
- These comparisons do not estimate an instrument's causal emissions effect.
- Quoted prices omit subsidies, regulations and many implicit incentives.
Reproducibility and next release
Plan src/build.mjs and data/processed/pricing-coverage.csv from immutable data/raw snapshots; check instrument identity, dates, coverage bounds and jurisdiction overlaps, documenting crosswalks, hashes and rights in provenance.
- After approval: carbon-pricing scope study
- Article and instrument methods
- Responsive comparisons and exact values
- 16:9 hero and launch copy
- Optional PDF carousel
- Chart exports and instrument CSV