CLIM-09 / SPM.A / Research primer
Where does water stress coincide with food vulnerability?
Which countries combine high baseline water stress with vulnerable food systems, and how stable is that comparison across indicator choices?
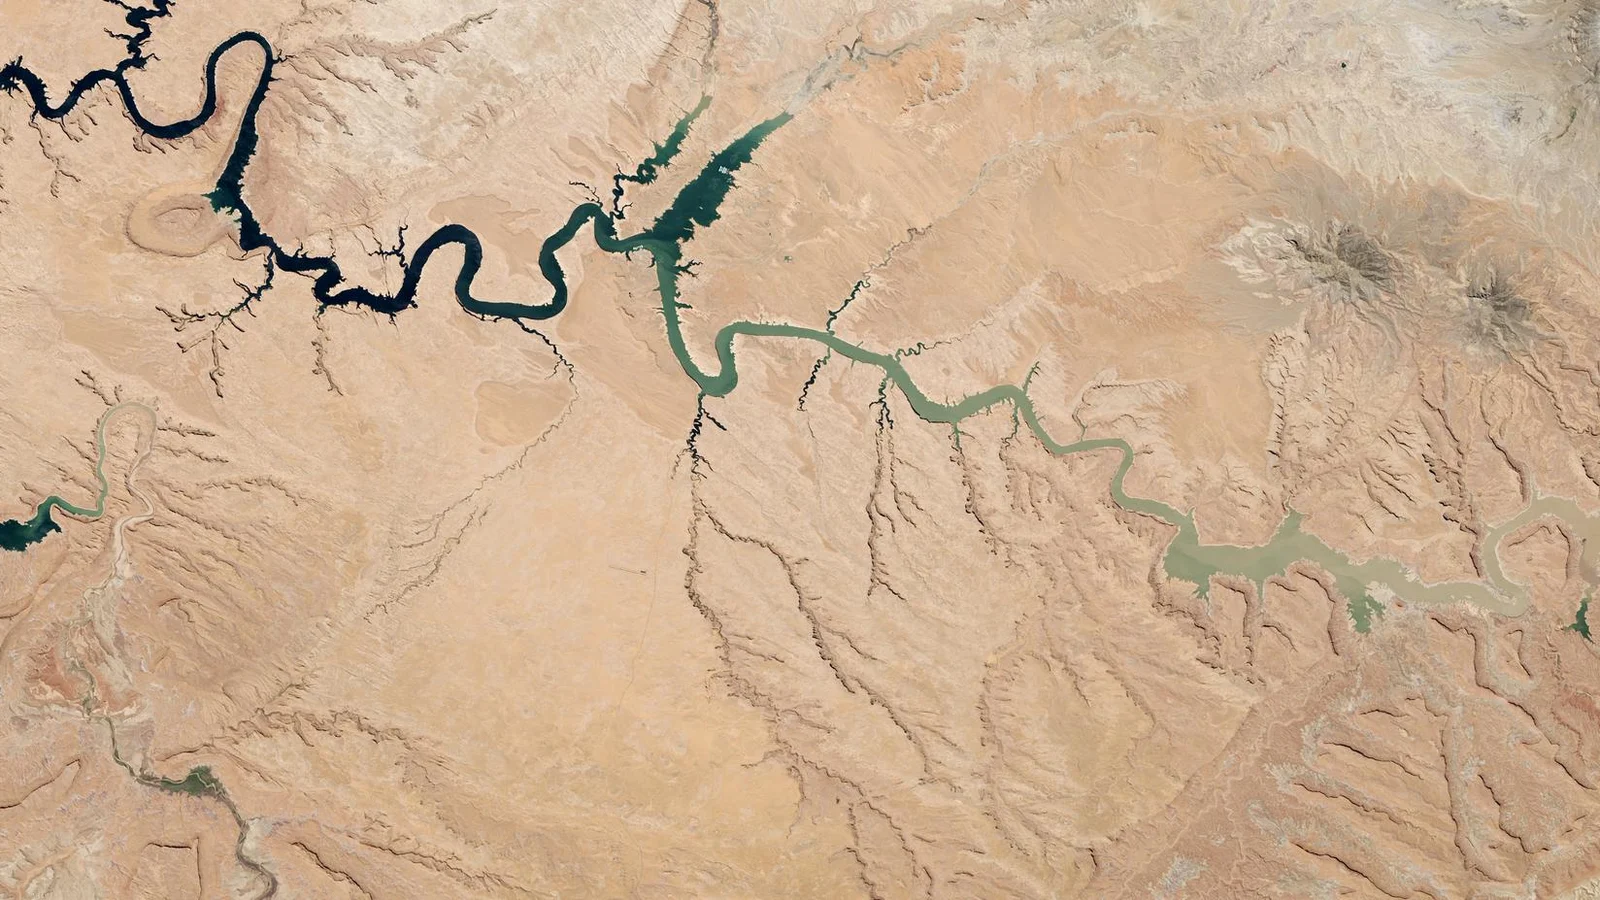
NASA Earth Observatory/Landsat. Landsat imagery of Lake Powell and its exposed shoreline in May 2014. Contextual image; not used to estimate a trend. Image credits.
The question
Water stress measures pressure on supply, not harvest failure. Pairing it with food-system vulnerability can identify questions for closer investigation without estimating missing crop losses.
Why it matters
Adaptation priorities depend on both environmental pressure and the capacity of food systems to absorb it; either measure alone is incomplete.
The AR6 anchor
AR6 assesses adverse impacts on people and nature and persistent adaptation gaps; mitigation and adaptation interact with sustainable development in context-dependent ways (high confidence).
AR6 Synthesis Report (2023) / A.2; A.3; C.4.
Evidence and comparison
- Unit of analysis
- Country-climatology paired with a dated food-vulnerability snapshot.
- Baseline and denominator
- Use Aqueduct's native withdrawal-to-available-supply definition and aggregation weights. Keep ND-GAIN scores in their native scale; do not average the two indices.
- First descriptive test
- Compare food-vulnerability distributions across published water-stress categories, exposing countries with discordant profiles and retaining the different evidence dates beside their values.
- Deeper analysis
- Repeat the comparison using food sensitivity and adaptive capacity separately. Audit shared climate inputs so mechanically related indicators are not presented as independent corroboration.
- Attribution status
- descriptive observation
- Uncertainty
- Both products contain modeled or composite elements. Show missing components and classification sensitivity rather than calculating spurious statistical precision from published scores.
Principal sources
- WRI Aqueduct 4.0
Baseline water-stress score; Water-stress category; Country aggregation method.
Target Aqueduct 4.0 baseline climatology, provisionally 1979-2019; metadata check pending. Candidate source; import and publication checks are still required. - ND-GAIN Country Index
Food vulnerability score; Food exposure, sensitivity and adaptive-capacity components.
Target 2023 country snapshot; component and release checks pending. Candidate source; import and publication checks are still required.
Alternative explanations
- Irrigation and water management
- Food imports
- Agricultural structure
- Shared index inputs
The visual argument
Provisional: grouped country dot plot with component selection; annotate baseline years and discordant profiles, reserving a map for verified country geometry and missingness.
- Food-component profiles
- Native water-stress categories
- Indicator-overlap matrix
- European comparison table
What these data do not show
- A national score cannot locate farm-level water shortages.
- Neither product measures the causal effect of climate change on crop yields.
Reproducibility and next release
Plan src/build.mjs to generate data/processed/water-food.csv from versioned data/raw aggregates; check country joins, component direction, missing scores and category boundaries, recording licenses and hashes in provenance.
- After approval: water-food web study
- Article and index methods
- Responsive charts and exact profiles
- 16:9 hero and LinkedIn launch
- Optional PDF carousel
- Chart exports and country CSV