CLIM-11 / SPM.B / Research primer
What does another half-degree mean for European summer heat?
How do regional summer-temperature and heat-extreme projections differ between global warming levels of 1.5, 2 and 3 degC?
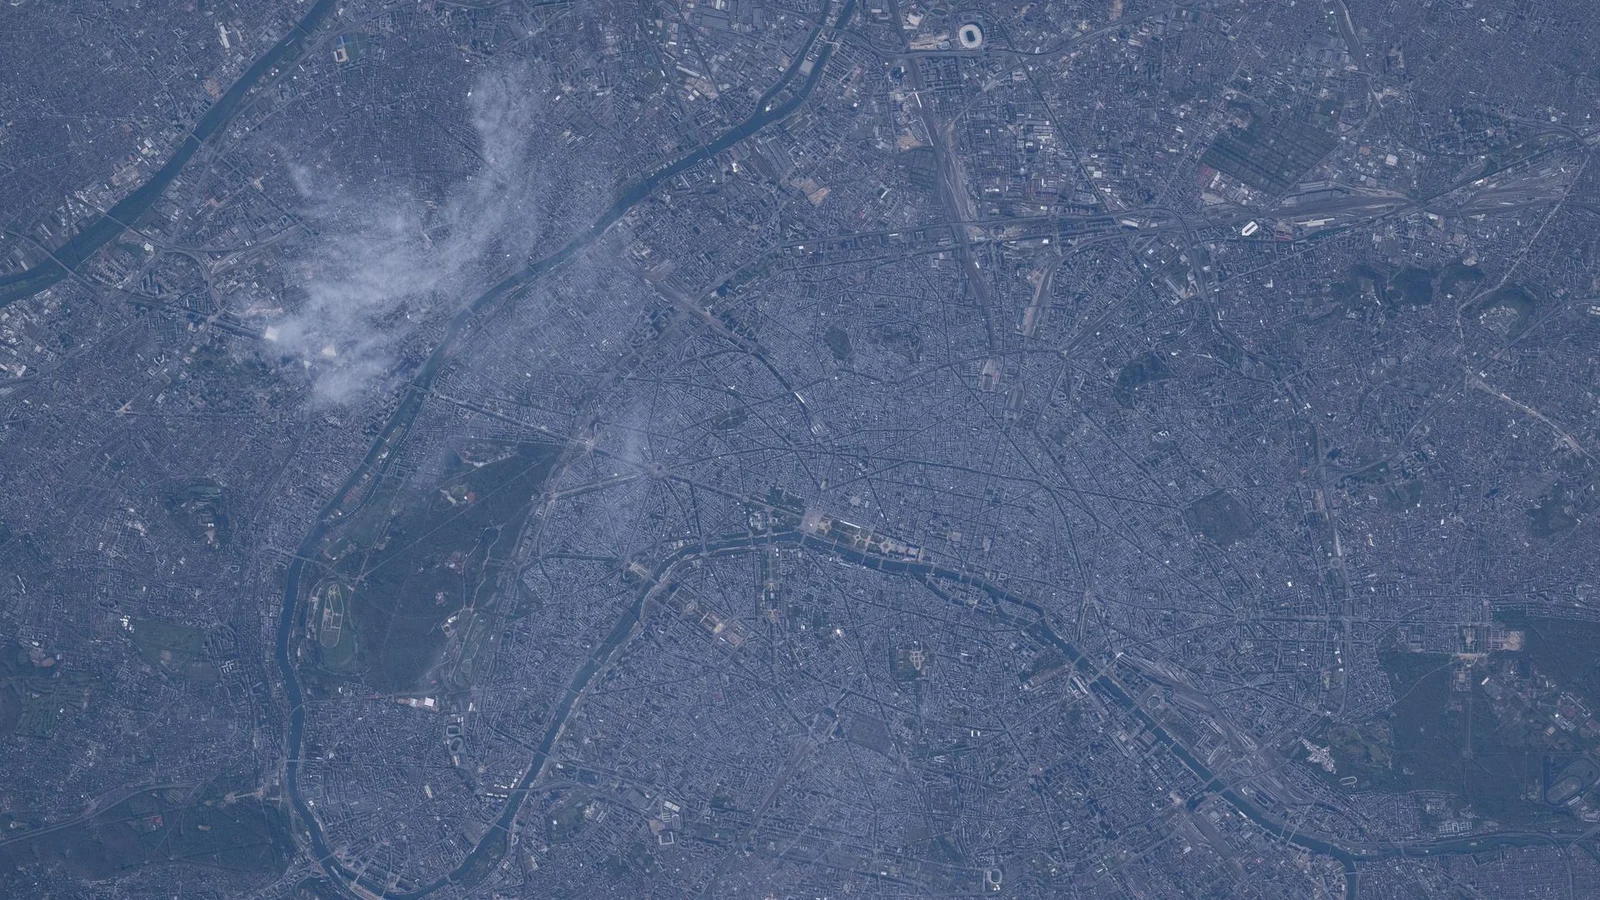
NASA/Chris Williams. Paris and the Seine photographed from the International Space Station on April 4, 2026; urban context, not a heat map. Contextual image; not used to estimate a trend. Image credits.
The question
A global warming level is not a uniform local temperature increase. Compact regional exports can examine how the European summer response varies across places and models.
Why it matters
Infrastructure and health planning use local conditions; interpreting a global target as a regional forecast hides both spatial differences and uncertainty.
The AR6 anchor
AR6 assesses intensification of multiple hazards with every increment of warming and increasing risks and adverse impacts as warming rises (high to very high confidence).
AR6 Synthesis Report (2023) / B.1; B.2; Figure SPM.2.
Evidence and comparison
- Unit of analysis
- Region-indicator-warming-level; historical Germany-year context remains separate.
- Baseline and denominator
- Preserve the Atlas export's stated reference period and warming-level definition. DWD context uses 1991-2020 where supported, without forcing different baselines onto one level scale.
- First descriptive test
- Compare median regional changes and supplied ensemble ranges at each warming level, keeping temperature units and hot-day definitions visibly distinct.
- Deeper analysis
- Estimate incremental differences only from matched models and regions where exported; otherwise compare published ranges without subtracting their percentile endpoints as confidence bounds.
- Attribution status
- projection/scenario analysis
- Uncertainty
- Model spread is not the probability of a policy outcome. Warming-level windows occur at different times across simulations and are not calendar-year forecasts.
Principal sources
- Copernicus Interactive Climate Atlas
Regional summer temperature change; Published hot-extreme indicator; Warming level and ensemble range.
Target 1.5, 2 and 3 degC warming-level windows; export metadata checks pending. Candidate source; import and publication checks are still required. - DWD Climate Time Series
German summer temperature; Published hot-day counts.
Target 1961-2025 complete years; release and indicator checks pending. Candidate source; import and publication checks are still required.
Alternative explanations
- Model composition
- Regional aggregation
- Internal variability
- Different threshold definitions
The visual argument
Provisional: regional interval plot with warming-level selection; annotate units, reference periods and model counts while retaining all levels in the static comparison.
- Incremental-change comparison
- DWD historical summer context
- Model-coverage matrix
- Exact regional scenario table
What these data do not show
- Regional averages do not supply neighborhood heat exposure.
- This analysis cannot predict the year a particular place reaches a threshold.
Reproducibility and next release
Plan src/build.mjs and data/processed/europe-heat-levels.csv from small versioned data/raw exports; verify region definitions, model membership, units and baseline metadata, storing queries, hashes and rights in provenance.
- After approval: European heat-level study
- Article and scenario methods
- Responsive intervals and exact values
- 16:9 hero and LinkedIn launch
- Optional PDF carousel
- Chart exports and scenario CSV