CLIM-13 / SPM.B / Research primer
Why does coastal planning need more than a 2100 endpoint?
How do observed global sea-level change and assessed longer-term commitment alter the questions asked of coastal infrastructure vulnerability?
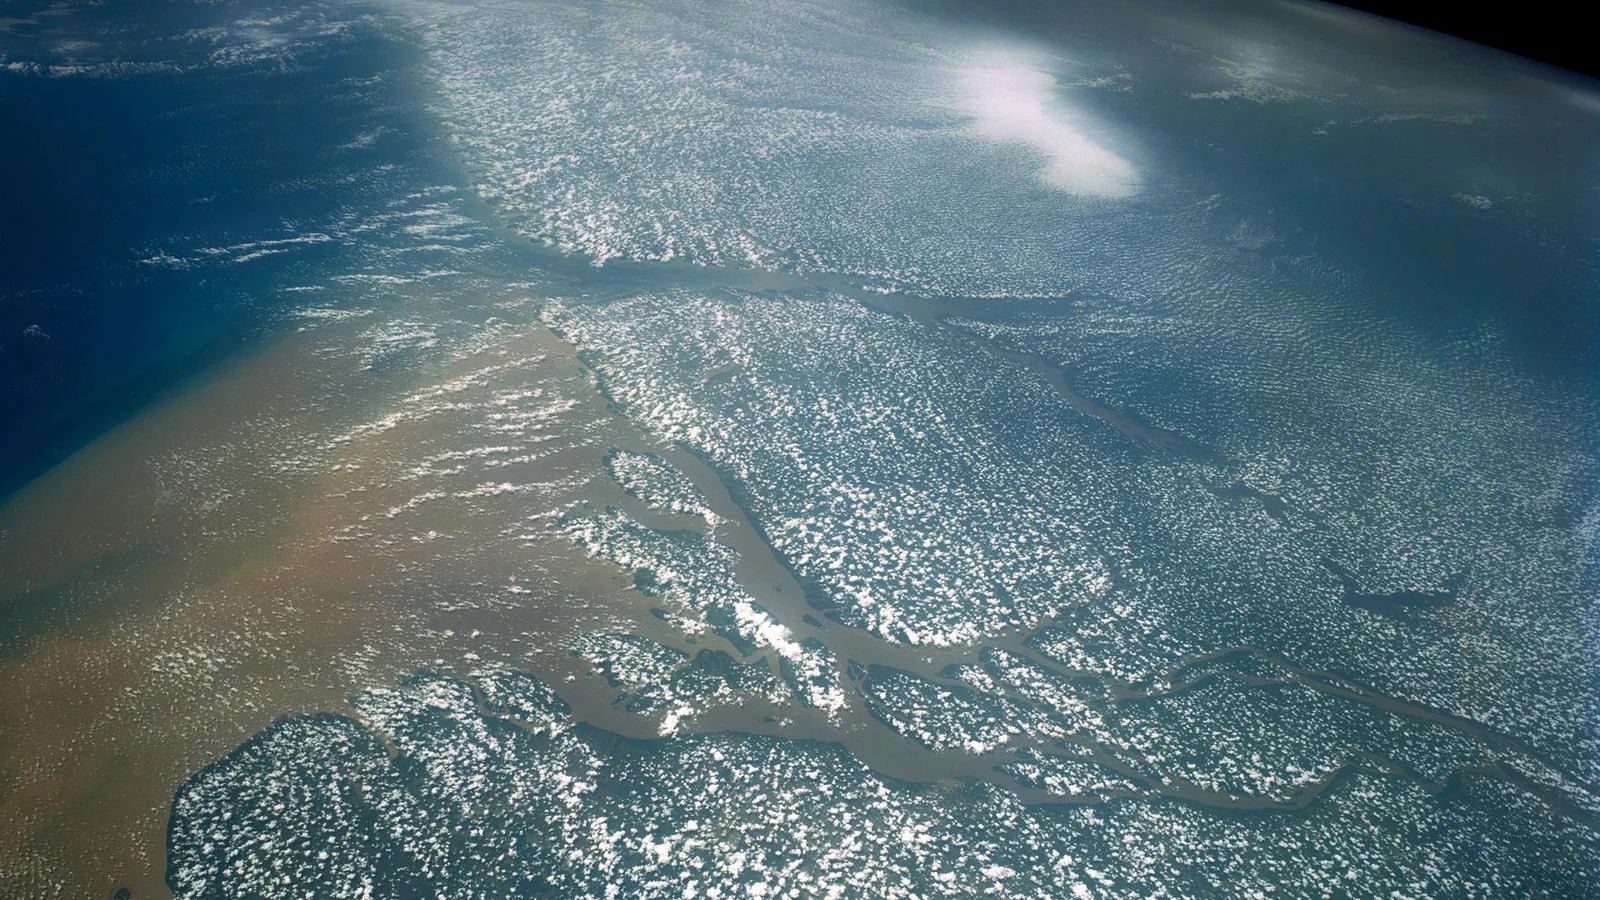
NASA/STS-43 crew. Sediment at the mouths of the Amazon River on Brazil's Atlantic coast, photographed from space in 1991. Contextual image; not used to estimate a trend. Image credits.
The question
Observed sea level, future commitment and infrastructure vulnerability use different clocks. This primer proposes a comparison that preserves those horizons rather than presenting one extrapolated coastline.
Why it matters
Long-lived infrastructure decisions can outlast a conventional scenario endpoint, yet global sea-level change is not a local design height.
The AR6 anchor
AR6 assesses unavoidable or irreversible future changes that mitigation can limit, while additional systems reach adaptation limits as warming increases (high confidence).
AR6 Synthesis Report (2023) / B.3; B.4.
Evidence and comparison
- Unit of analysis
- World-observation-period and country-vulnerability snapshot, without a synthetic local sea-level series.
- Baseline and denominator
- Retain IGCC's sea-level reference and rate intervals. Present IPCC near-term, 2100 and longer-horizon assessments separately, retaining each scenario and confidence statement.
- First descriptive test
- Compare observed multidecadal rates, then place dated country infrastructure profiles beside the assessed horizon distinctions; do not numerically merge their scales.
- Deeper analysis
- Inspect whether country screening changes when infrastructure components replace the aggregate score. Distinguish modeled coastal exposure from present protective capacity and adaptation limits.
- Attribution status
- projection/scenario analysis
- Uncertainty
- Preserve source likelihood ranges and low-likelihood boundary language. An uncertainty interval around global sea level does not quantify local flooding probability.
Principal sources
- Indicators of Global Climate Change
Global mean sea-level change (mm); Published multiyear rates and uncertainty.
Target 1901-2025 IGCC 2025 summaries; underlying export checks pending. Candidate source; import and publication checks are still required. - ND-GAIN Country Index
Infrastructure vulnerability; Published coastal exposure component and definition.
Target 2023 country snapshot; component availability and vintage checks pending. Candidate source; import and publication checks are still required.
Alternative explanations
- Land subsidence
- Vertical land motion
- Coastal defenses
- Settlement and asset growth
The visual argument
Provisional: horizon-separated timeline with country-profile selection; annotate the boundary between observations, assessed projections and longer-term commitment, without extending a fitted historical line.
- Observed multidecadal rate intervals
- Infrastructure-component profiles
- Assessed horizon comparison
- Local-data requirements table
What these data do not show
- Global change cannot determine a port's flood elevation.
- National indices cannot establish that a specific adaptation limit has been reached.
Reproducibility and next release
Plan src/build.mjs and data/processed/coastal-horizons.csv from versioned data/raw extracts; check reference periods, units, component definitions and assessment transcriptions, retaining hashes and publication permissions in provenance.
- After approval: coastal-horizons study
- Article and assessment notes
- Responsive timeline and exact values
- 16:9 hero and LinkedIn launch
- Optional PDF carousel
- Chart exports and evidence CSV