CLIM-23 / SPM.C / Research primer
Does cleaner electricity coincide with lower air-pollution health burdens?
How do changes in fossil electricity generation compare with published air-pollution mortality estimates across a fixed country panel?
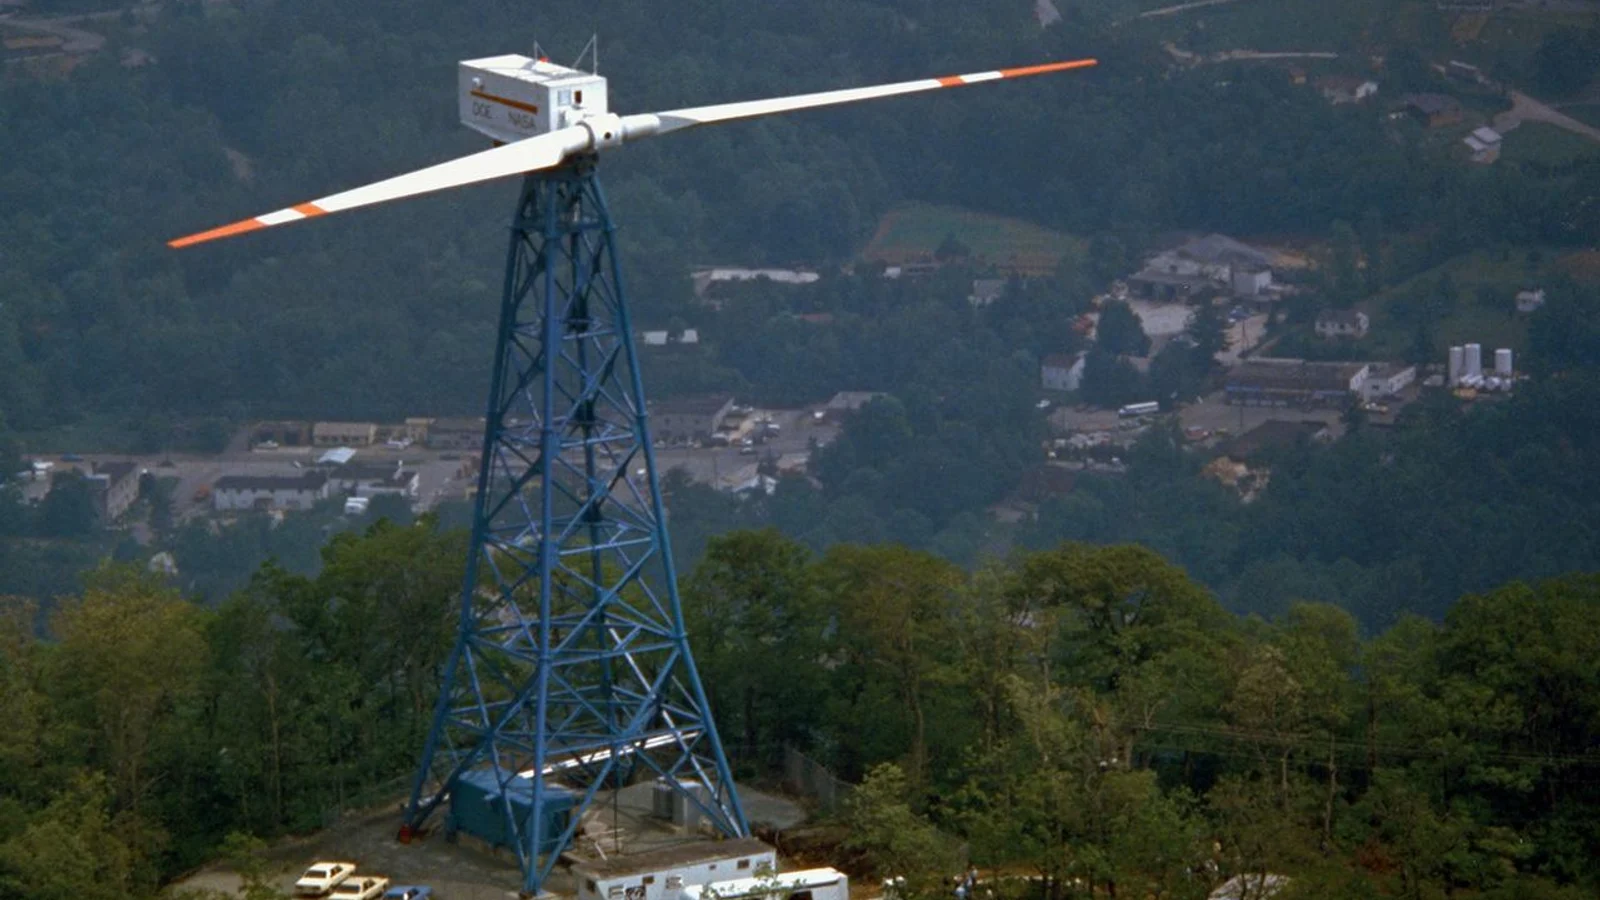
NASA Glenn Research Center. The experimental Mod-1 wind turbine in Boone, North Carolina, in 1979; historical energy-technology context. Contextual image; not used to estimate a trend. Image credits.
The question
Mitigation can have health co-benefits, but power generation is only one source of air pollution. The study would compare the relevant trends while preserving the health model's source attribution.
Why it matters
Climate policy evaluation can overlook near-term health benefits, yet attributing every improvement to electricity decarbonization would overstate what these data identify.
The AR6 anchor
AR6 assesses important air-quality and health co-benefits from near-term mitigation, while sustainable-development synergies and trade-offs depend on context and scale (high confidence).
AR6 Synthesis Report (2023) / C.2; C.4.
Evidence and comparison
- Unit of analysis
- Country-model-year, retaining the health source's attribution boundary.
- Baseline and denominator
- Compare a common starting year and matched endpoint. Use published mortality rates only with compatible population definitions; do not relabel all fossil-fuel mortality as power-sector mortality.
- First descriptive test
- Contrast changes in generation shares and modeled health burdens in separate scales, distinguishing power-specific estimates from broader fossil-fuel estimates wherever the export allows.
- Deeper analysis
- Inspect within-country changes and pollutant-control context; sensitivity to source scope and available years takes precedence over a cross-country regression lacking adequate controls.
- Attribution status
- descriptive observation
- Uncertainty
- Retain published health-model intervals and exposure-response assumptions. Those estimates do not identify the causal effect of a country's electricity policy.
Principal sources
- Ember Yearly Electricity Data
Coal, gas and oil electricity generation; Total generation and fuel shares.
Target 2010-2024 complete years; release and country checks pending. Candidate source; import and publication checks are still required. - Lancet Countdown
Modeled air-pollution mortality; Published fossil-fuel or sector attribution where available; Population denominator.
Target 2010-2023 comparable indicator years; model and export checks pending. Candidate source; import and publication checks are still required.
Alternative explanations
- Transport and industrial pollution
- Pollution-control technology
- Population aging
- Weather and pollutant transport
The visual argument
Provisional: paired change plots with country selection; annotate health-source scope and model vintage, leaving the electricity and mortality axes independently labeled.
- Fuel-mix trajectories
- Health-model uncertainty intervals
- Source-scope comparison
- Matched-country coverage table
What these data do not show
- Co-trending series cannot quantify deaths avoided by a specific power policy.
- Aggregate generation omits local emissions controls and exposure geography.
Reproducibility and next release
Plan src/build.mjs and data/processed/power-health.csv from immutable data/raw exports; check population denominators, model revisions, country joins and source attribution, with hashes and licensing decisions in provenance.
- After approval: power-health comparison
- Article and health-model methods
- Responsive figures and exact values
- 16:9 hero and launch copy
- Optional PDF carousel
- Chart exports and matched-panel CSV