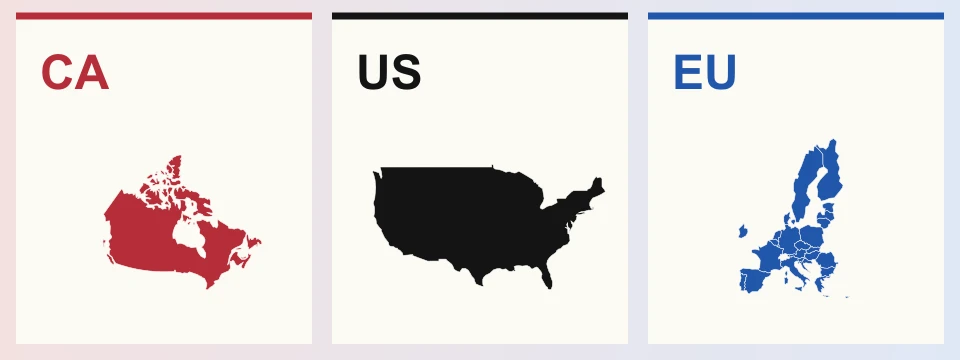
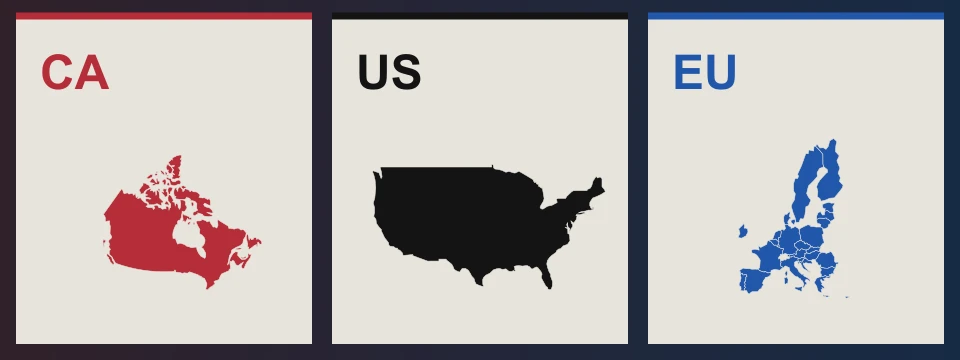
Three Atlantic locator insets: Canada in red, the United States in black and the EU in blue.Three Atlantic locator insets: Canada in red, the United States in black and the EU in blue.
Canada / United States / EU27. Natural Earth regional insets; map extents differ.
SCHYM / DATA STORIESTHE TRANSATLANTIC COMPARISON

What changes when GDP
stops being the only comparison?

Three versions
of the good life.

The US leads in output per person. In the matched health comparison, Canada and the EU spend less per person and record longer lives.
Michael Schymura

45 min / 39 evidence exhibits

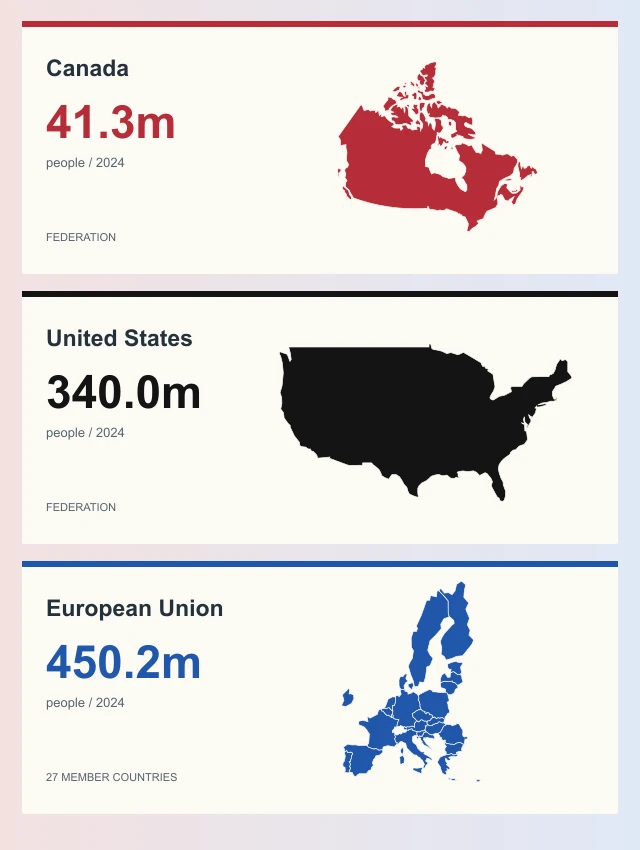
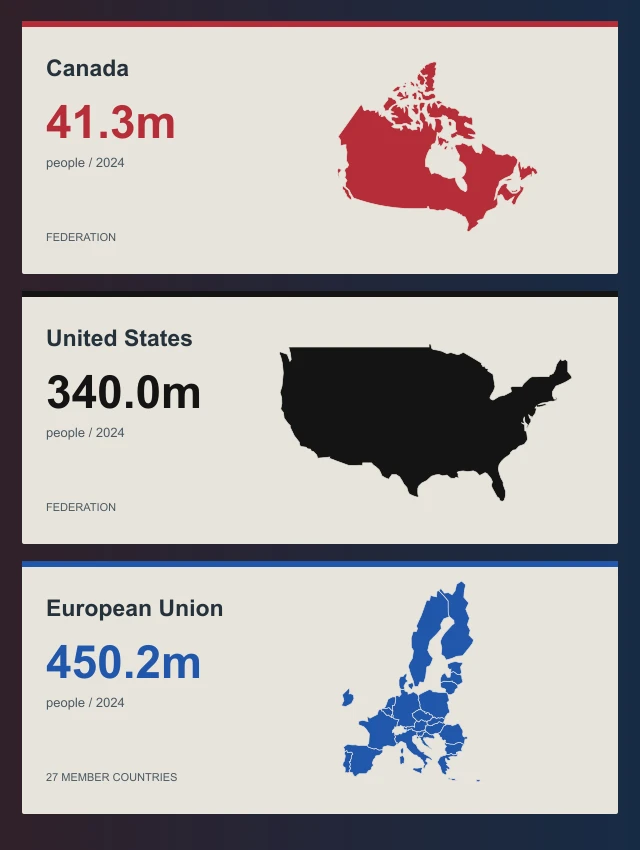
Canada in red: 41.3 million people. United States in black: 340.0 million. EU27 in blue: 450.2 million. Population in 2024; separate regional map insets.Canada in red: 41.3 million people. United States in black: 340.0 million. EU27 in blue: 450.2 million. Population in 2024; separate regional map insets.
Population, 2024, in millions. World Bank / Natural Earth. Generalized regional insets, not a common map scale. The continental US is shown; small and offshore territories may be absent.
ONE ATLANTIC

Ten chapters. Separate outcomes.
No overall league table.

Find your route

Executive summary / the country bulletins

Three societies, in a nutshell.

The United States has the largest resource base per person. Canada combines high educational attainment with unusually concentrated export exposure. The EU pairs longer lives with substantial differences among its members. Eight common KPIs, four miniature comparisons and the trade links put these different positions in view; the chapters explain what each measure leaves out.

Highlights mark the stated highest or lowest value within this trio, not among every EU member. Spending, R&D and age structure describe levels; they do not award an overall winner.

The Canadian bulletin

Canada

41.3m people · US$2.3tn GDP / 2024

A smaller economy. A concentrated relationship.

Thick: CAThin: US / EU

Canada's output per person is above the EU aggregate, but its recent per-person recovery is weaker. High tertiary attainment coexists with an export book dominated by the United States.

Watch the denominator and the destination.

The American bulletin

United States

340.0m people · US$29.3tn GDP / 2024

The resource leader. An outcome puzzle.

Thick: USThin: CA / EU

The United States produces more per person and spends more on health. The matched health comparison nevertheless records shorter lives. Resources alone do not settle the institutional question.

Distinguish capacity from conversion.

The European bulletin

European Union

450.2m people · US$19.5tn GDP / 2024

One union. Twenty-seven versions.

Thick: EUThin: CA / US

The EU aggregate records longer lives at lower health spending than the United States. Its average conceals substantial national variation and describes neither a single treasury nor one school system.

Open the aggregate before drawing a verdict.

Executive spotlight / one common axis

Change the question. See the lead move.

Keep the three cards in place. Select a measure to compare its actual values, and make the matching KPI stand out across all three.

2024 / constant 2021 international dollarsResource measure · Highest measured value emphasized
The same three comparators on one Output / person axisScope: among the three headline comparators only, not all EU member states. The axis shows the measured range, not a zero-origin bar length. A larger output measure marks a larger resource base per person, not a summary of welfare.Canadabelow the maximum57,534United StatesHighest output75,698European Unionbelow the maximum54,342
The same three comparators on one Output / person axisScope: among the three headline comparators only, not all EU member states. The axis shows the measured range, not a zero-origin bar length. A larger output measure marks a larger resource base per person, not a summary of welfare.Canada57.5kUS75.7kEU54.3k

United States records the highest output among these three headline comparators. A larger output measure marks a larger resource base per person, not a summary of welfare.

Scope: among the three headline comparators only, not all EU member states. Not a welfare score: the chart lead moves with the selected metric and its stated rule.

The thread between the bulletins

Connected markets. Unequal dependence.

Same partner, different importance. Each bar measures the destination’s share of the named origin’s goods exports, on a common 0–100% scale.

GDP, population, attainment, territorial CO₂ and mortality: 2024. Matched health and R&D: 2023. Miniatures show the three principal economies on shared axes. The bulletin country is thick; the other two are thin. These KPIs are not combined into a welfare score; the separate proximity instrument declares its own method. Miniatures summarize the linked full figures; their source values and uncertainty remain inspectable there.

The United States, Canada and the European Union change places when the question changes. Thirty-nine exhibits and three linked instruments compare prosperity, institutions, health, learning, defence and AI. Follow the Rank Weave, inspect the Relationship Atlas, then test where Canada fits at the Atlantic Seam.

A Canadian traveler can change a destination much faster than a Canadian factory can change its customers. The earlier aviation story followed a recovery in flying that was changing direction. This comparison asks a larger question: how different are the societies on either side of the Atlantic, and how much freedom do they have to choose another course?

The clearest result appears before we reach any judgment about their institutions. In 2024, US output per person was about 39% above the EU aggregate and 32% above Canada after adjusting for purchasing power. In the matched 2023 health comparison, life expectancy was roughly three years lower in the United States than in either comparator, despite substantially higher health spending per person. Economic resources and lived outcomes describe different orderings.

That reversal is a reason to investigate how prosperity reaches people. It is not a causal estimate of what a government, a health system or a culture contributes. This story keeps the measures separate, carries the same three reference points through the evidence and opens the European aggregate wherever it conceals the important comparison.

There is no overall welfare score. Producing one would require a judgment about how much output compensates for a shorter life, how credentials compare with learning, and how much dependence a society should accept. The extension asks a different question: how similar are the measured profiles? Its weights, normalization and sensitivity remain explicit rather than becoming an identity verdict.

The starting point: Canada is flying again. Just less toward the United States.

Your comparison / one measure at a time

Change the question.
Keep the countries.

Choose a reference, then carry it through the evidence. The units and year change with the measure. There is no hidden overall score.

2024constant 2021 international dollars

CA

Canada

Reference
57,534

Output per person / 2024

The reference stays visible throughout the story.

US

United States

Comparator
75,698

Output per person / 2024

+18,164 constant 2021 international dollars vs. Canada

EU

European Union

Comparator
54,342

Output per person / 2024

−3,192 constant 2021 international dollars vs. Canada

Average production per resident, adjusted for purchasing power and inflation; not median income.

Constant 2021 international dollars. National averages hide distribution and hours worked.

Inspect this measure in context
01

Resources

A large economy is not the same as a prosperous person.

First establish the scale. Then change the denominator.

The European Union has the largest population of the three, the United States the largest economy at market exchange rates, and Canada a much smaller domestic market. These facts matter for procurement, bargaining power, the fixed costs of research and the reach of a national firm. They do not describe the resources available to a typical household.

The EU here always means its current 27 members, excluding the United Kingdom. That statistical perimeter is deliberately fixed. A union of countries is nevertheless not a federation with one treasury, one labor market or one public-service system. Comparable columns are a device for asking questions, not a claim that their institutions are equivalent.

Three places. More than 830 million people.

2024 population / million people · geography identifies the three comparators, not their relative population size

Three places. More than 830 million people.The EU is a union of 27 states, Canada and the United States are federations. Keep that institutional difference in view throughout the comparison. Categorical colors identify Canada, the United States and the fixed EU27 membership. Map area does not encode population. The clipped Atlantic locator uses generalized Natural Earth boundaries; small and offshore territories may be absent. Exact population values are separate from geography.TanzaniaW. SaharaKazakhstanUzbekistanDem. Rep. CongoKenyaSudanChadHaitiDominican Rep.RussiaBahamasNorwayGreenlandMexicoColombiaPanamaCosta RicaNicaraguaHondurasEl SalvadorGuatemalaBelizeVenezuelaEcuadorPuerto RicoJamaicaCubaSenegalMaliMauritaniaBeninNigerNigeriaCameroonTogoGhanaCôte d'IvoireGuineaGuinea-BissauBurkina FasoCentral African Rep.CongoGabonEq. GuineaZambiaAngolaBurundiIsraelLebanonPalestineGambiaTunisiaAlgeriaJordanUnited Arab EmiratesQatarKuwaitIraqOmanIndiaPakistanAfghanistanTajikistanKyrgyzstanTurkmenistanIranSyriaArmeniaBelarusUkraineMoldovaTurkeyAlbaniaSwitzerlandChinaUnited KingdomIcelandAzerbaijanGeorgiaEritreaYemenSaudi ArabiaN. CyprusMoroccoEgyptLibyaEthiopiaDjiboutiSomalilandUgandaRwandaBosnia and Herz.North MacedoniaSerbiaMontenegroKosovoTrinidad and TobagoS. SudanCountry: EU-27; Year: 2024; million people: 450.23EU-27450.23 million peopleGDP: US$19.5tn / 2024Country: Canada; Year: 2024; million people: 41.26Canada41.26 million peopleGDP: US$2.3tn / 2024Country: U.S.; Year: 2024; million people: 340U.S.340 million peopleGDP: US$29.3tn / 2024

Geographic locator. Colored land identifies the three regions; population is stated directly, not encoded by land area or overlaid bubbles.

GDP is nominal market size in current US dollars, not a purchasing-power or welfare measure. Values reuse Exhibit 02; the map’s geography is unchanged.

The EU is a union of 27 states, Canada and the United States are federations. Keep that institutional difference in view throughout the comparison.

Read within this boundary. Categorical colors identify Canada, the United States and the fixed EU27 membership. Map area does not encode population. The clipped Atlantic locator uses generalized Natural Earth boundaries; small and offshore territories may be absent. Exact population values are separate from geography.

Source World Bank WDI · SP.POP.TOTL / Natural Earth · 1:110m country boundaries (public domain)

Source values, definitions & download 3 records

million people. Displayed up to two decimal places; CSV retains the numerical source precision.

Download this exhibit as CSV

One Atlantic. Three very different scales.

2024 · nominal GDP in US$ trillions; area represents output

At market exchange rates, the U.S. economy is larger than the EU economy. Canada is much smaller. Size matters for bargaining power; it says little about the experience of the typical household.

Read within this boundary. Nominal dollars measure market size, not real growth or living standards. Only these three economies are shown.

Source World Bank WDI · NY.GDP.MKTP.CD

Source values, definitions & download 3 records

US$ trillion. Displayed up to two decimal places; CSV retains the numerical source precision.

Download this exhibit as CSV

The purchasing-power comparison changes both the units and the question. In constant 2021 international dollars, output per person in 2024 was approximately $75,698 in the United States, $57,534 in Canada and $54,342 in the EU. These are common purchasing-power units, not dollars that can be exchanged at a bank. The series adjusts for price differences across places and inflation through time.

GDP measures production within an economy. It is not median disposable income, household wealth, the value of unpaid care or leisure. An economy can produce more because workers produce more per hour, because more people work, because they work longer, or through some combination of those margins. The American advantage is real in this measure; the measure cannot tell us who receives it.

The output gap is substantial—and persistent.

2000–2024 · real GDP per person at purchasing power parity

Adjusting for population and local price levels changes the question. U.S. output per person remains substantially higher. GDP is production; it is not median household income, disposable income or a welfare score.

Read within this boundary. Constant 2021 international dollars. National averages hide distribution and hours worked.

Source World Bank WDI · NY.GDP.PCAP.PP.KD

Source values, definitions & download 75 records

international $. Displayed up to two decimal places; CSV retains the numerical source precision.

Download this exhibit as CSV

Recovery looks different once population enters.

2019 = 100 · real GDP per person, 2019–2024

Indexing removes the initial income gap and isolates the recovery path. The scale of an economy and the output available per resident can move in different directions.

Read within this boundary. Each economy has its own 2019 baseline. An index does not compare income levels.

Source World Bank WDI · NY.GDP.PCAP.PP.KD

Source values, definitions & download 18 records

index. Displayed up to two decimal places; CSV retains the numerical source precision.

Download this exhibit as CSV

Levels and growth also answer different questions. Between 2000 and 2024, real output per person rose by about 37.5% in the United States, 35.3% in the EU and 18.9% in Canada. Similar proportional progress can leave a substantial initial level gap in place. Conversely, a high starting level can coexist with a disappointing recent path.

Canada's 2024 output per person was slightly below its 2019 level even though the economy as a whole had expanded. Population belongs in the accounting. This observation does not identify the effect of immigration: it does not tell us what output, investment, participation or productivity would have been under another migration path. Treating an accounting denominator as a causal explanation would skip the central empirical question.

Canada grew. Output per person fell.

2024 · annual change in total real GDP and real GDP per person

Population growth can expand aggregate demand and the economy while reducing output per person in the short run. Canada makes that distinction particularly visible in 2024.

Read within this boundary. Descriptive accounting comparison; it does not estimate the causal effect of migration.

Source World Bank WDI · NY.GDP.MKTP.KD.ZG / World Bank WDI · NY.GDP.PCAP.KD.ZG

Source values, definitions & download 3 records

%. Displayed up to two decimal places; CSV retains the numerical source precision.

Download this exhibit as CSV

“Europe” is not a representative country.

2024 · each dot is one EU member; Canada and U.S. shown for comparison

The EU aggregate combines economies at very different income levels. The small high-income outliers also remind us that GDP can be shaped by cross-border commuting and multinational accounting.

Read within this boundary. Equal-size country dots are not a distribution of people. Ireland and Luxembourg need particular care.

Source World Bank WDI · NY.GDP.PCAP.PP.KD

Source values, definitions & download 29 records

international $. Displayed up to two decimal places; CSV retains the numerical source precision.

Download this exhibit as CSV

The European aggregate needs a second qualification. Member-country output per person ranges from about $34,221 in Bulgaria to $128,475 in Luxembourg. Ireland also lies far above the aggregate. Multinational production and cross-border labor can make territorial output an especially imperfect description of residents' material circumstances.

The distribution is therefore a distribution of countries, with one observation per country. It is not a distribution of European households. The distinction matters: an equal-country view gives a small state the same visual presence as a large one, whereas the aggregate answers a population-level production question.

Carry this forward

Keep three questions separate: how large is the economy, how much does it produce per person, and how has that changed?

02

Public choices

Resources create possibilities. Their allocation matters.

Investment, research, public services and defense are different commitments, not pieces of one additive pie.

Canada devoted a larger share of GDP to fixed investment in 2024 than either the United States or the EU, yet it did not record the strongest recent growth in output per person. A higher investment share is not a sufficient explanation of future prosperity. The next questions concern the assets being created, their utilization, their returns and the capabilities that complement them.

A national investment aggregate includes buildings, equipment and other fixed assets across public and private sectors. Its composition is consequential, but this package does not decompose that composition finely enough to allocate responsibility. The chart establishes the question rather than supplying a housing, technology or infrastructure explanation by assumption.

Investment intensity does not mirror the income ranking.

2000 → 2024 · gross fixed capital formation as a share of GDP

Canada devotes a substantial share of output to fixed investment. That total includes housing and public and private capital; composition, utilization and productivity matter alongside the amount.

Read within this boundary. This is total fixed investment, not government investment or a measure of productive quality.

Source World Bank WDI · NE.GDI.FTOT.ZS

Source values, definitions & download 3 records

% of GDP. Displayed up to two decimal places; CSV retains the numerical source precision.

Download this exhibit as CSV

The U.S. leads in R&D intensity. Canada and the EU switched places.

2000, 2010, 2020, 2023 · rank among these three by R&D expenditure / GDP

Research spending is a forward-looking input, not proof of future commercial success. The rank chart exposes a change in relative position; the exact percentages remain available below.

Read within this boundary. Ranks discard distance. This is a three-economy comparison, not a world ranking; 2023 is the latest common year.

Source World Bank WDI · GB.XPD.RSDV.GD.ZS

Source values, definitions & download 12 records

% of GDP. Displayed up to two decimal places; CSV retains the numerical source precision.

Download this exhibit as CSV

Research and development expenditure gives a more distinct ordering. In the common 2023 observation, the United States devoted 3.45% of GDP to R&D, against 2.26% in the EU and 1.81% in Canada. The rank path shows where the ordering changed; the percentages show how large the differences are. A rank alone cannot do both jobs.

R&D spending is an input into discovery and development, not a count of successful innovations. The benefits can accrue abroad, take years to appear or depend on complementary skills and organizational change. Still, the expenditure difference describes a material choice about how much of today's output is committed to future capabilities.

Canada and the EU devote more to public consumption.

2024 · government final consumption expenditure / GDP

This national-accounts measure captures publicly supplied current services. It provides a narrow comparison of service provision, alongside the separate fiscal evidence on total spending.

Read within this boundary. EXCLUDES cash income transfers and capital formation. It must not be read as total government expenditure.

Source World Bank WDI · NE.CON.GOVT.ZS

Source values, definitions & download 3 records

% of GDP. Displayed up to two decimal places; CSV retains the numerical source precision.

Download this exhibit as CSV

US military expenditure starts from a higher share.

2024 · military expenditure as a share of GDP

The U.S. devotes a larger fraction of output to military expenditure. These are measured spending estimates, distinct from future targets and political announcements.

Read within this boundary. World Bank/SIPRI definition. EU aggregate includes members outside NATO. This is not a NATO target-compliance chart.

Source World Bank WDI · MS.MIL.XPND.GD.ZS

Source values, definitions & download 3 records

% of GDP. Displayed up to two decimal places; CSV retains the numerical source precision.

Download this exhibit as CSV

EU governments spend a larger share of output.

2024 · total general-government expenditure / GDP

EU member governments collectively spend a larger share of output than Canada or the United States. This is a size comparison; composition and outcomes determine what that spending accomplishes.

Read within this boundary. IMF Fiscal Monitor April 2026. EU27 is calculated with IMF nominal-GDP weights across all 27 governments; it is not the budget of EU institutions.

Source IMF Fiscal Monitor · G_X_G01_GDP_PT / IMF WEO nominal GDP used to weight EU27 fiscal ratios / IMF Fiscal Monitor methodological and statistical appendix

Source values, definitions & download 3 records

% of GDP. Displayed up to two decimal places; CSV retains the numerical source precision.

Download this exhibit as CSV

Public-service consumption and total government expenditure must not be treated as synonyms. Government final consumption concerns services produced or purchased for current use. General government expenditure also includes transfers and other uses. The latter reached approximately 49.0% of GDP for the EU comparison, 44.3% in Canada and 37.7% in the United States in 2024.

The EU expenditure ratio is a GDP-weighted calculation across 27 national governments using IMF data. It is not the budget of EU institutions. Neither a high nor a low ratio, by itself, establishes the quality of public services, the distribution of support or the efficiency with which programs operate.

Defense starts from a different allocation again. The historical 2024 military-expenditure shares were 3.42% of GDP in the United States, 1.90% for the EU aggregate and 1.31% in Canada. These are observed expenditure concepts, not measures of readiness, NATO-compliant accounting or forecasts of later commitments. An announcement belongs to a different evidence category.

These measures overlap. Government spending can finance health, education, military activity and investment; R&D can overlap with investment. Adding them into a national spending pie would create double counting precisely where the comparison needs conceptual clarity.

Carry this forward

A spending share identifies a commitment of resources. It does not, without another layer of evidence, identify what that commitment achieved.

03

A longer life

The richest economy does not deliver the longest lives.

The strongest reversal in the comparison is also where causal restraint matters most.

2.32×US health spending per person
relative to the EU / 2023
−3.0yearsUS life expectancy difference
from the EU / the same year

A descriptive reversal,
not an efficiency estimate.
Inspect the joint evidence ↓

In 2023, current health expenditure per person was approximately 13,473 international dollars in the United States, 7,355 in Canada and 5,806 in the EU. Life expectancy in the same year was 78.4, 81.6 and 81.4 years respectively. Matching the year removes one avoidable source of disagreement. It does not make the remaining explanation simple.

The health dollar is a current international dollar at purchasing power parity. The earlier GDP-per-person series uses constant 2021 international dollars. Dividing one by the other would combine incompatible price bases. Likewise, the health-spending trajectory contains price changes and must not be described as real expenditure growth.

More health spending does not guarantee a longer life.

2000 → 2010 → 2019 → 2023 · health spending and life expectancy

The U.S. spends much more per person on health care, yet life expectancy is lower. Health systems, prices, inequality, behavior and external causes of death all contribute; this chart alone cannot allocate responsibility.

Read within this boundary. Spending uses CURRENT international dollars. Its time path includes price changes. This is not a causal frontier or an efficiency estimate. Thin gray context paths show Germany, France, Sweden, Poland and Spain from the same frozen World Bank series. These countries are included in the EU aggregate; they are a selected context set, not an independent control group.

Source World Bank WDI · SH.XPD.CHEX.PP.CD / World Bank WDI · SP.DYN.LE00.IN

Source values, definitions & download 32 records

years. Displayed up to two decimal places; CSV retains the numerical source precision.

Download this exhibit as CSV

The connected observations show the path each society followed; they are not an estimated production frontier. A point further right represents higher measured expenditure. A point further up represents longer period life expectancy. Neither position identifies how much health an additional dollar would buy.

Health outcomes reflect health care alongside income distribution, living conditions, disease burdens, behavior, violence, transport risks and the history of public health. Higher spending can also reflect higher prices. Three aggregate trajectories cannot separate these mechanisms. The defensible result is narrower and important: more output and more health spending do not guarantee longer lives.

Research instrument / follow the same country

The Rank Weave

Output, health spending and lifespan tell different stories. Follow one country through the three rankings, with the year and comparison group held together.

United States / output → spending → lifespan3 → 1 → 22

Spending rank one means the most spent, not the best care.

Canada / the same 29-country comparison11 → 9 → 16

A lead over the EU aggregate does not imply a lead over its individual members.

Reduced motion: step between observed years; automatic playback is off.

CanadaUnited States27 individual EU members
The Rank Weave: resources, spending and lifespan do not preserve the same orderEach thread belongs to one country. Rank one is the largest measured value on each axis. Connections are between different measures, not stages of a causal process or interpolated years.Outputper person2023Health spendper person2023Life expectancyat birth2023United StatesCanadaSame countries / different measures / not a causal chain
The Rank Weave: resources, spending and lifespan do not preserve the same orderEach thread belongs to one country. Rank one is the largest measured value on each axis. Connections are between different measures, not stages of a causal process or interpolated years.Outputper person2023Health spendper person2023Lifespanat birth2023USCASame countries / different measuresNot a causal chain

Canada: ranks 11 → 9 → 16 in 2023. Hover or tap a thread, or select a country above.

Canada / Output per person
58,088constant 2021 international dollars / 2023
Rank 11 of 29
Canada / Health expenditure per person
7,355current international dollars / 2023
Rank 9 of 29
Canada / Life expectancy
81.63years at birth / 2023
Rank 16 of 29
Read all 29 matched country profiles

Rank one is the highest measured level on each axis. Exact ties share a rank. Positions describe 29 selected countries, not the world; the EU aggregate is not counted as a country. Rank gaps are ordinal, not amounts of output or years of life. This comparison does not identify a causal health-system efficiency score.

Longer lives have not followed the output ranking.

2000–2024 · life expectancy at birth

The three trajectories expose a gap that predates the pandemic and a sharp pandemic disruption. These are period life expectancies: summaries of current mortality conditions, not forecasts of a newborn’s eventual lifespan.

Read within this boundary. The EUU aggregate is retained from the source. EU national differences appear separately.

Source World Bank WDI · SP.DYN.LE00.IN

Source values, definitions & download 75 records

years. Displayed up to two decimal places; CSV retains the numerical source precision.

Download this exhibit as CSV

The longevity gap also runs within every society.

2024 · male and female life expectancy at birth

Women live longer on this measure in each of the three economies. Comparing the endpoints makes the within-economy difference visible beside the cross-economy gap.

Read within this boundary. Published male/female series; period life expectancy, not a prediction for individuals.

Source World Bank WDI · SP.DYN.LE00.MA.IN / World Bank WDI · SP.DYN.LE00.FE.IN

Source values, definitions & download 3 records

years. Displayed up to two decimal places; CSV retains the numerical source precision.

Download this exhibit as CSV

Life expectancy at birth is a period statistic. It summarizes how long a hypothetical person would live under the mortality rates measured in that period; it is not a forecast of the life span that a particular newborn will realize. Short-run shocks and their reversal therefore belong in the interpretation.

The difference between women and men adds another level of variation within every comparator. A national average can conceal a substantial gap even before income, place or other social conditions enter the analysis. The figure describes the sex-specific series available in the source. It is not a causal estimate of any one risk factor.

Child mortality fell everywhere. The gap remains.

2000–2024 · deaths before age five per 1,000 live births

The long-run decline is a shared success. The remaining differences are still consequential: low rates are not interchangeable rates when the outcome is a child’s survival.

Read within this boundary. UN inter-agency estimates via World Bank; point estimates, without uncertainty bands in this extract. Lower is better. Thin gray context paths show Germany, France, Sweden, Poland and Spain from the same frozen World Bank series. These countries are included in the EU aggregate; they are a selected context set, not an independent control group.

Source World Bank WDI · SH.DYN.MORT

Source values, definitions & download 200 records

per 1,000. Displayed up to two decimal places; CSV retains the numerical source precision.

Download this exhibit as CSV

Health care is financed through different channels.

2023 · shares of current health expenditure; each bar totals 100%

Public financing, direct household payments and other financing sources form different mixes. A lower out-of-pocket share does not automatically mean a lower household burden when total health expenditure is much higher.

Read within this boundary. Other financing is residual: 100 minus government and out-of-pocket shares. It includes voluntary insurance and other sources; it is not synonymous with insurance.

Source World Bank WDI · SH.XPD.GHED.CH.ZS / World Bank WDI · SH.XPD.OOPC.CH.ZS

Source values, definitions & download 9 records

%. Displayed up to two decimal places; CSV retains the numerical source precision.

Download this exhibit as CSV

Child mortality asks a different, more bounded question. The probability of dying before age five fell across all three comparators, but the gap remains. The 2024 estimates were 6.5 per 1,000 live births in the United States, 5.4 in Canada and 3.86 in the EU. These are official model-based mortality probabilities, not a direct count of deaths in a single birth cohort.

Financing arrangements provide context without resolving the outcome comparison. Government financing, out-of-pocket payments and the residual category sum to current health expenditure. The residual must not simply be renamed private insurance. Nor is an out-of-pocket share a measure of unmet need or the financial burden on a low-income household: its denominator is total expenditure, not household income.

Europe contains several longevity stories.

2024 · EU member states, Canada and the United States

The EU average is useful for comparing scale. It can hide differences large enough to matter for the apparent comparison with North America.

Read within this boundary. Equal-size dots represent country averages, not individual lifespans or population weights.

Source World Bank WDI · SP.DYN.LE00.IN

Source values, definitions & download 29 records

years. Displayed up to two decimal places; CSV retains the numerical source precision.

Download this exhibit as CSV

Europe's position should not become a reassuring curtain. The aggregate sits among member countries with different mortality histories and living conditions. Showing those countries prevents a continental mean from standing in for every resident, while the national scope of the observations prevents us from claiming to have mapped inequality within each country.

A serious health-system comparison would next examine prices, access, preventable and treatable mortality, age structure and the distribution of outcomes. The present evidence is enough to reject the idea that a resource ranking settles the question. It is not enough to award causal credit.

Carry this forward

The spending-outcome reversal is an empirical finding. A league table of health-system efficiency would be a different, unestimated claim.

04

The next generation

A qualification, a test score and an opportunity are different things.

Education changes the comparison again. It also makes the limits of aggregation unusually visible.

Education spending records resources committed to learning. Tertiary attainment records completed qualifications. PISA measures selected skills among tested 15-year-olds. These measures concern different populations, periods and outcomes; one cannot serve as a direct validation of another.

Even the spending comparison has an unusual European denominator. The 2021 WDI EU value is the median of 26 reporting member-country expenditure shares. It is explicitly a member-country median, not the ratio of all EU education expenditure to all EU output. Canada and the United States remain national ratios.

Education budgets are inputs, not attainment.

2021 · government education expenditure / GDP; EU member median

A budget share captures the resources committed to education. It does not reveal instructional quality, the distribution of opportunity, private spending or what students actually learn.

Read within this boundary. EU value is the official median of 26 reporting members, NOT EU expenditure divided by EU GDP. Canada and U.S. are national figures. Public spending only; 2021 is the latest common year.

Source World Bank WDI · SE.XPD.TOTL.GD.ZS

Source values, definitions & download 3 records

% of GDP. Displayed up to two decimal places; CSV retains the numerical source precision.

Download this exhibit as CSV

The education comparison depends on the subject.

PISA 2025 · mean scores for all EU27 members, Canada and the U.S.

Follow the same country across science, reading and mathematics. Canada and the US remain prominent; Germany is the initial EU-country example, and inspection brings any other member into focus. All 87 supplied confidence intervals are retained. No EU mean is invented.

Read within this boundary. Country means with sampling uncertainty. Canada and U.S. carry response/sampling cautions in the report; scores are not a causal school-quality ranking. No invented EU average. Source sampling flags apply to Canada, the United States and the Netherlands. Canada had 77.4% weighted student response against an 80% standard and potential upward student-level bias. The precise US/Netherlands adjudication wording was not independently re-extracted. Unflagged rows are not a comparability certification.

Source OECD PISA 2025 · CMEC official report, tables B.1.2 / B.3.3–5

Source values, definitions & download 87 records

PISA points. Displayed up to two decimal places; CSV retains the numerical source precision. Published standard errors and confidence limits are retained; pointwise intervals are not simultaneous pairwise tests.

Download this exhibit as CSV

The PISA exhibits retain the published 2025 estimates from the official CMEC national report, including its international comparison tables. An independent check matched the official report's edition and numerical tables to the frozen extracts. This is not a new analysis of student records. Published standard errors, confidence limits and source sampling cautions travel with the estimates.

Sampling cautions matter especially for Canada, the United States and the Netherlands. Canada's weighted student response rate was 77.4%, below the 80% standard, and the report identifies potential upward student-level bias. The other two systems retain their source flags; their precise adjudication wording was not independently re-extracted. An unflagged row is not a certificate of perfect comparability.

There is no manufactured EU student mean. An unweighted mean of country scores would answer a different question from a student-weighted estimate, and neither can be substituted silently for the source's country observations. The table shows the European systems themselves alongside Canada and the United States.

The subject matters. Science, reading and mathematics measure related but distinct competencies. The connected subject profiles make those differences visible on one common score scale, with published uncertainty retained. The connecting lines compare subjects, not time or student progress; no pooled European score is constructed.

The same reading mean can conceal different distributions.

PISA 2025 reading · P10–P90 range, inner quartiles and median

Canada and the United States both have a published reading mean of 490. The U.S. distribution stretches further in both directions. A national mean can conceal both stronger top performance and a weaker lower tail.

Read within this boundary. Selected EU members are reference cases, not an EU aggregate. These are student percentile ranges, not confidence intervals. Reported values are rounded; sampling cautions apply to Canada and the U.S.

Source OECD PISA 2025 · CMEC official report, tables B.1.2 / B.3.3–5

Source values, definitions & download 6 records

PISA points. Displayed up to two decimal places; CSV retains the numerical source precision.

Download this exhibit as CSV

European mathematics outcomes span both North American benchmarks.

PISA 2025 · country mean mathematics scores

A country-level distribution gives a more honest European comparison than a fabricated EU score. The pattern also changes when the subject changes from reading to mathematics.

Read within this boundary. Dots are estimated country means; whiskers are published 95% confidence intervals. They are not individual pupils. Canada and U.S. have sampling cautions; differences need not be statistically significant. Source sampling flags apply to Canada, the United States and the Netherlands. Canada had 77.4% weighted student response against an 80% standard and potential upward student-level bias. The precise US/Netherlands adjudication wording was not independently re-extracted. Unflagged rows are not a comparability certification.

Source OECD PISA 2025 · CMEC official report, tables B.1.2 / B.3.3–5

Source values, definitions & download 29 records

PISA points. Displayed up to two decimal places; CSV retains the numerical source precision. Published standard errors and confidence limits are retained; pointwise intervals are not simultaneous pairwise tests.

Download this exhibit as CSV

Canada and the United States both had a reported reading mean of 490 points. Yet the reported distance between the 90th and 10th percentiles was 273 points in Canada and 312 in the United States. Similar averages can accompany different spreads. In the percentile figure, the central mark is the median, not that mean.

The published percentile gap uses underlying values before rounding. Subtracting the displayed rounded endpoints can therefore differ by a point from the reported gap. Both belong in the exact-value record, with their roles kept separate. The central box runs from the 25th to the 75th percentile; the outer interval runs from the 10th to the 90th. Neither is a confidence interval.

The mathematics comparison uses another kind of interval: published uncertainty around a country mean. It does not show the spread of individual students' scores. Pointwise confidence intervals also do not establish simultaneous significance for every pair of countries in a long ranking.

Nothing in these distributions identifies the contribution of family background, school organization or a particular policy. Estimating a new socioeconomic gradient would require student records, plausible values, replicate weights and a suitable design. The education escalator story examines the opportunity question more directly; this comparison establishes why it cannot be settled with the average alone.

Canada leads on higher-education credentials.

2024 · tertiary attainment among adults aged 25–34

Credentials and demonstrated skills answer different questions. Canada has the largest share with tertiary qualifications, including short-cycle degrees. PISA measures a different cohort and a different outcome.

Read within this boundary. Three official national survey sources with broadly aligned degree boundaries. EU: ISCED5–8/private households; Canada: LFS, excluding territories; U.S.: associate degree or higher/civilian noninstitutionalized. Canada published to whole percentages. Adapted from Statistics Canada. This does not constitute an endorsement by Statistics Canada of this product.

Source Eurostat EDAT_LFSE_03 / Statistics Canada Table37-10-0130-01; Labour Force Survey / US Census Bureau CPS2024 Table1; calculation from age25–29 and30–34 counts

Source values, definitions & download 3 records

%. Displayed up to two decimal places; CSV retains the numerical source precision.

Download this exhibit as CSV

Credentials produce another ordering. Tertiary attainment among people aged 25-34 was 69% in Canada, 52.7% in the United States and 43.9% in the EU in 2024. These figures include short-cycle qualifications as well as degrees. National survey populations and coverage are not perfectly identical, and Canada's published whole-percentage precision should remain visible.

The people in this attainment comparison are not the 15-year-olds in the PISA assessment. Migration, completion, cohort replacement and the structure of qualifications can all affect attainment. A high credential share does not replicate a test-score comparison, just as a score distribution cannot be read as a distribution of adult earnings.

Continue the opportunity question: The Education Escalator.

Carry this forward

Keep the input, the credential, the demonstrated skill and the distribution of opportunity in separate analytical columns.

05

Future constraints

The next decade starts from different constraints.

Age structure, fertility and territorial emissions qualify the national success stories without determining their futures.

People aged 65 and over represented approximately 22.0% of the EU population, 19.8% of Canada's and 17.9% of the US population in 2024. These age structures matter when interpreting employment rates, health demand and fiscal pressures. A comparison that ignores them can attribute a compositional difference to institutional performance.

Age structure is not destiny. Participation, migration, productivity, health and the design of institutions change the consequences of aging. Nor does a fertility rate supply a population forecast on its own. Cohort size, mortality and migration remain part of the demographic arithmetic.

Europe is further into population ageing.

2000 → 2024 · population aged 65 and over

The 2024 population composition is shown on a common 100-unit field. Colored cells represent the share aged 65 and over; the neutral remainder is under 65. The 2000 share and the change remain visible alongside the composition.

Read within this boundary. Share of population, not a fiscal dependency ratio. Each cell represents one percentage point, not one observed person. Fractional cells retain the underlying share. Under 65 is calculated as 100 minus the age-65-plus share; no finer age bands are inferred.

Source World Bank WDI · SP.POP.65UP.TO.ZS

Source values, definitions & download 3 records

%. Displayed up to two decimal places; CSV retains the numerical source precision.

Download this exhibit as CSV

Low fertility is a shared constraint.

2000–2024 · births per woman

The demographic challenge crosses the Atlantic. Fertility, migration and longevity jointly determine population change; the chart isolates just one component.

Read within this boundary. Period total fertility rate. The 2.1 reference is a conventional approximate replacement benchmark, not a universal threshold.

Source World Bank WDI · SP.DYN.TFRT.IN

Source values, definitions & download 75 records

births per woman. Displayed up to two decimal places; CSV retains the numerical source precision.

Download this exhibit as CSV

The approximate replacement benchmark in the fertility chart is a demographic reference, not a policy target or a guarantee of population stability. It concerns a long-run reproduction concept under assumptions, whereas the plotted total fertility rate is a period measure. The distinction prevents a useful reference line from becoming an explanation of the next year's population change.

Environmental comparisons require an equally explicit perimeter. Territorial emissions are attributed to where production occurs. Consumption-based measures also account for emissions embodied in trade. A reduction in domestic emissions cannot, on its own, establish an equal reduction in the footprint of everything residents consume.

Territorial carbon footprints remain far apart.

2000–2024 · CO₂ emissions per person, excluding land-use change

The EU emits substantially less CO₂ per person than either North American economy. Energy mix, industrial structure, transport, climate and consumption patterns all matter.

Read within this boundary. Territorial CO₂; excludes land-use change and does not reassign emissions embedded in imports. This is not a consumption footprint.

Source World Bank WDI · EN.GHG.CO2.PC.CE.AR5

Source values, definitions & download 75 records

tonnes per person. Displayed up to two decimal places; CSV retains the numerical source precision.

Download this exhibit as CSV

Output can rise while domestic emissions fall.

2000 → 2010 → 2019 → 2024 · output per person and territorial CO₂ per person

Moving right and down means greater real output per resident alongside a smaller territorial carbon footprint. It is evidence of this particular decoupling measure, not proof that all environmental pressures have fallen.

Read within this boundary. Real GDP in constant 2021 international dollars; territorial CO₂ excludes emissions embodied in imports.

Source World Bank WDI · NY.GDP.PCAP.PP.KD / World Bank WDI · EN.GHG.CO2.PC.CE.AR5

Source values, definitions & download 12 records

tonnes per person. Displayed up to two decimal places; CSV retains the numerical source precision.

Download this exhibit as CSV

The carbon series measures territorial carbon dioxide per person, excluding land-use change. It is not a measure of every greenhouse gas, a consumption footprint or a comprehensive environmental score. Per-person figures make differently sized economies more comparable, but they still leave production structure, energy systems and climate outside the explanation.

The connected output-emissions chart preserves both observed coordinates. Movement toward more output and fewer domestic emissions is visible where it occurs. It does not identify how much resulted from technology, energy substitution, structural change or activity moving abroad. Calling the path a fitted decoupling frontier would add a model that has not been estimated.

These qualifications do not make the descriptive progress meaningless. They identify the boundary within which it is true, and the additional evidence required before extending the conclusion to consumption, global emissions or a particular policy.

Carry this forward

A constraint changes the question policy must answer. It does not supply a forecast or assign responsibility by itself.

06

Bound together

A relationship can be large for both sides, and indispensable to only one.

Return to Canada. This time the denominator is the export book.

In the consistent 2025 goods-trade snapshot, 72.5% of Canada's merchandise exports went to the United States. Canada accounted for 15.4% of US merchandise exports. The same commercial relationship therefore occupies very different positions in the two economies.

The directional chord separates exports in one direction from exports in the other. Ribbon color identifies the exporter, the arrowhead the destination, and width the value in current euro billions. Region arcs reflect the displayed incoming and outgoing links, not shares of world trade. Domestic trade, services and investment are outside this view.

The Atlantic is an economic relationship, not just a comparison.

2025 · exporter-reported bilateral goods exports, € billions

Follow exporter-colored ribbons toward their arrowheads. The six widths represent directional goods exports within the Atlantic triangle, not bilateral balances or total world exports.

Read within this boundary. DG Trade factsheets combine Eurostat EU reporting and IMF partner reporting in a common currency. Reporter differences are material; the audit chart below makes them visible. Region arcs combine the incoming and outgoing links displayed here. They are not market shares. Services, investment and domestic trade are outside the diagram.

Source European Commission DG Trade · 2025 goods flows / European Commission DG Trade · 2025 goods flows

Source values, definitions & download 6 records

€ bn. Displayed up to two decimal places; CSV retains the numerical source precision.

Download this exhibit as CSV

Canada’s dependence on the U.S. is in a different league.

2025 · goods exports, € billions; shares available on inspection

Canada sends roughly 72% of its goods exports to the United States. For the EU and the U.S., the corresponding bilateral shares are far smaller. A trading relationship can be large in absolute terms and asymmetric in dependence.

Read within this boundary. Widths represent money, not shares. EU excludes intra-EU trade. Rest of world is the observed residual from exporter totals.

Source European Commission DG Trade · 2025 goods flows / European Commission DG Trade · 2025 goods flows

Source values, definitions & download 9 records

€ bn. Displayed up to two decimal places; CSV retains the numerical source precision.

Download this exhibit as CSV

Volumes and shares do different work. The flow widths retain one common monetary scale, so the small Canadian export system is not silently enlarged to match the others. The printed shares then identify how concentrated each export book is. A large volume describes commercial scale; a large share describes exposure to a destination.

The EU denominator is extra-EU merchandise exports. Trade among members is excluded because the question concerns the bloc's external relationships. US-bound goods represented 21.0% of that extra-EU total. Canada's EU-bound goods represented 5.5% of Canadian exports. Neither percentage includes services or investment.

Concentration is not a direct estimate of the cost of a trade restriction. Substitution possibilities, sector composition, contracts, logistics and the value added retained at home all matter. The aggregate export book identifies an exposure; it does not tell us how quickly a factory can replace a customer.

A shipment can have two official statistical values.

2025 · exporter records and the partner’s import records, € billions

Trade records differ because of valuation, timing, origin rules, re-exports and statistical systems. The disagreement is a feature of the evidence that deserves to be seen, especially when it is large.

Read within this boundary. These are mirror comparisons, not trade balances or error bars. A discrepancy does not establish misconduct.

Source European Commission DG Trade · 2025 goods flows / European Commission DG Trade · 2025 goods flows

Source values, definitions & download 6 records

€ bn. Displayed up to two decimal places; CSV retains the numerical source precision.

Download this exhibit as CSV

Even the value of a single trade direction depends on a reporting perspective. Exporter and importer records can disagree because of valuation, transit, re-exports, partner attribution, timing and revision. The main view keeps exporter reports. The mirror comparison shows the alternative records rather than averaging them into a number that no statistical agency reported.

The common European Commission factsheet snapshot is dated May 20, 2026 and concerns goods trade in 2025. Later revisions may differ. A mirror gap is not a trade balance, an uncertainty interval or evidence of misconduct; it is a reason to keep the reporter and the statistical definition visible.

Carry this forward

Changing a holiday destination and changing a production system are different kinds of adjustment. The evidence should say which one it describes.

Research extension / Canada as the persistent specimen

Where does Canada fit?

Institutions, defence, economic structure and AI widen the comparison. A transparent proximity model then tests the temptation to put Canada neatly into one camp.

The preceding comparison deliberately refuses an overall welfare ranking. That refusal does not prevent a different question: which measured profile resembles Canada's? Similarity requires no claim that more spending, a larger state or a lower fertility rate is better. It requires definitions, a reference group, a scale and weights that the reader can inspect.

The result is a near tie. Under the declared baseline, Canada is slightly closer to a constructed typical-EU-member profile than to the United States. That distinction changes under reasonable analytical choices. The useful finding is not a European identity score; it is the pattern of similarities and differences that a continental label conceals.

The extension uses 29 indicators across eight domains and the same 29 sovereign countries: Canada, the United States and the current EU27 members. AI adoption is investigated but excluded from the score because the available national surveys do not measure a common construct. Absolute population and GDP are also excluded so that geographical size cannot dominate resemblance.

07

The extended comparison

Institutions are more than a democracy label.

A coarse regime category, perceived administrative quality and a recent institutional change answer different questions.

Polity is a reasonable starting point for thinking about political regimes. It is a poor shortcut to a current, finely graded comparison of these societies. The canonical Polity project advertises a common panel through 2018. Inspecting the actual workbook also reveals USA-only observations for 2019 and 2020, rather than a later common-country update. Malta is absent, and 20 of the 28 observed countries in the requested 2018 comparison receive the maximum score.

Canada's 2018 polity2 value is +10 and the US value +8. Those numbers describe a dated, coarse classification. They do not establish the institutional situation in 2024 or 2025. Revision flags matter too: the workbook contains both completed Polity5 revisions and retained PolityIV observations. Extending a country-specific revision into a whole-panel claim would create artificial comparability.

The current baseline instead uses the World Bank's revised Worldwide Governance Indicators. Its six dimensions distinguish voice and accountability, political stability, government effectiveness, regulatory quality, rule of law and control of corruption. The 2025 methodology revision recalculates the historical series and provides both statistical-unit estimates and absolute 0-100 scores. An absolute score is not a percentile rank.

The score uses the six source estimates within one institutional domain. The graphic uses the published absolute scores and their 90% intervals for readability. They are alternative representations of the same source, not twelve independent pieces of evidence. The EU median is a constructed member-country reference; no sovereign EU regime or EU confidence interval is invented.

30

Six institutional questions give more information than one regime label.

WGI 2024 / 2025 methodology revision / absolute scores, 0–100 / published 90% intervals

↗
CanadaUnited StatesEU members
Six dimensions of institutions, not one democracy label0255075100Voice and accountabilityAustria / Voice and accountability, 2024: 81.45. Absolute score, 0-100; published 90% interval 76.71-86.18. Not a percentile rank.Belgium / Voice and accountability, 2024: 83.05. Absolute score, 0-100; published 90% interval 78.32-87.79. Not a percentile rank.Bulgaria / Voice and accountability, 2024: 60.58. Absolute score, 0-100; published 90% interval 56.23-64.94. Not a percentile rank.Croatia / Voice and accountability, 2024: 68.20. Absolute score, 0-100; published 90% interval 63.85-72.55. Not a percentile rank.Cyprus / Voice and accountability, 2024: 72.38. Absolute score, 0-100; published 90% interval 67.65-77.11. Not a percentile rank.Czechia / Voice and accountability, 2024: 78.81. Absolute score, 0-100; published 90% interval 74.46-83.16. Not a percentile rank.Denmark / Voice and accountability, 2024: 90.02. Absolute score, 0-100; published 90% interval 85.28-94.75. Not a percentile rank.Estonia / Voice and accountability, 2024: 81.61. Absolute score, 0-100; published 90% interval 77.21-86.00. Not a percentile rank.Finland / Voice and accountability, 2024: 89.29. Absolute score, 0-100; published 90% interval 84.56-94.03. Not a percentile rank.France / Voice and accountability, 2024: 76.95. Absolute score, 0-100; published 90% interval 72.27-81.63. Not a percentile rank.Germany / Voice and accountability, 2024: 84.82. Absolute score, 0-100; published 90% interval 80.14-89.50. Not a percentile rank.Greece / Voice and accountability, 2024: 70.53. Absolute score, 0-100; published 90% interval 65.80-75.27. Not a percentile rank.Hungary / Voice and accountability, 2024: 56.36. Absolute score, 0-100; published 90% interval 52.01-60.72. Not a percentile rank.Ireland / Voice and accountability, 2024: 85.51. Absolute score, 0-100; published 90% interval 80.78-90.25. Not a percentile rank.Italy / Voice and accountability, 2024: 75.53. Absolute score, 0-100; published 90% interval 70.85-80.21. Not a percentile rank.Latvia / Voice and accountability, 2024: 76.59. Absolute score, 0-100; published 90% interval 72.20-80.99. Not a percentile rank.Lithuania / Voice and accountability, 2024: 78.25. Absolute score, 0-100; published 90% interval 73.85-82.64. Not a percentile rank.Luxembourg / Voice and accountability, 2024: 86.00. Absolute score, 0-100; published 90% interval 81.26-90.73. Not a percentile rank.Malta / Voice and accountability, 2024: 72.98. Absolute score, 0-100; published 90% interval 68.23-77.73. Not a percentile rank.Netherlands / Voice and accountability, 2024: 85.79. Absolute score, 0-100; published 90% interval 81.06-90.53. Not a percentile rank.Poland / Voice and accountability, 2024: 70.01. Absolute score, 0-100; published 90% interval 65.66-74.37. Not a percentile rank.Portugal / Voice and accountability, 2024: 78.99. Absolute score, 0-100; published 90% interval 74.31-83.67. Not a percentile rank.Romania / Voice and accountability, 2024: 63.63. Absolute score, 0-100; published 90% interval 59.28-67.98. Not a percentile rank.Slovak Republic / Voice and accountability, 2024: 73.13. Absolute score, 0-100; published 90% interval 68.78-77.48. Not a percentile rank.Slovenia / Voice and accountability, 2024: 75.35. Absolute score, 0-100; published 90% interval 71.00-79.70. Not a percentile rank.Spain / Voice and accountability, 2024: 76.95. Absolute score, 0-100; published 90% interval 72.27-81.63. Not a percentile rank.Sweden / Voice and accountability, 2024: 87.09. Absolute score, 0-100; published 90% interval 82.41-91.77. Not a percentile rank.Canada / Voice and accountability, 2024: 83.17. Absolute score, 0-100; published 90% interval 78.28-88.05. Not a percentile rank.United States / Voice and accountability, 2024: 72.37. Absolute score, 0-100; published 90% interval 67.65-77.09. Not a percentile rank.Political stabilityAustria / Political stability, 2024: 74.29. Absolute score, 0-100; published 90% interval 67.50-81.08. Not a percentile rank.Belgium / Political stability, 2024: 67.97. Absolute score, 0-100; published 90% interval 61.18-74.76. Not a percentile rank.Bulgaria / Political stability, 2024: 66.58. Absolute score, 0-100; published 90% interval 59.91-73.24. Not a percentile rank.Croatia / Political stability, 2024: 75.83. Absolute score, 0-100; published 90% interval 69.16-82.49. Not a percentile rank.Cyprus / Political stability, 2024: 72.49. Absolute score, 0-100; published 90% interval 65.57-79.40. Not a percentile rank.Czechia / Political stability, 2024: 82.50. Absolute score, 0-100; published 90% interval 75.83-89.16. Not a percentile rank.Denmark / Political stability, 2024: 79.03. Absolute score, 0-100; published 90% interval 72.19-85.87. Not a percentile rank.Estonia / Political stability, 2024: 77.84. Absolute score, 0-100; published 90% interval 71.18-84.51. Not a percentile rank.Finland / Political stability, 2024: 80.12. Absolute score, 0-100; published 90% interval 73.28-86.96. Not a percentile rank.France / Political stability, 2024: 61.77. Absolute score, 0-100; published 90% interval 54.98-68.56. Not a percentile rank.Germany / Political stability, 2024: 68.02. Absolute score, 0-100; published 90% interval 61.23-74.81. Not a percentile rank.Greece / Political stability, 2024: 68.28. Absolute score, 0-100; published 90% interval 61.48-75.07. Not a percentile rank.Hungary / Political stability, 2024: 73.35. Absolute score, 0-100; published 90% interval 66.68-80.01. Not a percentile rank.Ireland / Political stability, 2024: 78.02. Absolute score, 0-100; published 90% interval 71.23-84.81. Not a percentile rank.Italy / Political stability, 2024: 71.17. Absolute score, 0-100; published 90% interval 64.38-77.96. Not a percentile rank.Latvia / Political stability, 2024: 76.49. Absolute score, 0-100; published 90% interval 69.82-83.15. Not a percentile rank.Lithuania / Political stability, 2024: 81.94. Absolute score, 0-100; published 90% interval 75.23-88.65. Not a percentile rank.Luxembourg / Political stability, 2024: 84.22. Absolute score, 0-100; published 90% interval 77.38-91.06. Not a percentile rank.Malta / Political stability, 2024: 79.64. Absolute score, 0-100; published 90% interval 72.69-86.60. Not a percentile rank.Netherlands / Political stability, 2024: 73.21. Absolute score, 0-100; published 90% interval 66.37-80.05. Not a percentile rank.Poland / Political stability, 2024: 74.41. Absolute score, 0-100; published 90% interval 67.75-81.08. Not a percentile rank.Portugal / Political stability, 2024: 75.07. Absolute score, 0-100; published 90% interval 68.27-81.86. Not a percentile rank.Romania / Political stability, 2024: 68.61. Absolute score, 0-100; published 90% interval 61.94-75.27. Not a percentile rank.Slovak Republic / Political stability, 2024: 76.73. Absolute score, 0-100; published 90% interval 69.95-83.51. Not a percentile rank.Slovenia / Political stability, 2024: 78.21. Absolute score, 0-100; published 90% interval 71.54-84.87. Not a percentile rank.Spain / Political stability, 2024: 65.84. Absolute score, 0-100; published 90% interval 59.05-72.63. Not a percentile rank.Sweden / Political stability, 2024: 76.20. Absolute score, 0-100; published 90% interval 69.41-82.99. Not a percentile rank.Canada / Political stability, 2024: 76.12. Absolute score, 0-100; published 90% interval 69.33-82.91. Not a percentile rank.United States / Political stability, 2024: 64.27. Absolute score, 0-100; published 90% interval 57.94-70.60. Not a percentile rank.Government effectivenessAustria / Government effectiveness, 2024: 80.79. Absolute score, 0-100; published 90% interval 73.69-87.89. Not a percentile rank.Belgium / Government effectiveness, 2024: 74.57. Absolute score, 0-100; published 90% interval 67.47-81.67. Not a percentile rank.Bulgaria / Government effectiveness, 2024: 52.17. Absolute score, 0-100; published 90% interval 45.40-58.95. Not a percentile rank.Croatia / Government effectiveness, 2024: 65.14. Absolute score, 0-100; published 90% interval 58.37-71.92. Not a percentile rank.Cyprus / Government effectiveness, 2024: 68.25. Absolute score, 0-100; published 90% interval 61.15-75.35. Not a percentile rank.Czechia / Government effectiveness, 2024: 74.23. Absolute score, 0-100; published 90% interval 67.46-81.01. Not a percentile rank.Denmark / Government effectiveness, 2024: 88.53. Absolute score, 0-100; published 90% interval 81.40-95.67. Not a percentile rank.Estonia / Government effectiveness, 2024: 76.56. Absolute score, 0-100; published 90% interval 69.78-83.33. Not a percentile rank.Finland / Government effectiveness, 2024: 86.67. Absolute score, 0-100; published 90% interval 79.54-93.81. Not a percentile rank.France / Government effectiveness, 2024: 74.69. Absolute score, 0-100; published 90% interval 67.59-81.79. Not a percentile rank.Germany / Government effectiveness, 2024: 81.41. Absolute score, 0-100; published 90% interval 74.31-88.51. Not a percentile rank.Greece / Government effectiveness, 2024: 55.06. Absolute score, 0-100; published 90% interval 47.96-62.16. Not a percentile rank.Hungary / Government effectiveness, 2024: 61.10. Absolute score, 0-100; published 90% interval 54.32-67.87. Not a percentile rank.Ireland / Government effectiveness, 2024: 82.68. Absolute score, 0-100; published 90% interval 75.58-89.77. Not a percentile rank.Italy / Government effectiveness, 2024: 66.75. Absolute score, 0-100; published 90% interval 59.65-73.85. Not a percentile rank.Latvia / Government effectiveness, 2024: 65.79. Absolute score, 0-100; published 90% interval 59.02-72.57. Not a percentile rank.Lithuania / Government effectiveness, 2024: 74.70. Absolute score, 0-100; published 90% interval 67.90-81.51. Not a percentile rank.Luxembourg / Government effectiveness, 2024: 91.00. Absolute score, 0-100; published 90% interval 83.86-98.14. Not a percentile rank.Malta / Government effectiveness, 2024: 63.44. Absolute score, 0-100; published 90% interval 55.92-70.97. Not a percentile rank.Netherlands / Government effectiveness, 2024: 85.41. Absolute score, 0-100; published 90% interval 78.27-92.54. Not a percentile rank.Poland / Government effectiveness, 2024: 64.43. Absolute score, 0-100; published 90% interval 57.66-71.21. Not a percentile rank.Portugal / Government effectiveness, 2024: 69.76. Absolute score, 0-100; published 90% interval 62.66-76.86. Not a percentile rank.Romania / Government effectiveness, 2024: 59.47. Absolute score, 0-100; published 90% interval 52.70-66.25. Not a percentile rank.Slovak Republic / Government effectiveness, 2024: 64.13. Absolute score, 0-100; published 90% interval 57.35-70.90. Not a percentile rank.Slovenia / Government effectiveness, 2024: 72.52. Absolute score, 0-100; published 90% interval 65.75-79.30. Not a percentile rank.Spain / Government effectiveness, 2024: 72.94. Absolute score, 0-100; published 90% interval 65.84-80.04. Not a percentile rank.Sweden / Government effectiveness, 2024: 85.85. Absolute score, 0-100; published 90% interval 78.75-92.95. Not a percentile rank.Canada / Government effectiveness, 2024: 85.54. Absolute score, 0-100; published 90% interval 78.01-93.08. Not a percentile rank.United States / Government effectiveness, 2024: 77.78. Absolute score, 0-100; published 90% interval 70.25-85.32. Not a percentile rank.Regulatory qualityAustria / Regulatory quality, 2024: 76.17. Absolute score, 0-100; published 90% interval 70.58-81.76. Not a percentile rank.Belgium / Regulatory quality, 2024: 74.48. Absolute score, 0-100; published 90% interval 68.89-80.06. Not a percentile rank.Bulgaria / Regulatory quality, 2024: 59.41. Absolute score, 0-100; published 90% interval 54.33-64.48. Not a percentile rank.Croatia / Regulatory quality, 2024: 59.37. Absolute score, 0-100; published 90% interval 54.30-64.44. Not a percentile rank.Cyprus / Regulatory quality, 2024: 66.53. Absolute score, 0-100; published 90% interval 60.94-72.11. Not a percentile rank.Czechia / Regulatory quality, 2024: 74.29. Absolute score, 0-100; published 90% interval 69.22-79.36. Not a percentile rank.Denmark / Regulatory quality, 2024: 85.31. Absolute score, 0-100; published 90% interval 79.72-90.91. Not a percentile rank.Estonia / Regulatory quality, 2024: 76.91. Absolute score, 0-100; published 90% interval 71.84-81.98. Not a percentile rank.Finland / Regulatory quality, 2024: 85.83. Absolute score, 0-100; published 90% interval 80.23-91.43. Not a percentile rank.France / Regulatory quality, 2024: 72.94. Absolute score, 0-100; published 90% interval 67.35-78.53. Not a percentile rank.Germany / Regulatory quality, 2024: 78.49. Absolute score, 0-100; published 90% interval 72.90-84.08. Not a percentile rank.Greece / Regulatory quality, 2024: 62.43. Absolute score, 0-100; published 90% interval 56.84-68.01. Not a percentile rank.Hungary / Regulatory quality, 2024: 60.15. Absolute score, 0-100; published 90% interval 55.08-65.22. Not a percentile rank.Ireland / Regulatory quality, 2024: 83.16. Absolute score, 0-100; published 90% interval 77.58-88.75. Not a percentile rank.Italy / Regulatory quality, 2024: 64.96. Absolute score, 0-100; published 90% interval 59.37-70.55. Not a percentile rank.Latvia / Regulatory quality, 2024: 72.21. Absolute score, 0-100; published 90% interval 67.14-77.28. Not a percentile rank.Lithuania / Regulatory quality, 2024: 75.23. Absolute score, 0-100; published 90% interval 70.16-80.31. Not a percentile rank.Luxembourg / Regulatory quality, 2024: 83.86. Absolute score, 0-100; published 90% interval 78.27-89.46. Not a percentile rank.Malta / Regulatory quality, 2024: 62.62. Absolute score, 0-100; published 90% interval 56.61-68.63. Not a percentile rank.Netherlands / Regulatory quality, 2024: 82.02. Absolute score, 0-100; published 90% interval 76.42-87.61. Not a percentile rank.Poland / Regulatory quality, 2024: 65.68. Absolute score, 0-100; published 90% interval 60.61-70.75. Not a percentile rank.Portugal / Regulatory quality, 2024: 66.54. Absolute score, 0-100; published 90% interval 60.95-72.12. Not a percentile rank.Romania / Regulatory quality, 2024: 60.91. Absolute score, 0-100; published 90% interval 55.84-65.98. Not a percentile rank.Slovak Republic / Regulatory quality, 2024: 61.25. Absolute score, 0-100; published 90% interval 56.17-66.32. Not a percentile rank.Slovenia / Regulatory quality, 2024: 67.45. Absolute score, 0-100; published 90% interval 62.38-72.52. Not a percentile rank.Spain / Regulatory quality, 2024: 64.65. Absolute score, 0-100; published 90% interval 59.07-70.24. Not a percentile rank.Sweden / Regulatory quality, 2024: 81.23. Absolute score, 0-100; published 90% interval 75.64-86.82. Not a percentile rank.Canada / Regulatory quality, 2024: 76.35. Absolute score, 0-100; published 90% interval 70.76-81.93. Not a percentile rank.United States / Regulatory quality, 2024: 76.19. Absolute score, 0-100; published 90% interval 70.61-81.78. Not a percentile rank.Rule of lawAustria / Rule of law, 2024: 85.84. Absolute score, 0-100; published 90% interval 81.64-90.04. Not a percentile rank.Belgium / Rule of law, 2024: 79.04. Absolute score, 0-100; published 90% interval 74.85-83.24. Not a percentile rank.Bulgaria / Rule of law, 2024: 56.39. Absolute score, 0-100; published 90% interval 52.30-60.48. Not a percentile rank.Croatia / Rule of law, 2024: 63.46. Absolute score, 0-100; published 90% interval 59.37-67.55. Not a percentile rank.Cyprus / Rule of law, 2024: 68.83. Absolute score, 0-100; published 90% interval 64.63-73.02. Not a percentile rank.Czechia / Rule of law, 2024: 77.41. Absolute score, 0-100; published 90% interval 73.33-81.50. Not a percentile rank.Denmark / Rule of law, 2024: 91.46. Absolute score, 0-100; published 90% interval 87.24-95.68. Not a percentile rank.Estonia / Rule of law, 2024: 82.55. Absolute score, 0-100; published 90% interval 78.46-86.64. Not a percentile rank.Finland / Rule of law, 2024: 91.75. Absolute score, 0-100; published 90% interval 87.54-95.97. Not a percentile rank.France / Rule of law, 2024: 73.81. Absolute score, 0-100; published 90% interval 69.61-78.00. Not a percentile rank.Germany / Rule of law, 2024: 84.95. Absolute score, 0-100; published 90% interval 80.75-89.14. Not a percentile rank.Greece / Rule of law, 2024: 62.10. Absolute score, 0-100; published 90% interval 57.90-66.29. Not a percentile rank.Hungary / Rule of law, 2024: 60.27. Absolute score, 0-100; published 90% interval 56.19-64.36. Not a percentile rank.Ireland / Rule of law, 2024: 84.35. Absolute score, 0-100; published 90% interval 80.16-88.55. Not a percentile rank.Italy / Rule of law, 2024: 67.62. Absolute score, 0-100; published 90% interval 63.43-71.82. Not a percentile rank.Latvia / Rule of law, 2024: 75.75. Absolute score, 0-100; published 90% interval 71.66-79.84. Not a percentile rank.Lithuania / Rule of law, 2024: 80.62. Absolute score, 0-100; published 90% interval 76.51-84.72. Not a percentile rank.Luxembourg / Rule of law, 2024: 87.29. Absolute score, 0-100; published 90% interval 83.07-91.50. Not a percentile rank.Malta / Rule of law, 2024: 69.48. Absolute score, 0-100; published 90% interval 65.13-73.83. Not a percentile rank.Netherlands / Rule of law, 2024: 86.34. Absolute score, 0-100; published 90% interval 82.13-90.56. Not a percentile rank.Poland / Rule of law, 2024: 66.89. Absolute score, 0-100; published 90% interval 62.81-70.98. Not a percentile rank.Portugal / Rule of law, 2024: 75.42. Absolute score, 0-100; published 90% interval 71.22-79.61. Not a percentile rank.Romania / Rule of law, 2024: 63.35. Absolute score, 0-100; published 90% interval 59.26-67.44. Not a percentile rank.Slovak Republic / Rule of law, 2024: 66.62. Absolute score, 0-100; published 90% interval 62.53-70.71. Not a percentile rank.Slovenia / Rule of law, 2024: 73.81. Absolute score, 0-100; published 90% interval 69.72-77.90. Not a percentile rank.Spain / Rule of law, 2024: 73.00. Absolute score, 0-100; published 90% interval 68.81-77.20. Not a percentile rank.Sweden / Rule of law, 2024: 86.68. Absolute score, 0-100; published 90% interval 82.49-90.88. Not a percentile rank.Canada / Rule of law, 2024: 82.11. Absolute score, 0-100; published 90% interval 77.78-86.44. Not a percentile rank.United States / Rule of law, 2024: 73.52. Absolute score, 0-100; published 90% interval 69.25-77.78. Not a percentile rank.Control of corruptionAustria / Control of corruption, 2024: 74.06. Absolute score, 0-100; published 90% interval 68.72-79.39. Not a percentile rank.Belgium / Control of corruption, 2024: 77.59. Absolute score, 0-100; published 90% interval 72.25-82.92. Not a percentile rank.Bulgaria / Control of corruption, 2024: 43.00. Absolute score, 0-100; published 90% interval 37.96-48.03. Not a percentile rank.Croatia / Control of corruption, 2024: 50.86. Absolute score, 0-100; published 90% interval 45.83-55.90. Not a percentile rank.Cyprus / Control of corruption, 2024: 58.63. Absolute score, 0-100; published 90% interval 53.30-63.97. Not a percentile rank.Czechia / Control of corruption, 2024: 66.70. Absolute score, 0-100; published 90% interval 61.67-71.74. Not a percentile rank.Denmark / Control of corruption, 2024: 94.16. Absolute score, 0-100; published 90% interval 88.78-99.54. Not a percentile rank.Estonia / Control of corruption, 2024: 81.64. Absolute score, 0-100; published 90% interval 76.61-86.68. Not a percentile rank.Finland / Control of corruption, 2024: 92.23. Absolute score, 0-100; published 90% interval 86.85-97.60. Not a percentile rank.France / Control of corruption, 2024: 72.51. Absolute score, 0-100; published 90% interval 67.18-77.85. Not a percentile rank.Germany / Control of corruption, 2024: 83.75. Absolute score, 0-100; published 90% interval 78.42-89.09. Not a percentile rank.Greece / Control of corruption, 2024: 53.92. Absolute score, 0-100; published 90% interval 48.58-59.26. Not a percentile rank.Hungary / Control of corruption, 2024: 48.65. Absolute score, 0-100; published 90% interval 43.62-53.69. Not a percentile rank.Ireland / Control of corruption, 2024: 79.69. Absolute score, 0-100; published 90% interval 74.35-85.02. Not a percentile rank.Italy / Control of corruption, 2024: 59.05. Absolute score, 0-100; published 90% interval 53.72-64.39. Not a percentile rank.Latvia / Control of corruption, 2024: 64.56. Absolute score, 0-100; published 90% interval 59.52-69.59. Not a percentile rank.Lithuania / Control of corruption, 2024: 67.95. Absolute score, 0-100; published 90% interval 62.88-73.02. Not a percentile rank.Luxembourg / Control of corruption, 2024: 88.66. Absolute score, 0-100; published 90% interval 83.28-94.04. Not a percentile rank.Malta / Control of corruption, 2024: 53.26. Absolute score, 0-100; published 90% interval 47.63-58.88. Not a percentile rank.Netherlands / Control of corruption, 2024: 86.52. Absolute score, 0-100; published 90% interval 81.14-91.90. Not a percentile rank.Poland / Control of corruption, 2024: 63.93. Absolute score, 0-100; published 90% interval 58.89-68.96. Not a percentile rank.Portugal / Control of corruption, 2024: 64.54. Absolute score, 0-100; published 90% interval 59.20-69.87. Not a percentile rank.Romania / Control of corruption, 2024: 48.38. Absolute score, 0-100; published 90% interval 43.35-53.42. Not a percentile rank.Slovak Republic / Control of corruption, 2024: 50.10. Absolute score, 0-100; published 90% interval 45.06-55.13. Not a percentile rank.Slovenia / Control of corruption, 2024: 61.50. Absolute score, 0-100; published 90% interval 56.47-66.54. Not a percentile rank.Spain / Control of corruption, 2024: 62.32. Absolute score, 0-100; published 90% interval 56.98-67.66. Not a percentile rank.Sweden / Control of corruption, 2024: 87.68. Absolute score, 0-100; published 90% interval 82.35-93.02. Not a percentile rank.Canada / Control of corruption, 2024: 80.89. Absolute score, 0-100; published 90% interval 75.18-86.60. Not a percentile rank.United States / Control of corruption, 2024: 69.86. Absolute score, 0-100; published 90% interval 64.14-75.57. Not a percentile rank.Absolute 0-100 scores / 90% intervals

Hover or tap a point. Keyboard users can focus the figure and use the arrow keys.

Read all 174 plotted observations

Country points and their published 90% intervals share the same absolute score axis. The EU-median tick is a country summary, not a sovereign EU score or pooled confidence interval. Close point estimates do not establish a significant difference.

SourceWorld Bank Worldwide Governance Indicators, 2025 revision

Method & exact data

WGI 2024 / 2025 methodology revision / absolute scores, 0–100 / published 90% intervals. Country points and their published 90% intervals share the same absolute score axis. The EU-median tick is a country summary, not a sovereign EU score or pooled confidence interval. Close point estimates do not establish a significant difference.

Download published data and definitions

Canada has a higher 2024 point estimate than the United States in all six dimensions, but close values should not become an exact league table. Regulatory quality is particularly close. Only voice and accountability clears the conservative screen of non-overlapping published 90% intervals. The other five interval pairs overlap; overlap does not prove equality, and this is not a formal paired significance test.

The institutional comparison pulls modestly toward the EU-member median in the baseline model. It does not settle the overall question. A six-dimension average combines contrasts that differ in magnitude and direction, while European countries themselves occupy very different positions within each dimension.

V-Dem, Freedom House and International IDEA provide valuable additional lenses. They are not automatically independent corroboration: their underlying information overlaps with WGI, and data editions must not be spliced. IDEA's 2025 evidence is newer than the WGI endpoint, but its numerical reuse terms were not fully resolved in this review. These sources are documented as alternatives, not silently added as extra institutional votes.

08

The extended comparison

Similar economies can carry different commitments.

Military resources, the composition of jobs and public balance sheets add dimensions that an income ranking cannot supply.

The original military exhibit used the frozen World Bank/SIPRI 2024 series. The newer SIPRI workbook extends through 2025 and revises earlier observations. Keeping the vintages separate is essential: changing a historical value can reflect a source revision rather than a change that happened after the original observation.

In the newer workbook, Canada's 2025 military expenditure is 1.63% of GDP and about US$939 per person. The US figures are 3.12% and US$2,755. The constructed EU27 aggregate is about 2.18% and US$1,023. The EU figures divide sums using denominators recovered consistently from the same workbook's expenditure and ratio pairs, rather than borrowing population or GDP weights from another year.

These are measures of resources absorbed by the military, not readiness, security or military capability. SIPRI includes current and capital expenditure within its definition; NATO concepts and targets are not interchangeable with it. Latest-year observations can reflect adopted budgets and estimates, and the source's country notes remain relevant.

31

Canada’s defence resources remain below the US on two measures.

SIPRI 2025 / military expenditure as % of GDP and current US$ per person

↗
CanadaUnited StatesEU27 / members
Defence commitments have a fiscal and a per-person dimension07501,5002,2503,000012345Austria, 2025: 1.10. 1.10% of GDP; 697 current US$ per person.Belgium, 2025: 2.01. 2.01% of GDP; 1,237 current US$ per person.Bulgaria, 2025: 2.01. 2.01% of GDP; 384 current US$ per person.Croatia, 2025: 2.02. 2.02% of GDP; 544 current US$ per person.Cyprus, 2025: 1.61. 1.61% of GDP; 486 current US$ per person.Czechia, 2025: 1.84. 1.84% of GDP; 660 current US$ per person.Denmark, 2025: 3.25. 3.25% of GDP; 2,495 current US$ per person.Estonia, 2025: 3.37. 3.37% of GDP; 1,164 current US$ per person.Finland, 2025: 2.57. 2.57% of GDP; 1,437 current US$ per person.France, 2025: 2.03. 2.03% of GDP; 1,021 current US$ per person.Germany, 2025: 2.27. 2.27% of GDP; 1,346 current US$ per person.Greece, 2025: 2.99. 2.99% of GDP; 842 current US$ per person.Hungary, 2025: 2.04. 2.04% of GDP; 518 current US$ per person.Ireland, 2025: 0.22. 0.22% of GDP; 272 current US$ per person.Italy, 2025: 1.89. 1.89% of GDP; 813 current US$ per person.Latvia, 2025: 3.61. 3.61% of GDP; 929 current US$ per person.Lithuania, 2025: 3.08. 3.08% of GDP; 1,035 current US$ per person.Luxembourg, 2025: 0.85. 0.85% of GDP; 1,264 current US$ per person.Malta, 2025: 0.45. 0.45% of GDP; 230 current US$ per person.Netherlands, 2025: 2.19. 2.19% of GDP; 1,582 current US$ per person.Poland, 2025: 4.50. 4.50% of GDP; 1,219 current US$ per person.Portugal, 2025: 1.71. 1.71% of GDP; 563 current US$ per person.Romania, 2025: 2.28. 2.28% of GDP; 513 current US$ per person.Slovak Republic, 2025: 2.03. 2.03% of GDP; 568 current US$ per person.Slovenia, 2025: 1.54. 1.54% of GDP; 577 current US$ per person.Spain, 2025: 2.13. 2.13% of GDP; 839 current US$ per person.Sweden, 2025: 2.47. 2.47% of GDP; 1,549 current US$ per person.Canada, 2025: 1.63. 1.63% of GDP; 939 current US$ per person.CanadaUnited States, 2025: 3.12. 3.12% of GDP; 2,755 current US$ per person.USEU27 aggregate, 2025: 2.18. 2.18% of GDP; 1,023 current US$ per person.EU27Current US$ per person ↑Military expenditure / % of GDP →

Hover or tap a point. Keyboard users can focus the figure and use the arrow keys.

Read all 30 plotted observations

Latest-year budget/estimate data, subject to revision. Resource input, not capability. The EU real-spending path sums the fixed 27 members. These source vintages remain separate from the original WDI baseline; NATO definitions and targets are not substituted. Sum the 27 military expenditures. Recover each source-consistent GDP and population denominator from the same workbook expenditure/ratio pairs, then divide sums. No 2024 WDI weights are used for the 2025 aggregate.

SourceSIPRI Military Expenditure Database 1949-2025 v1.2

Method & exact data

SIPRI 2025 / military expenditure as % of GDP and current US$ per person. Latest-year budget/estimate data, subject to revision. Resource input, not capability. The EU real-spending path sums the fixed 27 members. These source vintages remain separate from the original WDI baseline; NATO definitions and targets are not substituted. Sum the 27 military expenditures. Recover each source-consistent GDP and population denominator from the same workbook expenditure/ratio pairs, then divide sums. No 2024 WDI weights are used for the 2025 aggregate.

Download published data and definitions
32

The growth rates differ from the sizes of the military systems.

2019–2025 / constant 2024 US dollars / index, 2019=100

↗
CanadaUnited StatesEU27 / members
Real military expenditure since 201980100120140160180Canada, 2019: 100.00. 24.4 billion constant 2024 US dollars; 2019=100 index 100.0.Canada, 2020: 110.62. 27.0 billion constant 2024 US dollars; 2019=100 index 110.6.Canada, 2021: 105.34. 25.7 billion constant 2024 US dollars; 2019=100 index 105.3.Canada, 2022: 104.13. 25.4 billion constant 2024 US dollars; 2019=100 index 104.1.Canada, 2023: 119.50. 29.1 billion constant 2024 US dollars; 2019=100 index 119.5.Canada, 2024: 125.54. 30.6 billion constant 2024 US dollars; 2019=100 index 125.5.Canada, 2025: 153.88. 37.5 billion constant 2024 US dollars; 2019=100 index 153.9.CanadaUnited States, 2019: 100.00. 901.0 billion constant 2024 US dollars; 2019=100 index 100.0.United States, 2020: 104.71. 943.4 billion constant 2024 US dollars; 2019=100 index 104.7.United States, 2021: 103.59. 933.3 billion constant 2024 US dollars; 2019=100 index 103.6.United States, 2022: 102.39. 922.6 billion constant 2024 US dollars; 2019=100 index 102.4.United States, 2023: 104.66. 943.0 billion constant 2024 US dollars; 2019=100 index 104.7.United States, 2024: 111.53. 1,004.9 billion constant 2024 US dollars; 2019=100 index 111.5.United States, 2025: 103.12. 929.2 billion constant 2024 US dollars; 2019=100 index 103.1.USEU27 sum, 2019: 100.00. 252.1 billion constant 2024 US dollars; 2019=100 index 100.0.EU27 sum, 2020: 107.14. 270.1 billion constant 2024 US dollars; 2019=100 index 107.1.EU27 sum, 2021: 111.40. 280.9 billion constant 2024 US dollars; 2019=100 index 111.4.EU27 sum, 2022: 114.62. 289.0 billion constant 2024 US dollars; 2019=100 index 114.6.EU27 sum, 2023: 124.66. 314.3 billion constant 2024 US dollars; 2019=100 index 124.7.EU27 sum, 2024: 142.88. 360.2 billion constant 2024 US dollars; 2019=100 index 142.9.EU27 sum, 2025: 170.71. 430.4 billion constant 2024 US dollars; 2019=100 index 170.7.EU272019202120232025

Hover or tap a point. Keyboard users can focus the figure and use the arrow keys.

Read all 21 plotted observations

The EU path sums the fixed 27 members before indexing. A percentage change does not erase differences in initial scale. Latest-year observations can be budget estimates; this newer source vintage does not overwrite the earlier WDI exhibit.

SourceSIPRI Military Expenditure Database 1949-2025 v1.2

Method & exact data

2019–2025 / constant 2024 US dollars / index, 2019=100. The EU path sums the fixed 27 members before indexing. A percentage change does not erase differences in initial scale. Latest-year observations can be budget estimates; this newer source vintage does not overwrite the earlier WDI exhibit.

Download published data and definitions

The real-spending trajectories show another distinction. From 2019 to 2025, constant-price military expenditure rose by about 53.9% in Canada, 70.7% in the EU27 sum and 3.1% in the United States. A faster percentage increase does not imply a larger absolute military system: the US begins from a much larger resource base.

Sector composition offers a more immediate North American resemblance. In 2024, industry accounted for 18.93% of Canadian employment and 19.04% of US employment; services accounted for 79.94% and 79.39%. These are ILO modeled job shares, not national-accounts output shares. The ternary view keeps the complete agriculture-industry-services composition rather than combining unlike denominators.

33

Canada and the US occupy almost the same employment-composition corner.

2024 / agriculture, industry and services / percentage shares of employment

↗
CanadaUnited StatesEU members
Three employment sectors, with a truthful enlargement of the service corner01 / full compositionAgriculture / 100%Industry / 100%Services / 100%Austria, 2024: 72.34. Agriculture 2.83%, industry 24.83%, services 72.34% of employment.Belgium, 2024: 79.47. Agriculture 1.01%, industry 19.52%, services 79.47% of employment.Bulgaria, 2024: 67.03. Agriculture 4.84%, industry 28.13%, services 67.03% of employment.Croatia, 2024: 68.85. Agriculture 4.49%, industry 26.66%, services 68.85% of employment.Cyprus, 2024: 81.46. Agriculture 2.20%, industry 16.34%, services 81.46% of employment.Czechia, 2024: 61.85. Agriculture 2.82%, industry 35.33%, services 61.85% of employment.Denmark, 2024: 79.33. Agriculture 1.67%, industry 19.00%, services 79.33% of employment.Estonia, 2024: 70.48. Agriculture 3.07%, industry 26.45%, services 70.48% of employment.Finland, 2024: 75.46. Agriculture 3.57%, industry 20.97%, services 75.46% of employment.France, 2024: 78.07. Agriculture 2.39%, industry 19.54%, services 78.07% of employment.Germany, 2024: 72.62. Agriculture 1.09%, industry 26.29%, services 72.62% of employment.Greece, 2024: 72.66. Agriculture 10.99%, industry 16.35%, services 72.66% of employment.Hungary, 2024: 64.94. Agriculture 4.24%, industry 30.81%, services 64.94% of employment.Ireland, 2024: 77.59. Agriculture 3.95%, industry 18.45%, services 77.59% of employment.Italy, 2024: 69.89. Agriculture 3.43%, industry 26.68%, services 69.89% of employment.Latvia, 2024: 71.10. Agriculture 6.92%, industry 21.98%, services 71.10% of employment.Lithuania, 2024: 69.17. Agriculture 4.85%, industry 25.99%, services 69.17% of employment.Luxembourg, 2024: 91.28. Agriculture 0.90%, industry 7.82%, services 91.28% of employment.Malta, 2024: 81.16. Agriculture 0.91%, industry 17.93%, services 81.16% of employment.Netherlands, 2024: 84.23. Agriculture 1.75%, industry 14.02%, services 84.23% of employment.Poland, 2024: 63.30. Agriculture 6.50%, industry 30.20%, services 63.30% of employment.Portugal, 2024: 72.38. Agriculture 2.86%, industry 24.76%, services 72.38% of employment.Romania, 2024: 56.08. Agriculture 11.26%, industry 32.65%, services 56.08% of employment.Slovak Republic, 2024: 62.81. Agriculture 2.24%, industry 34.95%, services 62.81% of employment.Slovenia, 2024: 64.17. Agriculture 3.77%, industry 32.06%, services 64.17% of employment.Spain, 2024: 76.44. Agriculture 3.47%, industry 20.09%, services 76.44% of employment.Sweden, 2024: 81.17. Agriculture 1.81%, industry 17.02%, services 81.17% of employment.Canada, 2024: 79.94. Agriculture 1.13%, industry 18.93%, services 79.94% of employment.United States, 2024: 79.39. Agriculture 1.57%, industry 19.04%, services 79.39% of employment.02 / service corner, enlargedAgriculture / %01020Austria, 2024: 72.34. Agriculture 2.83%, industry 24.83%, services 72.34% of employment.Belgium, 2024: 79.47. Agriculture 1.01%, industry 19.52%, services 79.47% of employment.Bulgaria, 2024: 67.03. Agriculture 4.84%, industry 28.13%, services 67.03% of employment.Croatia, 2024: 68.85. Agriculture 4.49%, industry 26.66%, services 68.85% of employment.Cyprus, 2024: 81.46. Agriculture 2.20%, industry 16.34%, services 81.46% of employment.Czechia, 2024: 61.85. Agriculture 2.82%, industry 35.33%, services 61.85% of employment.Denmark, 2024: 79.33. Agriculture 1.67%, industry 19.00%, services 79.33% of employment.Estonia, 2024: 70.48. Agriculture 3.07%, industry 26.45%, services 70.48% of employment.Finland, 2024: 75.46. Agriculture 3.57%, industry 20.97%, services 75.46% of employment.France, 2024: 78.07. Agriculture 2.39%, industry 19.54%, services 78.07% of employment.Germany, 2024: 72.62. Agriculture 1.09%, industry 26.29%, services 72.62% of employment.Greece, 2024: 72.66. Agriculture 10.99%, industry 16.35%, services 72.66% of employment.Hungary, 2024: 64.94. Agriculture 4.24%, industry 30.81%, services 64.94% of employment.Ireland, 2024: 77.59. Agriculture 3.95%, industry 18.45%, services 77.59% of employment.Italy, 2024: 69.89. Agriculture 3.43%, industry 26.68%, services 69.89% of employment.Latvia, 2024: 71.10. Agriculture 6.92%, industry 21.98%, services 71.10% of employment.Lithuania, 2024: 69.17. Agriculture 4.85%, industry 25.99%, services 69.17% of employment.Luxembourg, 2024: 91.28. Agriculture 0.90%, industry 7.82%, services 91.28% of employment.Malta, 2024: 81.16. Agriculture 0.91%, industry 17.93%, services 81.16% of employment.Netherlands, 2024: 84.23. Agriculture 1.75%, industry 14.02%, services 84.23% of employment.Poland, 2024: 63.30. Agriculture 6.50%, industry 30.20%, services 63.30% of employment.Portugal, 2024: 72.38. Agriculture 2.86%, industry 24.76%, services 72.38% of employment.Romania, 2024: 56.08. Agriculture 11.26%, industry 32.65%, services 56.08% of employment.Slovak Republic, 2024: 62.81. Agriculture 2.24%, industry 34.95%, services 62.81% of employment.Slovenia, 2024: 64.17. Agriculture 3.77%, industry 32.06%, services 64.17% of employment.Spain, 2024: 76.44. Agriculture 3.47%, industry 20.09%, services 76.44% of employment.Sweden, 2024: 81.17. Agriculture 1.81%, industry 17.02%, services 81.17% of employment.Canada, 2024: 79.94. Agriculture 1.13%, industry 18.93%, services 79.94% of employment.United States, 2024: 79.39. Agriculture 1.57%, industry 19.04%, services 79.39% of employment.CanadaUSThe same positions, enlarged.2024 employment / not GDP

Hover or tap a point. Keyboard users can focus the figure and use the arrow keys.

Read all 29 plotted observations

ILO modeled employment shares from WDI. Agriculture, industry and services exhaust the source classification; sectors describe jobs, not value added or individual productivity. Published rounding can create a very small sum discrepancy. The outlined services corner is enlarged without moving any country. The geometry normalizes the three published shares by their sum only to absorb rounding differences below 0.001 percentage points; the CSV preserves the original values.

SourceWorld Bank WDI / ILO modeled employment estimates

Method & exact data

2024 / agriculture, industry and services / percentage shares of employment. ILO modeled employment shares from WDI. Agriculture, industry and services exhaust the source classification; sectors describe jobs, not value added or individual productivity. Published rounding can create a very small sum discrepancy. The outlined services corner is enlarged without moving any country. The geometry normalizes the three published shares by their sum only to absorb rounding differences below 0.001 percentage points; the CSV preserves the original values.

Download published data and definitions

The proximity panel also adds trade openness, general-government gross debt, female labour participation, unemployment and internet use. These variables are not all independent. Trade equals exports plus imports; adding all three as separate criteria would create extra votes for one accounting relationship. Public revenue and the fiscal balance are similarly not appended as independent votes beside spending simply because the source supplies them.

Employment structure and value-added structure remain different measures. Industry includes construction, mining and utilities as well as manufacturing. For services value added, the latest year common to all 29 countries is 2021, whereas the job composition is available in 2024. Those dates remain visible instead of being cosmetically aligned.

Internet use is a genuinely comparable digital-access indicator in the selected World Bank/ITU series. It is not a measure of enterprise AI use, the quality of digital skills or the productivity of technology adoption. The broader ITU connectivity composite was reviewed but not counted again alongside its overlapping internet component.

09

The extended comparison

Three AI percentages do not make one ranking.

The survey question, business population and time window are part of the measurement.

Published AI-use observations are available for all three comparators. Availability is not the same as harmonization. Eurostat reports 19.95% for its 2025 population of enterprises with at least ten employees and self-employed persons in specified activities. Statistics Canada reports 19.2% in its second-quarter 2026 survey of employee establishments. The latest retained US Census BTOS observation reports 23.2% for the period ending 6 September 2026.

Eurostat asks about specified AI technologies and generally the current situation during the survey. Canada asks about using AI to produce goods or deliver services during the preceding twelve months. The US asks about AI in any business function during the preceding two weeks. These distinctions affect who enters the numerator, who enters the denominator and what period the observation covers.

The US series also has an explicit wording break. Collection beginning 17 November 2025 broadened the core question from producing goods or services to any business function. A business using AI in hiring or accounting may answer the broader question differently without changing its behavior. That discontinuity cannot be read as a pure technology-adoption jump.

34

Keep the AI observations. Reject the false league table.

Separately defined national survey estimates / each source’s own population and reference period

↗

Canada

19.2%

Q2 2026; previous 12 months; fieldwork 1 April-6 May 2026

Who is counted?
Canadian Survey on Business Conditions: business establishments with employees
What is use?
Reported AI use to produce goods or deliver services during the previous 12 months.
Scoring decision
Excluded: Different business unit, sectors, AI-use concept and reference window from Eurostat and the current BTOS.
Statistics Canada / source and definitions

United States

23.2%

Period ending 6 September 2026; previous 2 weeks

Who is counted?
BTOS in-scope nonfarm employer businesses; source exclusions apply
What is use?
AI use in any business function. This broader wording began with collection on 17 November 2025.
Scoring decision
Excluded: Different population, two-week window and broader question, with a questionnaire break in November 2025.
US Census Bureau / source and definitions

European Union

19.95%

2025 survey

Who is counted?
Enterprises with 10+ employees and self-employed persons; covered NACE C-J, L-N and group 95.1
What is use?
Using at least one of the specified Eurostat AI technologies; current situation in the survey period.
Scoring decision
Excluded: Statistical unit, size threshold, sectors, question and reference period are not harmonized with the Canadian and US surveys.
Eurostat / source and definitions

These are separately defined descriptive observations, not a harmonized international ranking. All are excluded from the proximity score. Canadian figures are adapted from Statistics Canada; this does not constitute endorsement of this product.

SourceEurostat, Statistics Canada CSBC and US Census BTOS

Method & exact data

Separately defined national survey estimates / each source’s own population and reference period. These are separately defined descriptive observations, not a harmonized international ranking. All are excluded from the proximity score. Canadian figures are adapted from Statistics Canada; this does not constitute endorsement of this product.

Download published data and definitions

A within-source comparison is more defensible. Canada's reported production/service use rose from 12.2% in the second quarter of 2025 to 19.2% in the same quarter of 2026, a seven-percentage-point increase. These are repeated survey estimates, not observations of an identical panel of establishments or a causal estimate of an AI policy.

Use also differs sharply by business activity. The Canadian 2026 release reports 42.3% in information and cultural industries, 40.4% in finance and insurance, and 32.4% in professional, scientific and technical services. It reports 4.5% in agriculture, forestry, fishing and hunting, 7.9% in wholesale trade and 9.2% in construction. A national percentage averages over this industrial composition.

Expectations remain a different evidence category. Census reports 27.3% expected use over the next six months at the September 2026 observation; the separately verified Canadian planned-use figure is 14.5% for the next twelve months from the third-quarter 2025 survey. The latter is not labeled Canada's latest 2026 expectation. Neither is substituted for realized adoption.

All of these AI observations stay outside the similarity score. That exclusion is a substantive result of the research, not missing-data concealment. The harmonized slot is unavailable, not zero; the descriptive evidence remains visible with its own definitions.

Research instrument / inspect the relationships

The Relationship Atlas

Which differences travel together? Select a cell, meet the countries behind it, then follow the relationship through the observed years.

24 × 24variables in this matrix

The annual panel fixes one 24-variable set shared by every year from 2019 through 2023. PISA, services output and renewables are excluded because later complete years are unavailable. Each coefficient compares 29 countries: Canada, the US and 27 EU members.

2023

Reduced motion: use the year stepper. The country and variable sets remain fixed.

Which variables travel together?The fixed variable order follows the eight analytical domains. Color is signed correlation, not country identity. Select a cell to inspect its actual country observations. A correlation is not a causal effect.Output / person (2023) and Output / person (2023): +1.00, n=29.Fixed investment (2023) and Output / person (2023): -0.02, n=29.R&D share (2023) and Output / person (2023): +0.57, n=29.Internet use (2023) and Output / person (2023): +0.75, n=29.Industry employment (2023) and Output / person (2023): -0.58, n=29.Trade openness (2023) and Output / person (2023): +0.10, n=29.Government spending (2023) and Output / person (2023): +0.06, n=29.Gross public debt (2023) and Output / person (2023): 0.00, n=29.Military spending (2023) and Output / person (2023): -0.51, n=29.Life expectancy (2023) and Output / person (2023): +0.58, n=29.Child mortality (2023) and Output / person (2023): -0.14, n=29.Health spending (2023) and Output / person (2023): +0.95, n=29.Out-of-pocket share (2023) and Output / person (2023): -0.67, n=29.Aged 65+ (2023) and Output / person (2023): -0.38, n=29.Fertility (2023) and Output / person (2023): -0.05, n=29.Female participation (2023) and Output / person (2023): +0.51, n=29.Unemployment (2023) and Output / person (2023): -0.33, n=29.Territorial CO₂ (2023) and Output / person (2023): +0.35, n=29.Voice & accountability (2023) and Output / person (2023): +0.68, n=29.Political stability (2023) and Output / person (2023): +0.18, n=29.Government effectiveness (2023) and Output / person (2023): +0.84, n=29.Regulatory quality (2023) and Output / person (2023): +0.77, n=29.Rule of law (2023) and Output / person (2023): +0.71, n=29.Control of corruption (2023) and Output / person (2023): +0.72, n=29.Output / person (2023) and Fixed investment (2023): -0.02, n=29.Fixed investment (2023) and Fixed investment (2023): +1.00, n=29.R&D share (2023) and Fixed investment (2023): +0.18, n=29.Internet use (2023) and Fixed investment (2023): +0.12, n=29.Industry employment (2023) and Fixed investment (2023): +0.33, n=29.Trade openness (2023) and Fixed investment (2023): +0.01, n=29.Government spending (2023) and Fixed investment (2023): 0.00, n=29.Gross public debt (2023) and Fixed investment (2023): -0.18, n=29.Military spending (2023) and Fixed investment (2023): +0.02, n=29.Life expectancy (2023) and Fixed investment (2023): -0.23, n=29.Child mortality (2023) and Fixed investment (2023): -0.20, n=29.Health spending (2023) and Fixed investment (2023): -0.13, n=29.Out-of-pocket share (2023) and Fixed investment (2023): -0.06, n=29.Aged 65+ (2023) and Fixed investment (2023): -0.01, n=29.Fertility (2023) and Fixed investment (2023): +0.32, n=29.Female participation (2023) and Fixed investment (2023): +0.09, n=29.Unemployment (2023) and Fixed investment (2023): +0.06, n=29.Territorial CO₂ (2023) and Fixed investment (2023): -0.11, n=29.Voice & accountability (2023) and Fixed investment (2023): +0.13, n=29.Political stability (2023) and Fixed investment (2023): +0.26, n=29.Government effectiveness (2023) and Fixed investment (2023): +0.10, n=29.Regulatory quality (2023) and Fixed investment (2023): +0.11, n=29.Rule of law (2023) and Fixed investment (2023): +0.20, n=29.Control of corruption (2023) and Fixed investment (2023): +0.11, n=29.Output / person (2023) and R&D share (2023): +0.57, n=29.Fixed investment (2023) and R&D share (2023): +0.18, n=29.R&D share (2023) and R&D share (2023): +1.00, n=29.Internet use (2023) and R&D share (2023): +0.42, n=29.Industry employment (2023) and R&D share (2023): -0.18, n=29.Trade openness (2023) and R&D share (2023): -0.29, n=29.Government spending (2023) and R&D share (2023): +0.46, n=29.Gross public debt (2023) and R&D share (2023): +0.20, n=29.Military spending (2023) and R&D share (2023): -0.06, n=29.Life expectancy (2023) and R&D share (2023): +0.29, n=29.Child mortality (2023) and R&D share (2023): -0.32, n=29.Health spending (2023) and R&D share (2023): +0.67, n=29.Out-of-pocket share (2023) and R&D share (2023): -0.54, n=29.Aged 65+ (2023) and R&D share (2023): +0.16, n=29.Fertility (2023) and R&D share (2023): +0.18, n=29.Female participation (2023) and R&D share (2023): +0.28, n=29.Unemployment (2023) and R&D share (2023): -0.09, n=29.Territorial CO₂ (2023) and R&D share (2023): +0.36, n=29.Voice & accountability (2023) and R&D share (2023): +0.60, n=29.Political stability (2023) and R&D share (2023): -0.06, n=29.Government effectiveness (2023) and R&D share (2023): +0.69, n=29.Regulatory quality (2023) and R&D share (2023): +0.67, n=29.Rule of law (2023) and R&D share (2023): +0.60, n=29.Control of corruption (2023) and R&D share (2023): +0.71, n=29.Output / person (2023) and Internet use (2023): +0.75, n=29.Fixed investment (2023) and Internet use (2023): +0.12, n=29.R&D share (2023) and Internet use (2023): +0.42, n=29.Internet use (2023) and Internet use (2023): +1.00, n=29.Industry employment (2023) and Internet use (2023): -0.56, n=29.Trade openness (2023) and Internet use (2023): +0.23, n=29.Government spending (2023) and Internet use (2023): +0.01, n=29.Gross public debt (2023) and Internet use (2023): -0.19, n=29.Military spending (2023) and Internet use (2023): -0.38, n=29.Life expectancy (2023) and Internet use (2023): +0.40, n=29.Child mortality (2023) and Internet use (2023): -0.27, n=29.Health spending (2023) and Internet use (2023): +0.71, n=29.Out-of-pocket share (2023) and Internet use (2023): -0.40, n=29.Aged 65+ (2023) and Internet use (2023): -0.43, n=29.Fertility (2023) and Internet use (2023): -0.13, n=29.Female participation (2023) and Internet use (2023): +0.64, n=29.Unemployment (2023) and Internet use (2023): -0.12, n=29.Territorial CO₂ (2023) and Internet use (2023): +0.24, n=29.Voice & accountability (2023) and Internet use (2023): +0.72, n=29.Political stability (2023) and Internet use (2023): +0.22, n=29.Government effectiveness (2023) and Internet use (2023): +0.76, n=29.Regulatory quality (2023) and Internet use (2023): +0.73, n=29.Rule of law (2023) and Internet use (2023): +0.74, n=29.Control of corruption (2023) and Internet use (2023): +0.72, n=29.Output / person (2023) and Industry employment (2023): -0.58, n=29.Fixed investment (2023) and Industry employment (2023): +0.33, n=29.R&D share (2023) and Industry employment (2023): -0.18, n=29.Internet use (2023) and Industry employment (2023): -0.56, n=29.Industry employment (2023) and Industry employment (2023): +1.00, n=29.Trade openness (2023) and Industry employment (2023): -0.12, n=29.Government spending (2023) and Industry employment (2023): +0.05, n=29.Gross public debt (2023) and Industry employment (2023): -0.08, n=29.Military spending (2023) and Industry employment (2023): +0.27, n=29.Life expectancy (2023) and Industry employment (2023): -0.58, n=29.Child mortality (2023) and Industry employment (2023): +0.01, n=29.Health spending (2023) and Industry employment (2023): -0.61, n=29.Out-of-pocket share (2023) and Industry employment (2023): +0.25, n=29.Aged 65+ (2023) and Industry employment (2023): +0.27, n=29.Fertility (2023) and Industry employment (2023): +0.28, n=29.Female participation (2023) and Industry employment (2023): -0.48, n=29.Unemployment (2023) and Industry employment (2023): -0.18, n=29.Territorial CO₂ (2023) and Industry employment (2023): +0.02, n=29.Voice & accountability (2023) and Industry employment (2023): -0.48, n=29.Political stability (2023) and Industry employment (2023): +0.01, n=29.Government effectiveness (2023) and Industry employment (2023): -0.52, n=29.Regulatory quality (2023) and Industry employment (2023): -0.49, n=29.Rule of law (2023) and Industry employment (2023): -0.45, n=29.Control of corruption (2023) and Industry employment (2023): -0.47, n=29.Output / person (2023) and Trade openness (2023): +0.10, n=29.Fixed investment (2023) and Trade openness (2023): +0.01, n=29.R&D share (2023) and Trade openness (2023): -0.29, n=29.Internet use (2023) and Trade openness (2023): +0.23, n=29.Industry employment (2023) and Trade openness (2023): -0.12, n=29.Trade openness (2023) and Trade openness (2023): +1.00, n=29.Government spending (2023) and Trade openness (2023): -0.23, n=29.Gross public debt (2023) and Trade openness (2023): -0.57, n=29.Military spending (2023) and Trade openness (2023): -0.32, n=29.Life expectancy (2023) and Trade openness (2023): +0.04, n=29.Child mortality (2023) and Trade openness (2023): -0.13, n=29.Health spending (2023) and Trade openness (2023): -0.02, n=29.Out-of-pocket share (2023) and Trade openness (2023): +0.05, n=29.Aged 65+ (2023) and Trade openness (2023): -0.46, n=29.Fertility (2023) and Trade openness (2023): 0.00, n=29.Female participation (2023) and Trade openness (2023): +0.33, n=29.Unemployment (2023) and Trade openness (2023): -0.34, n=29.Territorial CO₂ (2023) and Trade openness (2023): +0.05, n=29.Voice & accountability (2023) and Trade openness (2023): +0.09, n=29.Political stability (2023) and Trade openness (2023): +0.51, n=29.Government effectiveness (2023) and Trade openness (2023): +0.01, n=29.Regulatory quality (2023) and Trade openness (2023): +0.07, n=29.Rule of law (2023) and Trade openness (2023): +0.14, n=29.Control of corruption (2023) and Trade openness (2023): +0.01, n=29.Output / person (2023) and Government spending (2023): +0.06, n=29.Fixed investment (2023) and Government spending (2023): 0.00, n=29.R&D share (2023) and Government spending (2023): +0.46, n=29.Internet use (2023) and Government spending (2023): +0.01, n=29.Industry employment (2023) and Government spending (2023): +0.05, n=29.Trade openness (2023) and Government spending (2023): -0.23, n=29.Government spending (2023) and Government spending (2023): +1.00, n=29.Gross public debt (2023) and Government spending (2023): +0.40, n=29.Military spending (2023) and Government spending (2023): +0.12, n=29.Life expectancy (2023) and Government spending (2023): +0.24, n=29.Child mortality (2023) and Government spending (2023): -0.33, n=29.Health spending (2023) and Government spending (2023): +0.12, n=29.Out-of-pocket share (2023) and Government spending (2023): -0.19, n=29.Aged 65+ (2023) and Government spending (2023): +0.45, n=29.Fertility (2023) and Government spending (2023): -0.01, n=29.Female participation (2023) and Government spending (2023): -0.26, n=29.Unemployment (2023) and Government spending (2023): +0.30, n=29.Territorial CO₂ (2023) and Government spending (2023): +0.02, n=29.Voice & accountability (2023) and Government spending (2023): +0.21, n=29.Political stability (2023) and Government spending (2023): -0.26, n=29.Government effectiveness (2023) and Government spending (2023): +0.16, n=29.Regulatory quality (2023) and Government spending (2023): +0.11, n=29.Rule of law (2023) and Government spending (2023): +0.11, n=29.Control of corruption (2023) and Government spending (2023): +0.22, n=29.Output / person (2023) and Gross public debt (2023): 0.00, n=29.Fixed investment (2023) and Gross public debt (2023): -0.18, n=29.R&D share (2023) and Gross public debt (2023): +0.20, n=29.Internet use (2023) and Gross public debt (2023): -0.19, n=29.Industry employment (2023) and Gross public debt (2023): -0.08, n=29.Trade openness (2023) and Gross public debt (2023): -0.57, n=29.Government spending (2023) and Gross public debt (2023): +0.40, n=29.Gross public debt (2023) and Gross public debt (2023): +1.00, n=29.Military spending (2023) and Gross public debt (2023): +0.01, n=29.Life expectancy (2023) and Gross public debt (2023): +0.24, n=29.Child mortality (2023) and Gross public debt (2023): +0.18, n=29.Health spending (2023) and Gross public debt (2023): +0.11, n=29.Out-of-pocket share (2023) and Gross public debt (2023): +0.01, n=29.Aged 65+ (2023) and Gross public debt (2023): +0.25, n=29.Fertility (2023) and Gross public debt (2023): -0.04, n=29.Female participation (2023) and Gross public debt (2023): -0.40, n=29.Unemployment (2023) and Gross public debt (2023): +0.30, n=29.Territorial CO₂ (2023) and Gross public debt (2023): +0.01, n=29.Voice & accountability (2023) and Gross public debt (2023): -0.21, n=29.Political stability (2023) and Gross public debt (2023): -0.64, n=29.Government effectiveness (2023) and Gross public debt (2023): -0.11, n=29.Regulatory quality (2023) and Gross public debt (2023): -0.23, n=29.Rule of law (2023) and Gross public debt (2023): -0.28, n=29.Control of corruption (2023) and Gross public debt (2023): -0.21, n=29.Output / person (2023) and Military spending (2023): -0.51, n=29.Fixed investment (2023) and Military spending (2023): +0.02, n=29.R&D share (2023) and Military spending (2023): -0.06, n=29.Internet use (2023) and Military spending (2023): -0.38, n=29.Industry employment (2023) and Military spending (2023): +0.27, n=29.Trade openness (2023) and Military spending (2023): -0.32, n=29.Government spending (2023) and Military spending (2023): +0.12, n=29.Gross public debt (2023) and Military spending (2023): +0.01, n=29.Military spending (2023) and Military spending (2023): +1.00, n=29.Life expectancy (2023) and Military spending (2023): -0.64, n=29.Child mortality (2023) and Military spending (2023): +0.13, n=29.Health spending (2023) and Military spending (2023): -0.49, n=29.Out-of-pocket share (2023) and Military spending (2023): +0.23, n=29.Aged 65+ (2023) and Military spending (2023): +0.24, n=29.Fertility (2023) and Military spending (2023): +0.08, n=29.Female participation (2023) and Military spending (2023): -0.11, n=29.Unemployment (2023) and Military spending (2023): +0.22, n=29.Territorial CO₂ (2023) and Military spending (2023): -0.09, n=29.Voice & accountability (2023) and Military spending (2023): -0.39, n=29.Political stability (2023) and Military spending (2023): -0.28, n=29.Government effectiveness (2023) and Military spending (2023): -0.36, n=29.Regulatory quality (2023) and Military spending (2023): -0.21, n=29.Rule of law (2023) and Military spending (2023): -0.34, n=29.Control of corruption (2023) and Military spending (2023): -0.16, n=29.Output / person (2023) and Life expectancy (2023): +0.58, n=29.Fixed investment (2023) and Life expectancy (2023): -0.23, n=29.R&D share (2023) and Life expectancy (2023): +0.29, n=29.Internet use (2023) and Life expectancy (2023): +0.40, n=29.Industry employment (2023) and Life expectancy (2023): -0.58, n=29.Trade openness (2023) and Life expectancy (2023): +0.04, n=29.Government spending (2023) and Life expectancy (2023): +0.24, n=29.Gross public debt (2023) and Life expectancy (2023): +0.24, n=29.Military spending (2023) and Life expectancy (2023): -0.64, n=29.Life expectancy (2023) and Life expectancy (2023): +1.00, n=29.Child mortality (2023) and Life expectancy (2023): -0.33, n=29.Health spending (2023) and Life expectancy (2023): +0.61, n=29.Out-of-pocket share (2023) and Life expectancy (2023): -0.28, n=29.Aged 65+ (2023) and Life expectancy (2023): +0.02, n=29.Fertility (2023) and Life expectancy (2023): -0.29, n=29.Female participation (2023) and Life expectancy (2023): +0.08, n=29.Unemployment (2023) and Life expectancy (2023): +0.20, n=29.Territorial CO₂ (2023) and Life expectancy (2023): -0.09, n=29.Voice & accountability (2023) and Life expectancy (2023): +0.48, n=29.Political stability (2023) and Life expectancy (2023): +0.06, n=29.Government effectiveness (2023) and Life expectancy (2023): +0.47, n=29.Regulatory quality (2023) and Life expectancy (2023): +0.31, n=29.Rule of law (2023) and Life expectancy (2023): +0.36, n=29.Control of corruption (2023) and Life expectancy (2023): +0.33, n=29.Output / person (2023) and Child mortality (2023): -0.14, n=29.Fixed investment (2023) and Child mortality (2023): -0.20, n=29.R&D share (2023) and Child mortality (2023): -0.32, n=29.Internet use (2023) and Child mortality (2023): -0.27, n=29.Industry employment (2023) and Child mortality (2023): +0.01, n=29.Trade openness (2023) and Child mortality (2023): -0.13, n=29.Government spending (2023) and Child mortality (2023): -0.33, n=29.Gross public debt (2023) and Child mortality (2023): +0.18, n=29.Military spending (2023) and Child mortality (2023): +0.13, n=29.Life expectancy (2023) and Child mortality (2023): -0.33, n=29.Child mortality (2023) and Child mortality (2023): +1.00, n=29.Health spending (2023) and Child mortality (2023): -0.20, n=29.Out-of-pocket share (2023) and Child mortality (2023): +0.05, n=29.Aged 65+ (2023) and Child mortality (2023): -0.34, n=29.Fertility (2023) and Child mortality (2023): +0.34, n=29.Female participation (2023) and Child mortality (2023): -0.16, n=29.Unemployment (2023) and Child mortality (2023): -0.24, n=29.Territorial CO₂ (2023) and Child mortality (2023): -0.09, n=29.Voice & accountability (2023) and Child mortality (2023): -0.51, n=29.Political stability (2023) and Child mortality (2023): -0.48, n=29.Government effectiveness (2023) and Child mortality (2023): -0.40, n=29.Regulatory quality (2023) and Child mortality (2023): -0.41, n=29.Rule of law (2023) and Child mortality (2023): -0.52, n=29.Control of corruption (2023) and Child mortality (2023): -0.47, n=29.Output / person (2023) and Health spending (2023): +0.95, n=29.Fixed investment (2023) and Health spending (2023): -0.13, n=29.R&D share (2023) and Health spending (2023): +0.67, n=29.Internet use (2023) and Health spending (2023): +0.71, n=29.Industry employment (2023) and Health spending (2023): -0.61, n=29.Trade openness (2023) and Health spending (2023): -0.02, n=29.Government spending (2023) and Health spending (2023): +0.12, n=29.Gross public debt (2023) and Health spending (2023): +0.11, n=29.Military spending (2023) and Health spending (2023): -0.49, n=29.Life expectancy (2023) and Health spending (2023): +0.61, n=29.Child mortality (2023) and Health spending (2023): -0.20, n=29.Health spending (2023) and Health spending (2023): +1.00, n=29.Out-of-pocket share (2023) and Health spending (2023): -0.64, n=29.Aged 65+ (2023) and Health spending (2023): -0.26, n=29.Fertility (2023) and Health spending (2023): -0.07, n=29.Female participation (2023) and Health spending (2023): +0.49, n=29.Unemployment (2023) and Health spending (2023): -0.20, n=29.Territorial CO₂ (2023) and Health spending (2023): +0.39, n=29.Voice & accountability (2023) and Health spending (2023): +0.71, n=29.Political stability (2023) and Health spending (2023): +0.09, n=29.Government effectiveness (2023) and Health spending (2023): +0.85, n=29.Regulatory quality (2023) and Health spending (2023): +0.79, n=29.Rule of law (2023) and Health spending (2023): +0.72, n=29.Control of corruption (2023) and Health spending (2023): +0.75, n=29.Output / person (2023) and Out-of-pocket share (2023): -0.67, n=29.Fixed investment (2023) and Out-of-pocket share (2023): -0.06, n=29.R&D share (2023) and Out-of-pocket share (2023): -0.54, n=29.Internet use (2023) and Out-of-pocket share (2023): -0.40, n=29.Industry employment (2023) and Out-of-pocket share (2023): +0.25, n=29.Trade openness (2023) and Out-of-pocket share (2023): +0.05, n=29.Government spending (2023) and Out-of-pocket share (2023): -0.19, n=29.Gross public debt (2023) and Out-of-pocket share (2023): +0.01, n=29.Military spending (2023) and Out-of-pocket share (2023): +0.23, n=29.Life expectancy (2023) and Out-of-pocket share (2023): -0.28, n=29.Child mortality (2023) and Out-of-pocket share (2023): +0.05, n=29.Health spending (2023) and Out-of-pocket share (2023): -0.64, n=29.Out-of-pocket share (2023) and Out-of-pocket share (2023): +1.00, n=29.Aged 65+ (2023) and Out-of-pocket share (2023): +0.22, n=29.Fertility (2023) and Out-of-pocket share (2023): -0.25, n=29.Female participation (2023) and Out-of-pocket share (2023): -0.31, n=29.Unemployment (2023) and Out-of-pocket share (2023): +0.29, n=29.Territorial CO₂ (2023) and Out-of-pocket share (2023): -0.41, n=29.Voice & accountability (2023) and Out-of-pocket share (2023): -0.41, n=29.Political stability (2023) and Out-of-pocket share (2023): -0.07, n=29.Government effectiveness (2023) and Out-of-pocket share (2023): -0.68, n=29.Regulatory quality (2023) and Out-of-pocket share (2023): -0.58, n=29.Rule of law (2023) and Out-of-pocket share (2023): -0.46, n=29.Control of corruption (2023) and Out-of-pocket share (2023): -0.54, n=29.Output / person (2023) and Aged 65+ (2023): -0.38, n=29.Fixed investment (2023) and Aged 65+ (2023): -0.01, n=29.R&D share (2023) and Aged 65+ (2023): +0.16, n=29.Internet use (2023) and Aged 65+ (2023): -0.43, n=29.Industry employment (2023) and Aged 65+ (2023): +0.27, n=29.Trade openness (2023) and Aged 65+ (2023): -0.46, n=29.Government spending (2023) and Aged 65+ (2023): +0.45, n=29.Gross public debt (2023) and Aged 65+ (2023): +0.25, n=29.Military spending (2023) and Aged 65+ (2023): +0.24, n=29.Life expectancy (2023) and Aged 65+ (2023): +0.02, n=29.Child mortality (2023) and Aged 65+ (2023): -0.34, n=29.Health spending (2023) and Aged 65+ (2023): -0.26, n=29.Out-of-pocket share (2023) and Aged 65+ (2023): +0.22, n=29.Aged 65+ (2023) and Aged 65+ (2023): +1.00, n=29.Fertility (2023) and Aged 65+ (2023): +0.02, n=29.Female participation (2023) and Aged 65+ (2023): -0.45, n=29.Unemployment (2023) and Aged 65+ (2023): +0.39, n=29.Territorial CO₂ (2023) and Aged 65+ (2023): -0.33, n=29.Voice & accountability (2023) and Aged 65+ (2023): -0.03, n=29.Political stability (2023) and Aged 65+ (2023): -0.10, n=29.Government effectiveness (2023) and Aged 65+ (2023): -0.17, n=29.Regulatory quality (2023) and Aged 65+ (2023): -0.19, n=29.Rule of law (2023) and Aged 65+ (2023): -0.10, n=29.Control of corruption (2023) and Aged 65+ (2023): -0.11, n=29.Output / person (2023) and Fertility (2023): -0.05, n=29.Fixed investment (2023) and Fertility (2023): +0.32, n=29.R&D share (2023) and Fertility (2023): +0.18, n=29.Internet use (2023) and Fertility (2023): -0.13, n=29.Industry employment (2023) and Fertility (2023): +0.28, n=29.Trade openness (2023) and Fertility (2023): 0.00, n=29.Government spending (2023) and Fertility (2023): -0.01, n=29.Gross public debt (2023) and Fertility (2023): -0.04, n=29.Military spending (2023) and Fertility (2023): +0.08, n=29.Life expectancy (2023) and Fertility (2023): -0.29, n=29.Child mortality (2023) and Fertility (2023): +0.34, n=29.Health spending (2023) and Fertility (2023): -0.07, n=29.Out-of-pocket share (2023) and Fertility (2023): -0.25, n=29.Aged 65+ (2023) and Fertility (2023): +0.02, n=29.Fertility (2023) and Fertility (2023): +1.00, n=29.Female participation (2023) and Fertility (2023): -0.14, n=29.Unemployment (2023) and Fertility (2023): -0.25, n=29.Territorial CO₂ (2023) and Fertility (2023): -0.04, n=29.Voice & accountability (2023) and Fertility (2023): -0.18, n=29.Political stability (2023) and Fertility (2023): -0.24, n=29.Government effectiveness (2023) and Fertility (2023): -0.08, n=29.Regulatory quality (2023) and Fertility (2023): -0.07, n=29.Rule of law (2023) and Fertility (2023): -0.17, n=29.Control of corruption (2023) and Fertility (2023): -0.14, n=29.Output / person (2023) and Female participation (2023): +0.51, n=29.Fixed investment (2023) and Female participation (2023): +0.09, n=29.R&D share (2023) and Female participation (2023): +0.28, n=29.Internet use (2023) and Female participation (2023): +0.64, n=29.Industry employment (2023) and Female participation (2023): -0.48, n=29.Trade openness (2023) and Female participation (2023): +0.33, n=29.Government spending (2023) and Female participation (2023): -0.26, n=29.Gross public debt (2023) and Female participation (2023): -0.40, n=29.Military spending (2023) and Female participation (2023): -0.11, n=29.Life expectancy (2023) and Female participation (2023): +0.08, n=29.Child mortality (2023) and Female participation (2023): -0.16, n=29.Health spending (2023) and Female participation (2023): +0.49, n=29.Out-of-pocket share (2023) and Female participation (2023): -0.31, n=29.Aged 65+ (2023) and Female participation (2023): -0.45, n=29.Fertility (2023) and Female participation (2023): -0.14, n=29.Female participation (2023) and Female participation (2023): +1.00, n=29.Unemployment (2023) and Female participation (2023): -0.16, n=29.Territorial CO₂ (2023) and Female participation (2023): +0.23, n=29.Voice & accountability (2023) and Female participation (2023): +0.61, n=29.Political stability (2023) and Female participation (2023): +0.42, n=29.Government effectiveness (2023) and Female participation (2023): +0.66, n=29.Regulatory quality (2023) and Female participation (2023): +0.70, n=29.Rule of law (2023) and Female participation (2023): +0.68, n=29.Control of corruption (2023) and Female participation (2023): +0.65, n=29.Output / person (2023) and Unemployment (2023): -0.33, n=29.Fixed investment (2023) and Unemployment (2023): +0.06, n=29.R&D share (2023) and Unemployment (2023): -0.09, n=29.Internet use (2023) and Unemployment (2023): -0.12, n=29.Industry employment (2023) and Unemployment (2023): -0.18, n=29.Trade openness (2023) and Unemployment (2023): -0.34, n=29.Government spending (2023) and Unemployment (2023): +0.30, n=29.Gross public debt (2023) and Unemployment (2023): +0.30, n=29.Military spending (2023) and Unemployment (2023): +0.22, n=29.Life expectancy (2023) and Unemployment (2023): +0.20, n=29.Child mortality (2023) and Unemployment (2023): -0.24, n=29.Health spending (2023) and Unemployment (2023): -0.20, n=29.Out-of-pocket share (2023) and Unemployment (2023): +0.29, n=29.Aged 65+ (2023) and Unemployment (2023): +0.39, n=29.Fertility (2023) and Unemployment (2023): -0.25, n=29.Female participation (2023) and Unemployment (2023): -0.16, n=29.Unemployment (2023) and Unemployment (2023): +1.00, n=29.Territorial CO₂ (2023) and Unemployment (2023): -0.45, n=29.Voice & accountability (2023) and Unemployment (2023): +0.10, n=29.Political stability (2023) and Unemployment (2023): -0.22, n=29.Government effectiveness (2023) and Unemployment (2023): -0.11, n=29.Regulatory quality (2023) and Unemployment (2023): -0.11, n=29.Rule of law (2023) and Unemployment (2023): -0.02, n=29.Control of corruption (2023) and Unemployment (2023): -0.03, n=29.Output / person (2023) and Territorial CO₂ (2023): +0.35, n=29.Fixed investment (2023) and Territorial CO₂ (2023): -0.11, n=29.R&D share (2023) and Territorial CO₂ (2023): +0.36, n=29.Internet use (2023) and Territorial CO₂ (2023): +0.24, n=29.Industry employment (2023) and Territorial CO₂ (2023): +0.02, n=29.Trade openness (2023) and Territorial CO₂ (2023): +0.05, n=29.Government spending (2023) and Territorial CO₂ (2023): +0.02, n=29.Gross public debt (2023) and Territorial CO₂ (2023): +0.01, n=29.Military spending (2023) and Territorial CO₂ (2023): -0.09, n=29.Life expectancy (2023) and Territorial CO₂ (2023): -0.09, n=29.Child mortality (2023) and Territorial CO₂ (2023): -0.09, n=29.Health spending (2023) and Territorial CO₂ (2023): +0.39, n=29.Out-of-pocket share (2023) and Territorial CO₂ (2023): -0.41, n=29.Aged 65+ (2023) and Territorial CO₂ (2023): -0.33, n=29.Fertility (2023) and Territorial CO₂ (2023): -0.04, n=29.Female participation (2023) and Territorial CO₂ (2023): +0.23, n=29.Unemployment (2023) and Territorial CO₂ (2023): -0.45, n=29.Territorial CO₂ (2023) and Territorial CO₂ (2023): +1.00, n=29.Voice & accountability (2023) and Territorial CO₂ (2023): +0.17, n=29.Political stability (2023) and Territorial CO₂ (2023): -0.04, n=29.Government effectiveness (2023) and Territorial CO₂ (2023): +0.39, n=29.Regulatory quality (2023) and Territorial CO₂ (2023): +0.41, n=29.Rule of law (2023) and Territorial CO₂ (2023): +0.24, n=29.Control of corruption (2023) and Territorial CO₂ (2023): +0.37, n=29.Output / person (2023) and Voice & accountability (2023): +0.68, n=29.Fixed investment (2023) and Voice & accountability (2023): +0.13, n=29.R&D share (2023) and Voice & accountability (2023): +0.60, n=29.Internet use (2023) and Voice & accountability (2023): +0.72, n=29.Industry employment (2023) and Voice & accountability (2023): -0.48, n=29.Trade openness (2023) and Voice & accountability (2023): +0.09, n=29.Government spending (2023) and Voice & accountability (2023): +0.21, n=29.Gross public debt (2023) and Voice & accountability (2023): -0.21, n=29.Military spending (2023) and Voice & accountability (2023): -0.39, n=29.Life expectancy (2023) and Voice & accountability (2023): +0.48, n=29.Child mortality (2023) and Voice & accountability (2023): -0.51, n=29.Health spending (2023) and Voice & accountability (2023): +0.71, n=29.Out-of-pocket share (2023) and Voice & accountability (2023): -0.41, n=29.Aged 65+ (2023) and Voice & accountability (2023): -0.03, n=29.Fertility (2023) and Voice & accountability (2023): -0.18, n=29.Female participation (2023) and Voice & accountability (2023): +0.61, n=29.Unemployment (2023) and Voice & accountability (2023): +0.10, n=29.Territorial CO₂ (2023) and Voice & accountability (2023): +0.17, n=29.Voice & accountability (2023) and Voice & accountability (2023): +1.00, n=29.Political stability (2023) and Voice & accountability (2023): +0.41, n=29.Government effectiveness (2023) and Voice & accountability (2023): +0.89, n=29.Regulatory quality (2023) and Voice & accountability (2023): +0.90, n=29.Rule of law (2023) and Voice & accountability (2023): +0.96, n=29.Control of corruption (2023) and Voice & accountability (2023): +0.93, n=29.Output / person (2023) and Political stability (2023): +0.18, n=29.Fixed investment (2023) and Political stability (2023): +0.26, n=29.R&D share (2023) and Political stability (2023): -0.06, n=29.Internet use (2023) and Political stability (2023): +0.22, n=29.Industry employment (2023) and Political stability (2023): +0.01, n=29.Trade openness (2023) and Political stability (2023): +0.51, n=29.Government spending (2023) and Political stability (2023): -0.26, n=29.Gross public debt (2023) and Political stability (2023): -0.64, n=29.Military spending (2023) and Political stability (2023): -0.28, n=29.Life expectancy (2023) and Political stability (2023): +0.06, n=29.Child mortality (2023) and Political stability (2023): -0.48, n=29.Health spending (2023) and Political stability (2023): +0.09, n=29.Out-of-pocket share (2023) and Political stability (2023): -0.07, n=29.Aged 65+ (2023) and Political stability (2023): -0.10, n=29.Fertility (2023) and Political stability (2023): -0.24, n=29.Female participation (2023) and Political stability (2023): +0.42, n=29.Unemployment (2023) and Political stability (2023): -0.22, n=29.Territorial CO₂ (2023) and Political stability (2023): -0.04, n=29.Voice & accountability (2023) and Political stability (2023): +0.41, n=29.Political stability (2023) and Political stability (2023): +1.00, n=29.Government effectiveness (2023) and Political stability (2023): +0.34, n=29.Regulatory quality (2023) and Political stability (2023): +0.37, n=29.Rule of law (2023) and Political stability (2023): +0.51, n=29.Control of corruption (2023) and Political stability (2023): +0.33, n=29.Output / person (2023) and Government effectiveness (2023): +0.84, n=29.Fixed investment (2023) and Government effectiveness (2023): +0.10, n=29.R&D share (2023) and Government effectiveness (2023): +0.69, n=29.Internet use (2023) and Government effectiveness (2023): +0.76, n=29.Industry employment (2023) and Government effectiveness (2023): -0.52, n=29.Trade openness (2023) and Government effectiveness (2023): +0.01, n=29.Government spending (2023) and Government effectiveness (2023): +0.16, n=29.Gross public debt (2023) and Government effectiveness (2023): -0.11, n=29.Military spending (2023) and Government effectiveness (2023): -0.36, n=29.Life expectancy (2023) and Government effectiveness (2023): +0.47, n=29.Child mortality (2023) and Government effectiveness (2023): -0.40, n=29.Health spending (2023) and Government effectiveness (2023): +0.85, n=29.Out-of-pocket share (2023) and Government effectiveness (2023): -0.68, n=29.Aged 65+ (2023) and Government effectiveness (2023): -0.17, n=29.Fertility (2023) and Government effectiveness (2023): -0.08, n=29.Female participation (2023) and Government effectiveness (2023): +0.66, n=29.Unemployment (2023) and Government effectiveness (2023): -0.11, n=29.Territorial CO₂ (2023) and Government effectiveness (2023): +0.39, n=29.Voice & accountability (2023) and Government effectiveness (2023): +0.89, n=29.Political stability (2023) and Government effectiveness (2023): +0.34, n=29.Government effectiveness (2023) and Government effectiveness (2023): +1.00, n=29.Regulatory quality (2023) and Government effectiveness (2023): +0.95, n=29.Rule of law (2023) and Government effectiveness (2023): +0.92, n=29.Control of corruption (2023) and Government effectiveness (2023): +0.93, n=29.Output / person (2023) and Regulatory quality (2023): +0.77, n=29.Fixed investment (2023) and Regulatory quality (2023): +0.11, n=29.R&D share (2023) and Regulatory quality (2023): +0.67, n=29.Internet use (2023) and Regulatory quality (2023): +0.73, n=29.Industry employment (2023) and Regulatory quality (2023): -0.49, n=29.Trade openness (2023) and Regulatory quality (2023): +0.07, n=29.Government spending (2023) and Regulatory quality (2023): +0.11, n=29.Gross public debt (2023) and Regulatory quality (2023): -0.23, n=29.Military spending (2023) and Regulatory quality (2023): -0.21, n=29.Life expectancy (2023) and Regulatory quality (2023): +0.31, n=29.Child mortality (2023) and Regulatory quality (2023): -0.41, n=29.Health spending (2023) and Regulatory quality (2023): +0.79, n=29.Out-of-pocket share (2023) and Regulatory quality (2023): -0.58, n=29.Aged 65+ (2023) and Regulatory quality (2023): -0.19, n=29.Fertility (2023) and Regulatory quality (2023): -0.07, n=29.Female participation (2023) and Regulatory quality (2023): +0.70, n=29.Unemployment (2023) and Regulatory quality (2023): -0.11, n=29.Territorial CO₂ (2023) and Regulatory quality (2023): +0.41, n=29.Voice & accountability (2023) and Regulatory quality (2023): +0.90, n=29.Political stability (2023) and Regulatory quality (2023): +0.37, n=29.Government effectiveness (2023) and Regulatory quality (2023): +0.95, n=29.Regulatory quality (2023) and Regulatory quality (2023): +1.00, n=29.Rule of law (2023) and Regulatory quality (2023): +0.94, n=29.Control of corruption (2023) and Regulatory quality (2023): +0.98, n=29.Output / person (2023) and Rule of law (2023): +0.71, n=29.Fixed investment (2023) and Rule of law (2023): +0.20, n=29.R&D share (2023) and Rule of law (2023): +0.60, n=29.Internet use (2023) and Rule of law (2023): +0.74, n=29.Industry employment (2023) and Rule of law (2023): -0.45, n=29.Trade openness (2023) and Rule of law (2023): +0.14, n=29.Government spending (2023) and Rule of law (2023): +0.11, n=29.Gross public debt (2023) and Rule of law (2023): -0.28, n=29.Military spending (2023) and Rule of law (2023): -0.34, n=29.Life expectancy (2023) and Rule of law (2023): +0.36, n=29.Child mortality (2023) and Rule of law (2023): -0.52, n=29.Health spending (2023) and Rule of law (2023): +0.72, n=29.Out-of-pocket share (2023) and Rule of law (2023): -0.46, n=29.Aged 65+ (2023) and Rule of law (2023): -0.10, n=29.Fertility (2023) and Rule of law (2023): -0.17, n=29.Female participation (2023) and Rule of law (2023): +0.68, n=29.Unemployment (2023) and Rule of law (2023): -0.02, n=29.Territorial CO₂ (2023) and Rule of law (2023): +0.24, n=29.Voice & accountability (2023) and Rule of law (2023): +0.96, n=29.Political stability (2023) and Rule of law (2023): +0.51, n=29.Government effectiveness (2023) and Rule of law (2023): +0.92, n=29.Regulatory quality (2023) and Rule of law (2023): +0.94, n=29.Rule of law (2023) and Rule of law (2023): +1.00, n=29.Control of corruption (2023) and Rule of law (2023): +0.94, n=29.Output / person (2023) and Control of corruption (2023): +0.72, n=29.Fixed investment (2023) and Control of corruption (2023): +0.11, n=29.R&D share (2023) and Control of corruption (2023): +0.71, n=29.Internet use (2023) and Control of corruption (2023): +0.72, n=29.Industry employment (2023) and Control of corruption (2023): -0.47, n=29.Trade openness (2023) and Control of corruption (2023): +0.01, n=29.Government spending (2023) and Control of corruption (2023): +0.22, n=29.Gross public debt (2023) and Control of corruption (2023): -0.21, n=29.Military spending (2023) and Control of corruption (2023): -0.16, n=29.Life expectancy (2023) and Control of corruption (2023): +0.33, n=29.Child mortality (2023) and Control of corruption (2023): -0.47, n=29.Health spending (2023) and Control of corruption (2023): +0.75, n=29.Out-of-pocket share (2023) and Control of corruption (2023): -0.54, n=29.Aged 65+ (2023) and Control of corruption (2023): -0.11, n=29.Fertility (2023) and Control of corruption (2023): -0.14, n=29.Female participation (2023) and Control of corruption (2023): +0.65, n=29.Unemployment (2023) and Control of corruption (2023): -0.03, n=29.Territorial CO₂ (2023) and Control of corruption (2023): +0.37, n=29.Voice & accountability (2023) and Control of corruption (2023): +0.93, n=29.Political stability (2023) and Control of corruption (2023): +0.33, n=29.Government effectiveness (2023) and Control of corruption (2023): +0.93, n=29.Regulatory quality (2023) and Control of corruption (2023): +0.98, n=29.Rule of law (2023) and Control of corruption (2023): +0.94, n=29.Control of corruption (2023) and Control of corruption (2023): +1.00, n=29.

One matrix column at a time: Health spending. Choose the horizontal variable above to explore another column.

−1 / inverse+1 / together

24 variables; 276 distinct pairs. The diagonal compares each variable with itself. A blank crossed cell is undefined, not zero.

Open the cell / inspect the observations

Health spending
& Life expectancy

Matched observations / 2023 · 29 countries · rank association

+0.61Spearman ρ
Descriptive, not causal
CanadaUnited StatesEU members
Health expenditure per person and Life expectancy: inspect the countries behind the correlationCanada is a red square, the US a black circle, and EU members blue triangles. Open symbols are contextual points excluded from an EU-only coefficient. The axes retain the source units; this is not a causal model.Life expectancy ↑Austria: 7,883.78 current international dollars; 81.79 years at birth. Included in correlation.Belgium: 7,489.31 current international dollars; 82.40 years at birth. Included in correlation.Bulgaria: 2,969.55 current international dollars; 75.76 years at birth. Included in correlation.Croatia: 3,229.34 current international dollars; 78.47 years at birth. Included in correlation.Cyprus: 4,537.68 current international dollars; 81.65 years at birth. Included in correlation.Czechia: 4,499.62 current international dollars; 79.83 years at birth. Included in correlation.Denmark: 7,097.51 current international dollars; 81.75 years at birth. Included in correlation.Estonia: 3,506.88 current international dollars; 78.79 years at birth. Included in correlation.Finland: 6,433.37 current international dollars; 81.59 years at birth. Included in correlation.France: 6,719.08 current international dollars; 82.83 years at birth. Included in correlation.Germany: 8,306.18 current international dollars; 81.04 years at birth. Included in correlation.Greece: 3,453.89 current international dollars; 81.74 years at birth. Included in correlation.Hungary: 2,875.21 current international dollars; 76.57 years at birth. Included in correlation.Ireland: 8,269.12 current international dollars; 82.81 years at birth. Included in correlation.Italy: 4,865.98 current international dollars; 83.35 years at birth. Included in correlation.Latvia: 3,033.87 current international dollars; 75.43 years at birth. Included in correlation.Lithuania: 3,818.70 current international dollars; 77.29 years at birth. Included in correlation.Luxembourg: 8,329.10 current international dollars; 83.31 years at birth. Included in correlation.Malta: 5,706.09 current international dollars; 83.36 years at birth. Included in correlation.Netherlands: 7,727.04 current international dollars; 81.86 years at birth. Included in correlation.Poland: 3,331.75 current international dollars; 78.26 years at birth. Included in correlation.Portugal: 4,678.85 current international dollars; 82.33 years at birth. Included in correlation.Romania: 2,614.09 current international dollars; 76.40 years at birth. Included in correlation.Slovak Republic: 3,230.25 current international dollars; 78.12 years at birth. Included in correlation.Slovenia: 4,948.57 current international dollars; 81.93 years at birth. Included in correlation.Spain: 4,934.95 current international dollars; 83.93 years at birth. Included in correlation.Sweden: 7,512.07 current international dollars; 83.31 years at birth. Included in correlation.Canada: 7,355.36 current international dollars; 81.63 years at birth. Included in correlation.United States: 13,473.19 current international dollars; 78.39 years at birth. Included in correlation.Health spending →
X / Health expenditure per personcurrent international dollars / 2023
Y / Life expectancyyears at birth / 2023

Canada: 7,355.36 current international dollars; 81.63 years at birth. Included in this coefficient. Axes remain fixed across this panel’s years; country focus does not alter the sample.

Twenty-seven of the 29 countries are EU members. This is the selected transatlantic comparison, not a representative global sample. A shared trend, an outlier or overlapping source construction can create association without identifying a mechanism.

Definitions and measurement limits for this pair
Health expenditure per person

PPP-adjusted current expenditure, not inflation-adjusted spending growth. Distinct from constant-price GDP per person.

Life expectancy

Period life expectancy; not the realized lifespan of a newborn or a causal health-system efficiency measure.

Coefficients use the reported point estimates. Source measurement and sampling uncertainty are not converted into a joint correlation confidence interval.

Read the selected country observations
Read all 276 distinct correlation pairs
Why the variable set changes between panels

The full profile keeps each indicator’s declared latest common year. Annual panels instead fix both the countries and the variables across the chosen window. PISA is not annual, and incompatible AI adoption surveys are excluded. Missing recent observations are never filled by an earlier year or zero.

Spearman uses average ranks for ties; Pearson uses the raw levels. All coefficients are descriptive. A yearly frame compares countries in that year; it does not estimate a time-series correlation from five or six observations. Undefined coefficients stay undefined. No significance stars or causal claims are inferred from this exploratory matrix.

10

The extended comparison

Canada sits near the seam.

The Atlantic Seam makes the choices visible: keep the country observations fixed and move the emphasis.

35

The Atlantic Seam

56 analytical weight-transfer paths / the same country observations / published baseline pinned

↗

A country held in the balance

How little moves
the verdict?

The country stays the same. Move the emphasis between two domains and follow Canada’s red thread across the dividing line.

56 available paths · 8 domains · the same 29 indicators

Your selected trajectoryOther weight choices50 = equal distance
The Atlantic Seam: the observations stay fixed while the analytical emphasis changesEvery route transfers weight between two domains while leaving all other effective weights fixed. These are model choices, not probability bands or changes to Canadian outcomes. Use the paired-domain controls or the keyboard slider for the same calculation.50Canada / proximity indexZoom: 47–56 of 0–100EU profile closerUS closerWeight reallocated / percentage points

Drag the red knot along the selected thread. Hover another thread to inspect it; click to choose it.

The Atlantic Seam: the observations stay fixed while the analytical emphasis changesEvery route transfers weight between two domains while leaving all other effective weights fixed. These are model choices, not probability bands or changes to Canadian outcomes. Use the paired-domain controls or the keyboard slider for the same calculation.50Canada / proximity indexZoom: 47–56 of 0–100EU profile closerUS closerWeight reallocatedpercentage points of the total 100%

One trajectory at a time. Drag the red knot, or use the slider below.

2.34 percentage points to the seam

Moving that share of total weight from health & financing to climate & energy reaches equal distance. It is a change to the analytical rule, not to Canadian outcomes.

The nearest crossings from this start

What this instrument changes

A donor can give up to half its starting weight; a recipient can at most double its weight, within the model’s multiplier limit. Other effective weights remain fixed. These paths are analytical choices, not forecasts, confidence bands or flows of people and money.

Read the model and its limits →
Open the thread Underlying indicators, values and sources

Health & financing: the observations do not move.

Symbols use the observed-country-range normalization from 0 to 1. The figures underneath retain their source units. Changing emphasis does not change any of these measurements.

Life expectancy
2024

years at birth

Life expectancy: the same source values under the selected weighting
Canada
82.11
US
78.89
EU profile
81.97
Source and definition

Period life expectancy; not the realized lifespan of a newborn or a causal health-system efficiency measure.

Under-five mortality
2024

per 1,000 live births

Under-five mortality: the same source values under the selected weighting
Canada
5.4
US
6.5
EU profile
3.7
Source and definition

Official model-based mortality probability; not a cohort death count. Infant mortality is excluded to reduce duplication.

Health expenditure per person
2023

current international dollars

Health expenditure per person: the same source values under the selected weighting
Canada
7,355.36
US
13,473.19
EU profile
4,865.98
Source and definition

PPP-adjusted current expenditure, not inflation-adjusted spending growth. Distinct from constant-price GDP per person.

Out-of-pocket financing
2023

% of current health expenditure

Out-of-pocket financing: the same source values under the selected weighting
Canada
15.2
US
10.93
EU profile
17.94
Source and definition

Financing mix, not the share of household income paid for care or a measure of unmet need.

Read every route and its exact boundary

Horizontal position is reallocated analytical weight, in percentage points of the total. Vertical position is the relative proximity index, with 50 denoting equal distance. Paths are deterministic model choices, not confidence intervals or predictions of changes in Canadian outcomes.

SourceAuthor calculations from the frozen 29-country proximity panel

Method & exact data

56 analytical weight-transfer paths / the same country observations / published baseline pinned. Horizontal position is reallocated analytical weight, in percentage points of the total. Vertical position is the relative proximity index, with 50 denoting equal distance. Paths are deterministic model choices, not confidence intervals or predictions of changes in Canadian outcomes.

Download published data / baseline model

The Atlantic Seam turns the weighting question into a direct experiment. At the published baseline, moving about 2.34 percentage points of total weight from health and financing to climate and energy reaches equal distance. Both domains begin at 12.5%; their weights become about 10.16% and 14.84%, while the other six remain fixed. A three-point transfer moves the index to 49.66. These are changes to the analytical rule, not changes in Canadian health, emissions or society.

The baseline is a numeric Gower-style distance. Each indicator is placed on the observed range of the fixed 29-country comparison, from zero to one. Absolute differences are averaged within each domain, then the eight domain distances receive equal weight. No direction is marked good or bad. A higher fertility rate, a larger military budget or more government expenditure simply describes another position.

Europe needs a definition before a distance can be calculated. The default is the coordinate-wise median of the current 27 member countries. This describes a constructed typical-member profile, not an official EU aggregate and not an actual country. The interface also offers the equal-member mean and a population-weighted profile, while the neighbor view retains all 27 national comparisons.

The resulting index is 100 times Canada's distance from the US divided by the sum of its distances from the US and EU profile. Fifty denotes equal distance. The baseline result is 51.2: a small lean toward the EU-member median, not a decisive classification. The unscaled distances are 0.223 to the US and 0.213 to the EU profile.

The underlying pattern is more informative. Production and innovative capacity, health, and demography pull toward the typical EU profile. Climate and energy, together with the selected learning outcomes, pull toward the US. Economic structure is nearly balanced. The institutional domain favors the EU reference only modestly and cannot turn this mixture into a categorical identity.

Inspect the assumptions

Choose what “close” means.

These controls define the starting model for the seam. Changing a model choice retains your current multipliers and starts a new, zero-transfer path. Figure downloads retain the published baseline; “Download selected model” exports the exact current calculation, including any transfer.

Change the emphasis of the eight domains

A multiplier of zero omits the domain; one keeps its default emphasis. Weights are renormalized across the remaining domains.

36

The EU profile is a reference point, not the whole of Europe.

29 indicators / 8 domains / two exact distances

↗
Two distances, not a geographic or principal-component mapNearer USNearer EU profileAustria: US distance 0.31; EU-profile distance 0.14.Belgium: US distance 0.26; EU-profile distance 0.17.Bulgaria: US distance 0.47; EU-profile distance 0.29.Croatia: US distance 0.39; EU-profile distance 0.17.Cyprus: US distance 0.37; EU-profile distance 0.21.Czechia: US distance 0.34; EU-profile distance 0.12.Denmark: US distance 0.35; EU-profile distance 0.18.Estonia: US distance 0.38; EU-profile distance 0.21.Finland: US distance 0.37; EU-profile distance 0.22.France: US distance 0.26; EU-profile distance 0.16.Germany: US distance 0.26; EU-profile distance 0.13.Greece: US distance 0.44; EU-profile distance 0.26.Hungary: US distance 0.38; EU-profile distance 0.14.Ireland: US distance 0.35; EU-profile distance 0.26.Italy: US distance 0.37; EU-profile distance 0.15.Latvia: US distance 0.41; EU-profile distance 0.17.Lithuania: US distance 0.37; EU-profile distance 0.15.Luxembourg: US distance 0.40; EU-profile distance 0.32.Malta: US distance 0.40; EU-profile distance 0.25.Netherlands: US distance 0.29; EU-profile distance 0.17.Poland: US distance 0.33; EU-profile distance 0.18.Portugal: US distance 0.37; EU-profile distance 0.12.Romania: US distance 0.44; EU-profile distance 0.25.Slovak Republic: US distance 0.35; EU-profile distance 0.13.Slovenia: US distance 0.34; EU-profile distance 0.10.Spain: US distance 0.34; EU-profile distance 0.14.Sweden: US distance 0.39; EU-profile distance 0.22.Canada: US distance 0.22; EU-profile distance 0.21.CanadaUnited States: US distance 0.00; EU-profile distance 0.31.USDistance to the United States →Distance to EU profile ↑

Hover or tap a country, use the figure arrow keys, or select a neighbor below.

Read both distances for all 29 countries

This is a map of two calculated distances, not physical geography, a PCA projection or a causal model. Nearby points on this page are not necessarily close in every underlying dimension.

SourceAuthor calculations from the frozen, source-linked 29-country panel

Method & exact data

29 indicators / 8 domains / two exact distances. This is a map of two calculated distances, not physical geography, a PCA projection or a causal model. Nearby points on this page are not necessarily close in every underlying dimension.

Download published data / baseline model
37

A country comparison can be more informative than a continental label.

Distance from Canada / all 27 EU members and the United States / lower is closer

↗

The reference universe is fixed before estimation. The UK, Australia and other plausible peers are outside this particular US-versus-EU question; their absence is not evidence that they are less similar.

SourceAuthor calculations from the frozen, source-linked 29-country panel

Method & exact data

Distance from Canada / all 27 EU members and the United States / lower is closer. The reference universe is fixed before estimation. The UK, Australia and other plausible peers are outside this particular US-versus-EU question; their absence is not evidence that they are less similar.

Download published data / baseline model
38

Different parts of the Canadian profile pull in different directions.

Absolute-distance gap decomposition / positive favors proximity to EU profile

↗
What moves the proximity verdictUS sideEU sideProduction & innovation: weighted contribution 0.01433882873690505. Weight 12.5%.Production & innovation1.43Economic structure: weighted contribution -0.0006531212855706708. Weight 12.5%.Economic structure-0.07Public finance & defence: weighted contribution 0.008094158073182308. Weight 12.5%.Public finance & defence0.81Health & financing: weighted contribution 0.02027627539156359. Weight 12.5%.Health & financing2.03Demography & labour: weighted contribution 0.016456445612143433. Weight 12.5%.Demography & labour1.65Climate & energy: weighted contribution -0.035956742687024854. Weight 12.5%.Climate & energy-3.60Learning: weighted contribution -0.018128170880057845. Weight 12.5%.Learning-1.81Institutions: weighted contribution 0.006077772416496163. Weight 12.5%.Institutions0.61Contribution × 100 / signed distance units

Hover or tap a domain row. Keyboard users can focus the figure and use the arrow keys.

Read the eight domain contributions

Contributions add to the distance gap under L1, or the squared-distance gap under L2. Zero weight removes a domain from the selected scenario. This is a decomposition of the index, not a causal attribution.

SourceAuthor calculations from the frozen, source-linked 29-country panel

Method & exact data

Absolute-distance gap decomposition / positive favors proximity to EU profile. Contributions add to the distance gap under L1, or the squared-distance gap under L2. Zero weight removes a domain from the selected scenario. This is a decomposition of the index, not a causal attribution.

Download published data / baseline model

The synthetic EU profile should not erase Europe. Austria, Belgium, the Netherlands and Germany are individually closer to Canada than the United States under the baseline; the other 23 EU members are not. A continental median can be near Canada even though most of its member countries are farther away. Those statements are compatible because the median profile is not any one member.

The method choice is consequential. Across the 24 declared combinations of range or percentile normalization, L1 or Euclidean distance, three EU reference profiles and two weighting conventions, the index ranges from 48.9 to 54.9. Percentile normalization alone moves the baseline to 48.9, slightly toward the US. No result in this set establishes a wide separation from the midpoint.

39

The slight baseline lean does not survive every reasonable choice.

24 prespecified model combinations / sorted proximity scores / 50 means equal distance

↗
A prespecified sensitivity curve, not a sampling distribution455055EU proximity index / zoomed axisShown: 45–55 of the full 0–100 scalerank; l1; EU median; weights domains: 48.89rank; l1; EU mean; weights domains: 49.55rank; l1; EU population; weights domains: 50.16rank; l1; EU median; weights indicators: 50.29range; l2; EU median; weights domains: 50.45range; l2; EU mean; weights domains: 50.75rank; l1; EU mean; weights indicators: 51.08range; l1; EU median; weights domains: 51.20range; l2; EU population; weights domains: 51.23rank; l1; EU population; weights indicators: 51.46range; l1; EU mean; weights domains: 51.97range; l1; EU population; weights domains: 52.19rank; l2; EU median; weights domains: 52.45rank; l2; EU mean; weights domains: 52.74rank; l2; EU population; weights domains: 53.18rank; l2; EU median; weights indicators: 53.28rank; l2; EU mean; weights indicators: 53.69rank; l2; EU population; weights indicators: 53.81range; l2; EU median; weights indicators: 54.26range; l1; EU median; weights indicators: 54.37range; l2; EU mean; weights indicators: 54.50range; l2; EU population; weights indicators: 54.70range; l1; EU population; weights indicators: 54.76range; l1; EU mean; weights indicators: 54.8916121824Specifications / sorted by score
Every dot has a different analytical recipe.

Hover or tap a point. Focus the figure and use the arrow keys to inspect the same choices without a pointer.

Separately, 512 bounded domain-weight scenarios range from 44.9 to 56.6. Each multiplier varies from 0.5 to 2.0. These choices are not draws from a population, and their frequency is not a probability.

Read all 24 model specifications

The curve varies normalization, distance, EU reference and domain-versus-indicator weighting. Its range is researcher-choice sensitivity, not a confidence interval or probability distribution. The separate bounded-weight exercise contains 512 declared scenarios.

SourceDeterministic sensitivity analysis of the frozen country panel

Method & exact data

24 prespecified model combinations / sorted proximity scores / 50 means equal distance. The curve varies normalization, distance, EU reference and domain-versus-indicator weighting. Its range is researcher-choice sensitivity, not a confidence interval or probability distribution. The separate bounded-weight exercise contains 512 declared scenarios.

Download published data / all specifications

Domain emphasis matters more. Across 512 deterministic scenarios in which each domain multiplier lies between 0.5 and 2, the range is 44.9 to 56.6. This is not a confidence interval and the share of scenarios on either side is not a probability. It is a map of researcher choices within a stated box.

Omitting one indicator at a time produces a wider range, 44.7 to 58.7. That is a useful warning about the leverage of individual measures and the cardinal distances implied by normalization. Removing an inconvenient indicator would be a way to manufacture a headline; showing the omission range makes that maneuver visible.

On the matched 26-indicator subset that excludes the unavailable 2019 learning assessment, the index is 52.8 in 2019 and 53.6 in the recent comparison. The small movement should not be oversold: ranges are normalized within each period, so this compares relative profiles rather than estimating an absolute institutional trajectory.

The truth contract of the score

Reproduce the comparison. Keep its limits attached.

Baseline: 29 indicators, eight equal domains, the fixed 29-country universe, and a coordinate-wise EU27 member median. Each indicator uses one common year for every country. The latest available common years are 2021, 2023 and 2024, with the separately labeled PISA 2025 survey domain. This is a mixed-year comparison, not an invented all-current snapshot.

Numeric Gower distance uses the observed country range to put each measure on a zero-to-one scale. Absolute normalized differences are averaged within domains, then domains receive equal weight. The EU proximity index is 100 × d(Canada,US) / [d(Canada,US) + d(Canada,EU)]. No good/bad polarity is assigned. Gower’s general similarity framework and the OECD/JRC guidance on composite indicators motivate explicit normalization, weighting and sensitivity rather than hidden aggregation.

EU reference coordinates are formed after normalization. Under the percentile alternative, a member mean is therefore a mean of member percentile positions, not the percentile rank of a mean raw value. Published raw summaries and normalized comparison coordinates remain separate in the selected-model export.

Equal-domain weights are an editorial choice, not an estimated social preference. They stop six governance variables from automatically counting six times as much as one health variable, but they do not remove conceptual correlation. The normalization universe is mostly European by construction; the percentile alternative makes that choice particularly visible.

Measurement uncertainty remains distinct from these choice exercises. WGI publishes uncertainty around its institutional estimates; PISA publishes sampling uncertainty around country means. A joint covariance structure for all countries and indicators is not available here, so the analysis does not manufacture a statistical confidence interval for the final proximity index.

The 512 weight scenarios use a fixed low-discrepancy sequence with each domain multiplier between 0.5 and 2.0. No random seed, fitted probability model or sampling distribution is implied. Leave-one-domain and leave-one-indicator results expose influence. A covariance-based Mahalanobis model was rejected as the baseline because 29 variables with 29 countries make an unregularized covariance geometry unstable; a two-dimensional PCA picture would not preserve all distances.

Included indicators, years and source definitions
What was excluded, and why
  • Enterprise AI adoption. National survey universes, definitions and reference windows must be harmonized before direct scoring. The comparison audit is shown separately.
  • Manufacturing value added. No common 2020-2024 observation for all 29 countries in the frozen source; Bulgaria is missing. Do not omit a member to improve coverage.
  • Tertiary attainment. The existing three-bloc age25-34 comparison does not contain all 27 members; the older WDI25-plus series lacks a complete common year.
  • Public education expenditure. The declared 2020-2024 window has no complete 29-country year; an EU median of26 reporting members is not a substitute for the missing country.
  • Population and total GDP. Deliberately excluded: the score describes structure and institutions, not similarity of geographic size.
  • Revenue, deficit, imports and exports as additional votes. Avoid re-entering accounting identities beside expenditure and total trade openness. They remain available as contextual evidence.
Correlated inputs are not independent votes

These selected Spearman correlations exceed an absolute 0.8 within the 29-country panel. They are descriptive diagnostics, not tests of independence or a reason to choose whichever exclusion changes the headline.

  • Regulatory quality / Control of corruption: 0.97 (same domain)
  • Voice and accountability / Rule of law: 0.96 (same domain)
  • Regulatory quality / Rule of law: 0.95 (same domain)
  • Government effectiveness / Control of corruption: 0.95 (same domain)
  • Rule of law / Control of corruption: 0.95 (same domain)
  • Government effectiveness / Regulatory quality: 0.95 (same domain)
  • Output per person / Health expenditure per person: 0.94 (different domains)
  • Government effectiveness / Rule of law: 0.94 (same domain)
  • Voice and accountability / Control of corruption: 0.93 (same domain)
  • PISA science / PISA reading: 0.91 (same domain)
  • Voice and accountability / Regulatory quality: 0.91 (same domain)
  • Voice and accountability / Government effectiveness: 0.91 (same domain)
  • PISA science / PISA mathematics: 0.84 (same domain)
  • Health expenditure per person / Government effectiveness: 0.81 (different domains)

The complete evidence ZIP also contains a dependency-free reproduction: from its extension directory, run node reproduce/run.mjs. It reads the exact packaged input data and reproduces the baseline, domain contributions, nearest countries and sensitivity ranges without downloading anything.

Sources for the extension

Sources, versions and boundaries

All raw source versions and transformations are hash-bound. Polity’s full resources, the unresolved IDEA numerical extract and complete third-party reports are not included in the public evidence package. No new source was selected because it made Canada look more American or more European.

The implication

Not one winner.
Better questions.

The comparison does not end with a winner because the measures did not ask one common question. America's resource advantage invites a harder examination of social outcomes. Europe's aggregate invites scrutiny of internal differences and the capacity to sustain future investment. Canada's position invites scrutiny of per-person growth and the concentration of commercial relationships.

For policy, the useful next step is to name the outcome, choose the denominator and identify the evidence that could distinguish competing explanations. A spending ratio can start that inquiry. A historical path can constrain it. A country ranking cannot complete it.

Carry a comparison away, but keep its boundary attached. The strongest version of the good life is not the one that wins the most columns. It is the one whose claims survive the change from a national story to the people, institutions and dependencies that story is meant to describe.

The audit stays attached

What this comparison can carry.

A frozen evidence snapshot collected on September 17, 2026. Each exhibit retains its own source, reference period, units and limitations.

Observed and derived

Frozen official historical series and deterministic transformations. IMF historical entries can include staff estimates; mortality indicators include official modeled estimates. No forecasts or policy scenarios are presented as outcomes.

Different common years

Most annual series end in 2024. The joint health comparison and R&D end in 2023; public education spending uses 2021; PISA and merchandise trade use 2025. There is no all-current synthetic year.

An indicator-specific Europe

Fixed EU27 membership. Published WDI aggregates where defensible; GDP-weighted national-government expenditure; a 26-member median for education spending; individual countries, never a fabricated student aggregate, for PISA.

No causal tournament

Country differences do not identify the effects of spending, immigration, regulation or institutional models. Alternative explanations and unobserved composition remain beside the affected claims.

Different distributions

Country dispersion is not household dispersion. PISA percentile ranges describe students; confidence intervals describe uncertainty around means. The two are not interchangeable.

A partial account of the good life

Median consumption, wealth, leisure, housing affordability, access, subjective well-being, services trade and causal institutional effects are outside the harmonized evidence here. They are unavailable for this comparison, not zero.

How to reproduce the reading

Every plot comes from the frozen source observations. The recovery series sets each country's 2019 output per person to 100. Economic-size squares use square-root scaling; R&D ranks use unrounded shares. The map colors country membership, not population density. Age-composition cells represent percentage points, with an exact under-65 complement and fractional cells.

Germany, France, Sweden, Poland and Spain add context to health and child mortality from the same frozen World Bank extracts. They are inside the EU aggregate, not an independent control group. The PISA subject profiles retain all 87 supplied confidence limits. The chord preserves exporter direction; its arcs are not world trade shares. Full source precision stays in the downloads, while visible labels use at most two decimals.

Country distributions are unweighted collections of named countries. Official EU totals and averages are not replaced with a universal mean. The complete method document records source vintage, aggregation, price bases, mortality estimation, survey qualifications and trade reporting differences.
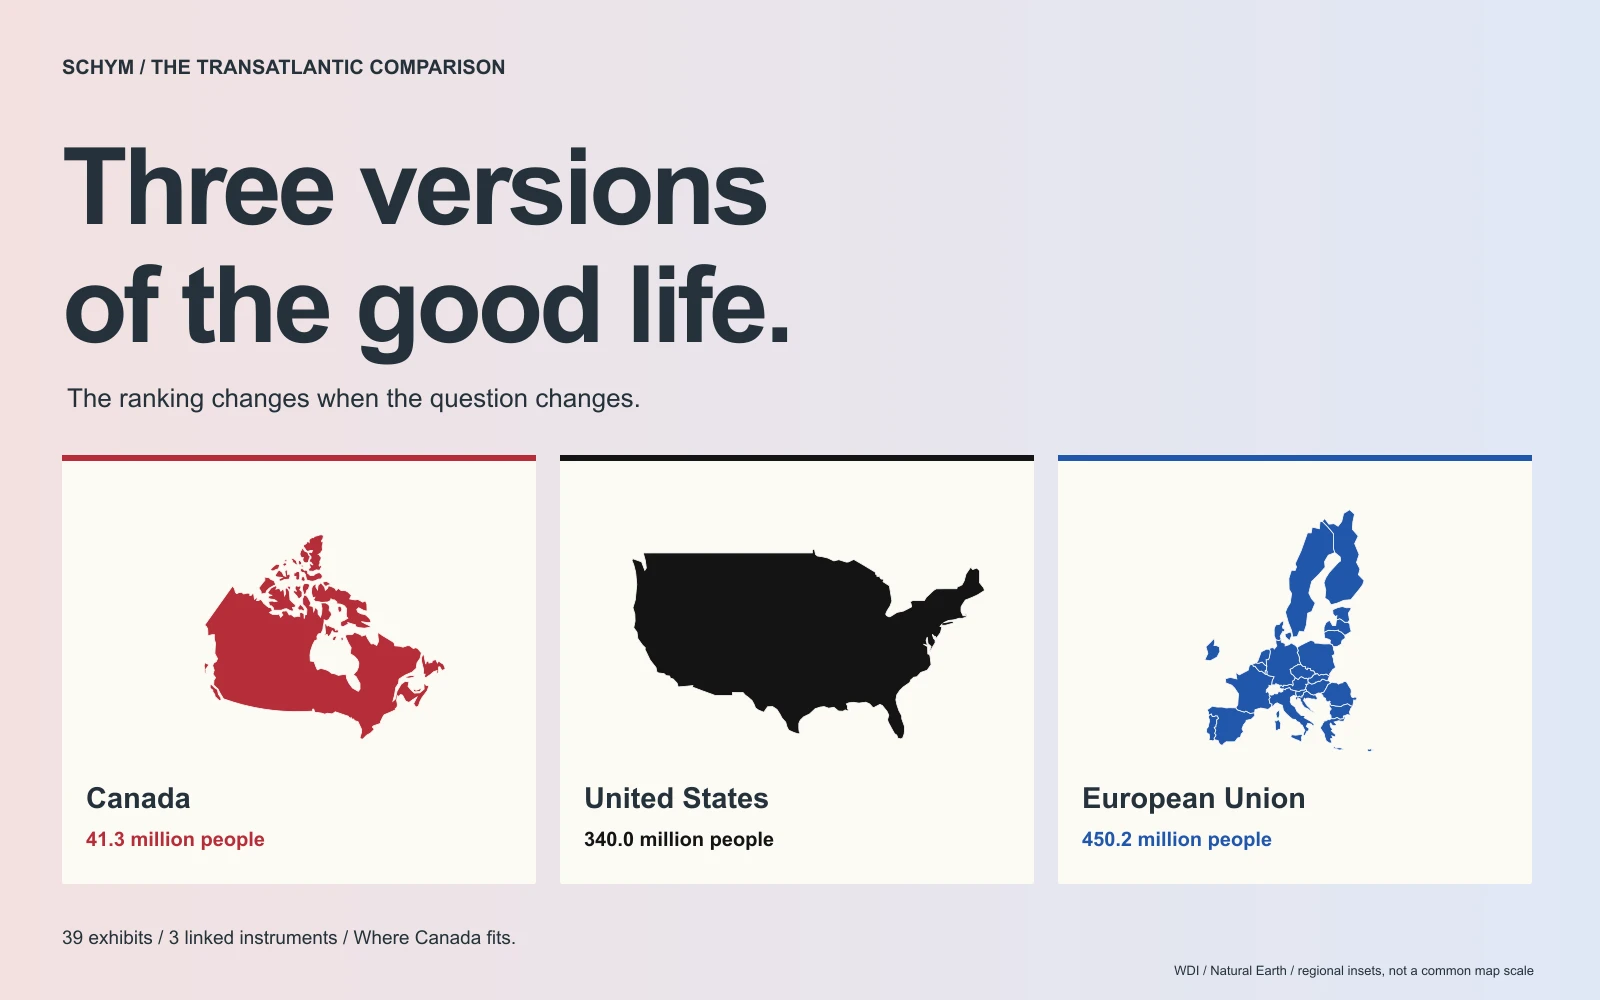
Complete evidence & artwork pack ZIP ↗All 29 figure specifications JSON ↗Extended comparison data JSON ↗Editable article source JSON ↗Full methods & definitions MD ↗Independent evidence checks JSON ↗Your selected evidence card EXPORT ↑The three-country hero WEBP ↗

Evidence edition: 17 September 2026 / Native revision: atlantic-r6. The 39 numbered exhibits and their anchors remain intact. Three linked instruments add the metric spotlight, Rank Weave and Relationship Atlas; the Atlantic Seam retains its exact weight-transfer paths. The source observations are unchanged. CSVs remain available with their methods. Earlier carousel and social files are not presented as revised versions of this website.

Primary evidence

Source register

Publisher links identify the underlying series and reports. The article uses the frozen package snapshot rather than silently replacing it with later observations. Source-specific rights remain in force; there is no blanket license covering the mixed World Bank, IMF and national-agency material.

  1. World Bank WDI · SP.POP.TOTL
    Attribution & reuse

    World Bank, World Development Indicators; upstream providers named in indicator metadata. World Bank open-data terms; CC BY 4.0 default for World Bank-produced data, with third-party exceptions.

    Frozen public API numerical extract; indicator definitions and upstream attribution retained. https://datacatalog.worldbank.org/public-licenses

  2. Natural Earth · 1:110m country boundaries (public domain)
    Attribution & reuse

    Natural Earth. Public domain

    Generalized geographic orientation only. https://www.naturalearthdata.com/about/terms-of-use/

  3. World Bank WDI · NY.GDP.MKTP.CD
    Attribution & reuse

    World Bank, World Development Indicators; upstream providers named in indicator metadata. World Bank open-data terms; CC BY 4.0 default for World Bank-produced data, with third-party exceptions.

    Frozen public API numerical extract; indicator definitions and upstream attribution retained. https://datacatalog.worldbank.org/public-licenses

  4. World Bank WDI · NY.GDP.PCAP.PP.KD
    Attribution & reuse

    World Bank, World Development Indicators; upstream providers named in indicator metadata. World Bank open-data terms; CC BY 4.0 default for World Bank-produced data, with third-party exceptions.

    Frozen public API numerical extract; indicator definitions and upstream attribution retained. https://datacatalog.worldbank.org/public-licenses

  5. World Bank WDI · NY.GDP.MKTP.KD.ZG
    Attribution & reuse

    World Bank, World Development Indicators; upstream providers named in indicator metadata. World Bank open-data terms; CC BY 4.0 default for World Bank-produced data, with third-party exceptions.

    Frozen public API numerical extract; indicator definitions and upstream attribution retained. https://datacatalog.worldbank.org/public-licenses

  6. World Bank WDI · NY.GDP.PCAP.KD.ZG
    Attribution & reuse

    World Bank, World Development Indicators; upstream providers named in indicator metadata. World Bank open-data terms; CC BY 4.0 default for World Bank-produced data, with third-party exceptions.

    Frozen public API numerical extract; indicator definitions and upstream attribution retained. https://datacatalog.worldbank.org/public-licenses

  7. World Bank WDI · NE.GDI.FTOT.ZS
    Attribution & reuse

    World Bank, World Development Indicators; upstream providers named in indicator metadata. World Bank open-data terms; CC BY 4.0 default for World Bank-produced data, with third-party exceptions.

    Frozen public API numerical extract; indicator definitions and upstream attribution retained. https://datacatalog.worldbank.org/public-licenses

  8. World Bank WDI · GB.XPD.RSDV.GD.ZS
    Attribution & reuse

    World Bank, World Development Indicators; upstream providers named in indicator metadata. World Bank open-data terms; CC BY 4.0 default for World Bank-produced data, with third-party exceptions.

    Frozen public API numerical extract; indicator definitions and upstream attribution retained. https://datacatalog.worldbank.org/public-licenses

  9. World Bank WDI · NE.CON.GOVT.ZS
    Attribution & reuse

    World Bank, World Development Indicators; upstream providers named in indicator metadata. World Bank open-data terms; CC BY 4.0 default for World Bank-produced data, with third-party exceptions.

    Frozen public API numerical extract; indicator definitions and upstream attribution retained. https://datacatalog.worldbank.org/public-licenses

  10. World Bank WDI · MS.MIL.XPND.GD.ZS
    Attribution & reuse

    World Bank, World Development Indicators; upstream providers named in indicator metadata. World Bank open-data terms; CC BY 4.0 default for World Bank-produced data, with third-party exceptions.

    Frozen public API numerical extract; indicator definitions and upstream attribution retained. https://datacatalog.worldbank.org/public-licenses

  11. IMF Fiscal Monitor · G_X_G01_GDP_PT
    Attribution & reuse

    International Monetary Fund. IMF copyright and usage terms; official numerical extract with attribution.

    Author calculations use frozen numerical series. No IMF endorsement. Historical values may include IMF staff estimates.

  12. IMF WEO nominal GDP used to weight EU27 fiscal ratios
    Attribution & reuse

    International Monetary Fund. IMF copyright and usage terms; official numerical extract with attribution.

    Author calculations use frozen numerical series. No IMF endorsement. Historical values may include IMF staff estimates.

  13. IMF Fiscal Monitor methodological and statistical appendix
    Attribution & reuse

    International Monetary Fund. IMF copyright and usage terms; official numerical extract with attribution.

    Author calculations use frozen numerical series. No IMF endorsement. Historical values may include IMF staff estimates.

  14. World Bank WDI · SH.XPD.CHEX.PP.CD
    Attribution & reuse

    World Bank, World Development Indicators; upstream providers named in indicator metadata. World Bank open-data terms; CC BY 4.0 default for World Bank-produced data, with third-party exceptions.

    Frozen public API numerical extract; indicator definitions and upstream attribution retained. https://datacatalog.worldbank.org/public-licenses

  15. World Bank WDI · SP.DYN.LE00.IN
    Attribution & reuse

    World Bank, World Development Indicators; upstream providers named in indicator metadata. World Bank open-data terms; CC BY 4.0 default for World Bank-produced data, with third-party exceptions.

    Frozen public API numerical extract; indicator definitions and upstream attribution retained. https://datacatalog.worldbank.org/public-licenses

  16. World Bank WDI · SP.DYN.LE00.MA.IN
    Attribution & reuse

    World Bank, World Development Indicators; upstream providers named in indicator metadata. World Bank open-data terms; CC BY 4.0 default for World Bank-produced data, with third-party exceptions.

    Frozen public API numerical extract; indicator definitions and upstream attribution retained. https://datacatalog.worldbank.org/public-licenses

  17. World Bank WDI · SP.DYN.LE00.FE.IN
    Attribution & reuse

    World Bank, World Development Indicators; upstream providers named in indicator metadata. World Bank open-data terms; CC BY 4.0 default for World Bank-produced data, with third-party exceptions.

    Frozen public API numerical extract; indicator definitions and upstream attribution retained. https://datacatalog.worldbank.org/public-licenses

  18. World Bank WDI · SH.DYN.MORT
    Attribution & reuse

    World Bank, World Development Indicators; upstream providers named in indicator metadata. World Bank open-data terms; CC BY 4.0 default for World Bank-produced data, with third-party exceptions.

    Frozen public API numerical extract; indicator definitions and upstream attribution retained. https://datacatalog.worldbank.org/public-licenses

  19. World Bank WDI · SH.XPD.GHED.CH.ZS
    Attribution & reuse

    World Bank, World Development Indicators; upstream providers named in indicator metadata. World Bank open-data terms; CC BY 4.0 default for World Bank-produced data, with third-party exceptions.

    Frozen public API numerical extract; indicator definitions and upstream attribution retained. https://datacatalog.worldbank.org/public-licenses

  20. World Bank WDI · SH.XPD.OOPC.CH.ZS
    Attribution & reuse

    World Bank, World Development Indicators; upstream providers named in indicator metadata. World Bank open-data terms; CC BY 4.0 default for World Bank-produced data, with third-party exceptions.

    Frozen public API numerical extract; indicator definitions and upstream attribution retained. https://datacatalog.worldbank.org/public-licenses

  21. World Bank WDI · SE.XPD.TOTL.GD.ZS
    Attribution & reuse

    World Bank, World Development Indicators; upstream providers named in indicator metadata. World Bank open-data terms; CC BY 4.0 default for World Bank-produced data, with third-party exceptions.

    Frozen public API numerical extract; indicator definitions and upstream attribution retained. https://datacatalog.worldbank.org/public-licenses

  22. OECD PISA 2025 · CMEC official report, tables B.1.2 / B.3.3–5
    Attribution & reuse

    Council of Ministers of Education, Canada; OECD PISA. ©2026 Council of Ministers of Education, Canada; no blanket redistribution licence asserted.

    Published numerical summaries extracted from B.1.2, B.3.3, B.3.4 (means) and B.1.5, B.3.5, B.3.6 (percentiles). Full report is obtained from this official URL using the acquisition manifest; the public package contains numerical extracts and extraction code.

  23. Eurostat EDAT_LFSE_03
    Attribution & reuse

    European Commission / Eurostat. EU reuse policy: CC BY 4.0 for EU-owned content unless otherwise indicated; third-party rights remain.

    Attributed numerical extract or paraphrased policy fact. https://commission.europa.eu/legal-notice_en

  24. Statistics Canada Table37-10-0130-01; Labour Force Survey
    Attribution & reuse

    Statistics Canada. Statistics Canada Open Licence

    Adapted from Statistics Canada, Table37-10-0130-01, 2024. This does not constitute an endorsement by Statistics Canada of this product. https://www.statcan.gc.ca/en/terms-conditions/open-licence

  25. US Census Bureau CPS2024 Table1; calculation from age25–29 and30–34 counts
    Attribution & reuse

    United States Census Bureau. US federal government statistical work; source attribution retained.

    Original published counts retained; author calculated age25–34 associate-or-higher share. No endorsement.

  26. World Bank WDI · SP.POP.65UP.TO.ZS
    Attribution & reuse

    World Bank, World Development Indicators; upstream providers named in indicator metadata. World Bank open-data terms; CC BY 4.0 default for World Bank-produced data, with third-party exceptions.

    Frozen public API numerical extract; indicator definitions and upstream attribution retained. https://datacatalog.worldbank.org/public-licenses

  27. World Bank WDI · SP.DYN.TFRT.IN
    Attribution & reuse

    World Bank, World Development Indicators; upstream providers named in indicator metadata. World Bank open-data terms; CC BY 4.0 default for World Bank-produced data, with third-party exceptions.

    Frozen public API numerical extract; indicator definitions and upstream attribution retained. https://datacatalog.worldbank.org/public-licenses

  28. World Bank WDI · EN.GHG.CO2.PC.CE.AR5
    Attribution & reuse

    World Bank, World Development Indicators; upstream providers named in indicator metadata. World Bank open-data terms; CC BY 4.0 default for World Bank-produced data, with third-party exceptions.

    Frozen public API numerical extract; indicator definitions and upstream attribution retained. https://datacatalog.worldbank.org/public-licenses

  29. European Commission DG Trade · 2025 goods flows
    Attribution & reuse

    European Commission DG Trade. EU reuse policy: CC BY 4.0 for EU-owned content unless otherwise indicated; third-party rights remain.

    Attributed numerical extract or paraphrased policy fact. https://commission.europa.eu/legal-notice_en

  30. European Commission DG Trade · 2025 goods flows
    Attribution & reuse

    European Commission DG Trade. EU reuse policy: CC BY 4.0 for EU-owned content unless otherwise indicated; third-party rights remain.

    Attributed numerical extract or paraphrased policy fact. https://commission.europa.eu/legal-notice_en

More data storiesSite sitemapBack to the top ↑