
CLIM-18 / ENERGY SYSTEMS / SEPTEMBER 2026
The moving target for clean power
The machines are becoming cleaner. The system is getting larger. From a turbine's hidden drivetrain to the electricity accounts of major economies, follow why more clean power does not always mean less fossil generation.
Anthony Quintano / CC BY 2.0 Context photograph. Not evidence of a measured trend.
A wind turbine turns a variable resource into mechanical rotation and electrical output. Its nameplate is a rating, not an annual production total.
Annual TWh add up actual output and published estimates through time. Wind, weather, availability and system conditions affect that total.
Additional clean generation enters a changing electricity system. The fossil result depends on total generation and the rest of the source mix.
Start with the electricity, not the announcement.
A new solar park is visible. An avoided megawatt-hour is not. Between the investment announcement and a change in fossil generation sit weather, nuclear availability, trade, industrial activity and the size of the electricity system itself. Capacity tells us what equipment is installed. Annual generation tells us what it produced.
The first task is therefore modest, but consequential: reconcile the electricity account before interpreting it. If total generation grows faster than clean generation, fossil output can rise even as its share falls. If total generation contracts, fossil output can fall without an equivalent increase in clean generation. Neither observation, by itself, identifies the effect of a policy.
Start inside an original wind-turbine cutaway, where the mechanism is visible but no national statistics are encoded. Then carry a country and two years through the evidence. Hold total generation still in a separate arithmetic experiment, without allowing that experiment to overwrite the historical record.
The country comparison now distinguishes a complete fuel account from a usable aggregate account with incomplete detail. A missing fuel observation is not a reason to invent zero, but it need not erase the information a source actually publishes about a major electricity system.
Inside the machine / original Blender study
Before the gigawatt-hours, there is a machine.
Open a geared wind turbine. Inspect the rotor, the drivetrain and the generator. Then cross the boundary from physical capability to measured electricity.
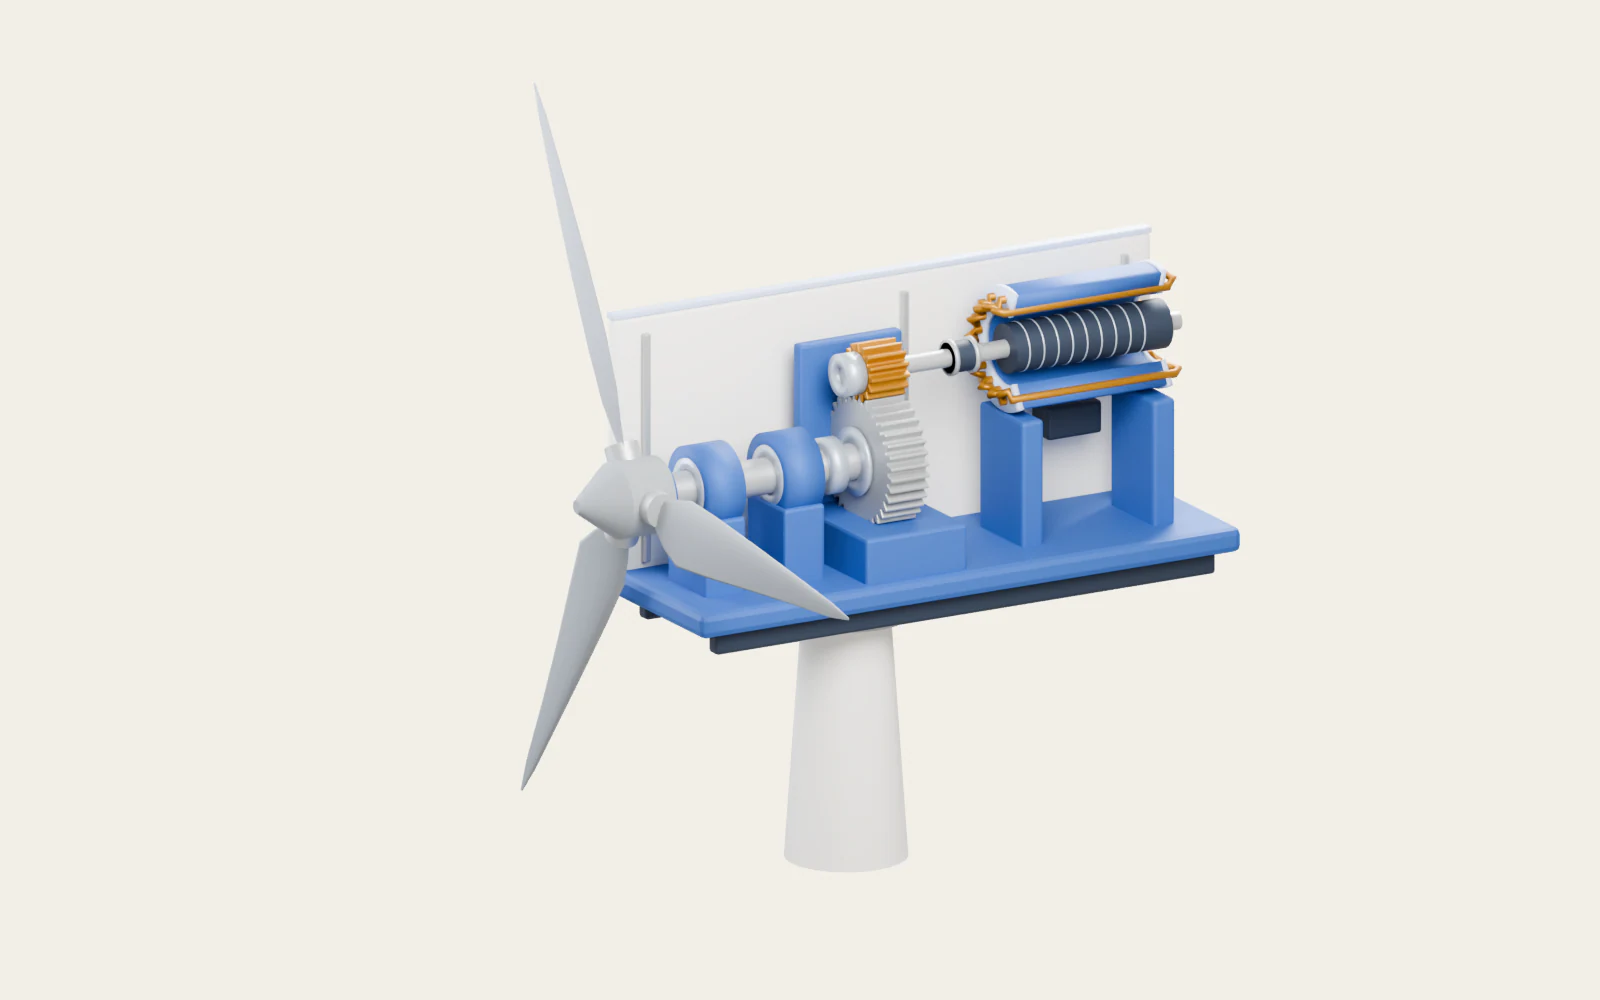
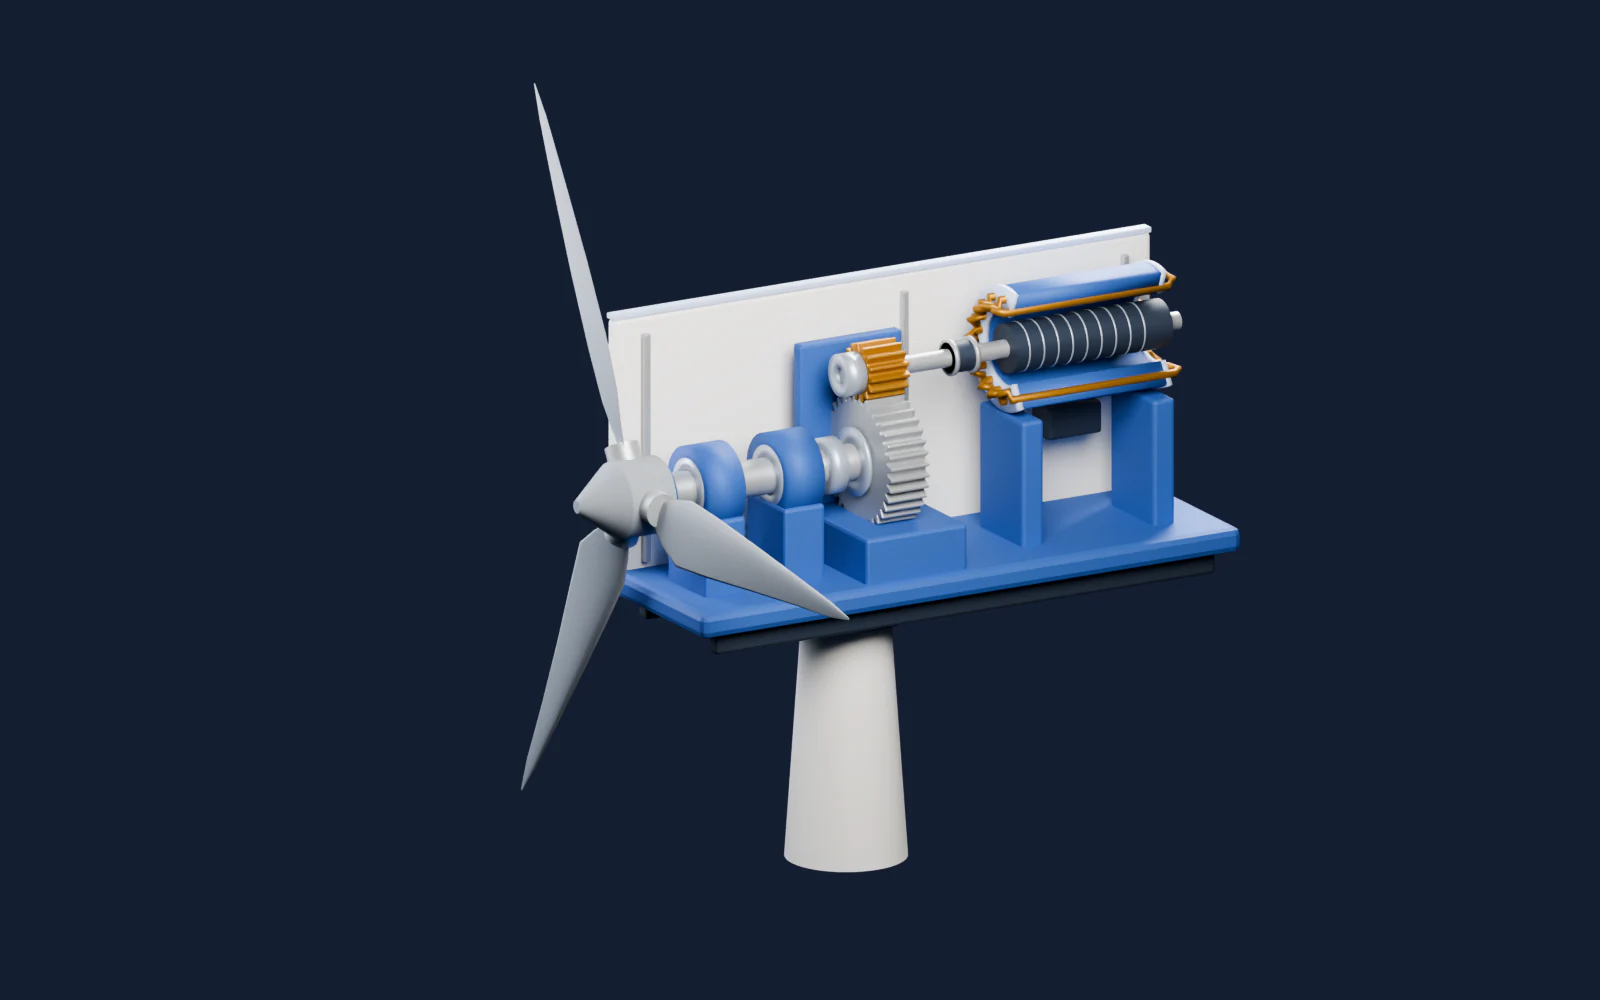
Drag to inspect the nacelle. Arrow keys select components; R resets the view. Rotor angle is a discrete inspection control, not a speed or energy estimate.
Illustrated cutaway. All conclusions remain readable without 3D.
1 MWfor1 hour=1 MWh
A unit identity at constant power, not a claim that any turbine operates at its rating for an entire year.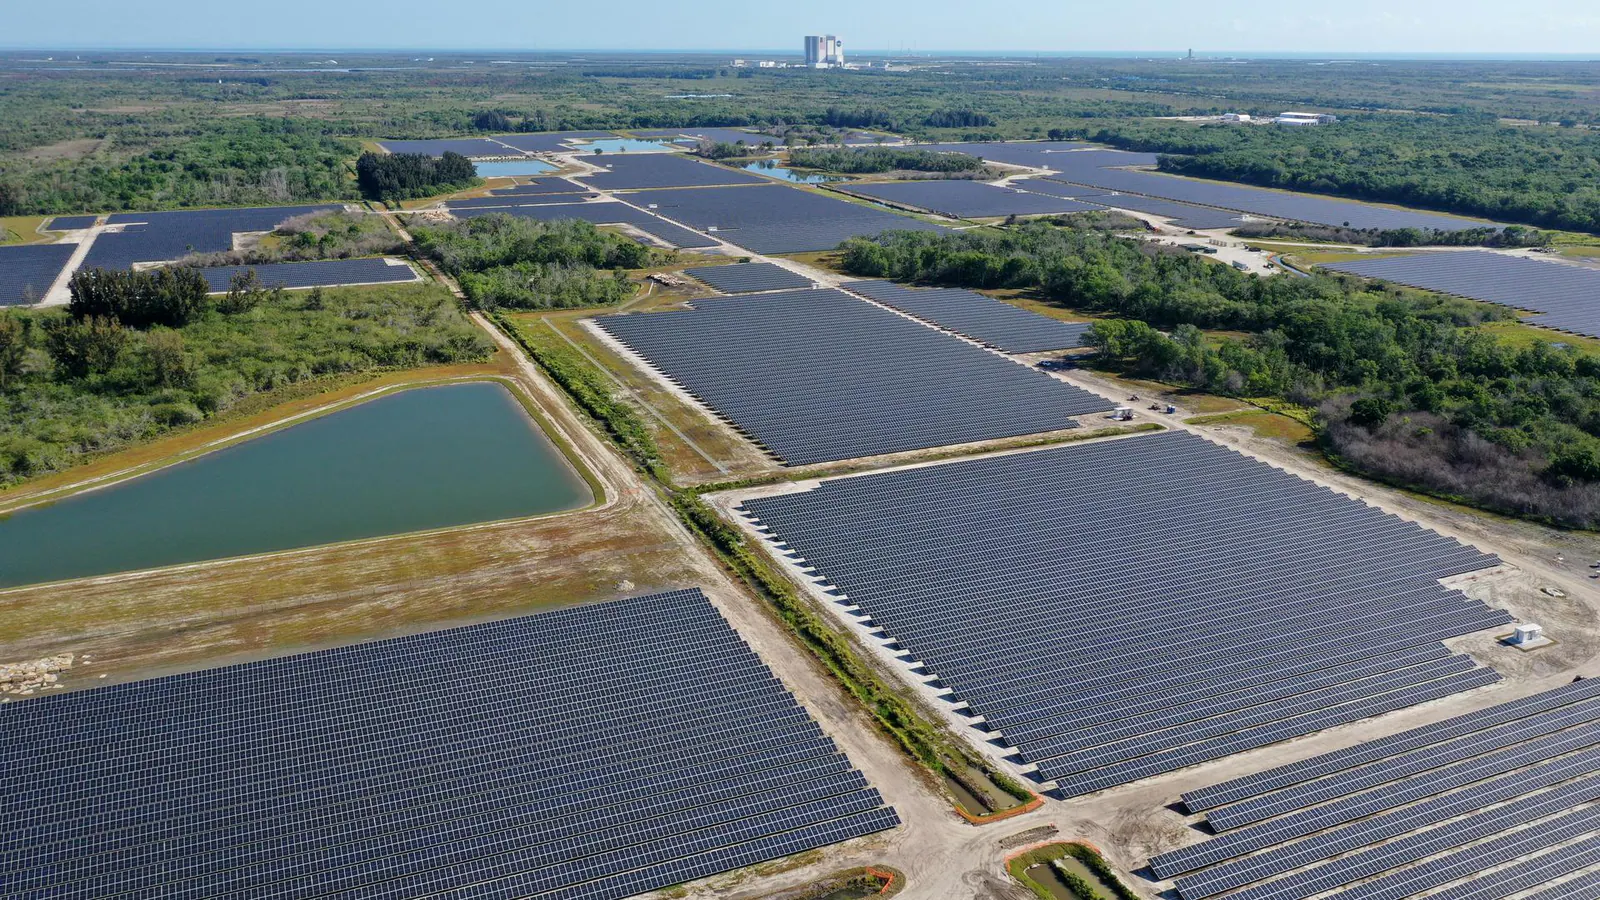

The machine is local. The account is a system.
A new installation does not arrive in an empty grid.
It joins an electricity system with changing demand, cross-border trade and an existing fleet. Whether fossil output falls depends on that wider account, not on the scale of the installation alone.
Discovery Solar Energy Center at Kennedy Space Center, Florida, April 2021. Photograph: NASA/Kennedy Space Center; cropped and resized. The source describes a site supplying the electricity grid.
Compare the country historiesThe generation desk / inspect, compare, change one assumption
One system. Two moving quantities.
The programmed account makes the scale of generation visible before splitting it into clean and fossil output. Its small cells are quantities of electricity, not power plants, electrons or households. The same unit and scale apply to both years.
17 countries + 2 aggregatesComplete fuel account
World2019–2025Clean +3,733.1 TWhFossil +1,200.0 TWh
Exhibit 01 World / 2019–2025
The electricity account, opened.
World: the two years retain their published system sizes. Change the accounting assumption without overwriting the historical record.
The precise account below loads first. The programmed energy field starts as you approach it.
2025: total 31,820.135 TWh; clean 13,462.762; fossil 18,357.373; residual 0.000.
Preview. Click, tap, or press Enter to pin.2025: total 31,820.135 TWh; clean 13,462.762; fossil 18,357.373; residual 0.000.
The fine-grained mosaic is a programmed aggregate encoding, not physical flow or matched units through time. The bars below are the precise comparison. Small signed source residuals are retained separately in the exact account.
Source: Ember, yearly electricity data. 2026-09-22T16:24:55Z (publisher Last-Modified; no numbered release). Annual generation, not installed capacity.
Exact values and the comparison boundary
| Observation | Total (TWh) | Clean (TWh) | Fossil (TWh) | Residual (TWh) |
|---|---|---|---|---|
| 2019 | 26,887.022 | 9,729.644 | 17,157.378 | 0.000 |
| 2025 | 31,820.135 | 13,462.762 | 18,357.373 | 0.000 |
The fine-grained mosaic is a programmed aggregate encoding, not physical flow or matched units through time. The bars below are the precise comparison. Small signed source residuals are retained separately in the exact account.
Change the assumption to see how much fossil output the same clean generation would leave in a system that had not grown or shrunk.
Published 2025 fossil generation remains 18,357.4 TWh.
Keep the latest year in view
The recent year reverses the longer comparison.
From 2024 to 2025, world clean generation grew by 879.9 TWh, while total generation grew by 830.0 TWh. Fossil output fell by 49.9 TWh. The six-year increase and the latest annual decline are both in the same frozen record.
Fixed world comparison, independent of the explorer selection. Leaf-fuel sums retain the -0.001 TWh residual change. No claim of a permanent turning point.
Exhibit 02 World / 2019–2025
The fossil change is an account, not a mystery.
Total-generation change, less the clean change and source-residual change, equals the fossil change. Every term is in TWh.
Total generation: +4,933.113 TWh. Running account: +4,933.113 TWh.
Preview. Click, tap, or press Enter to pin.Total generation: +4,933.113 TWh. Running account: +4,933.113 TWh.
The residual is a signed reconciliation of published rounded components, not an additional energy source. These contributions are arithmetic, not causal policy effects.
Source: Ember, yearly electricity data. 2026-09-22T16:24:55Z (publisher Last-Modified; no numbered release). Annual generation, not installed capacity.
Exact values and the comparison boundary
| Observation | Contribution (TWh) | Running total (TWh) |
|---|---|---|
| Total generation | 4,933.113 | 4,933.113 |
| Subtract clean change | -3,733.118 | 1,199.995 |
| Subtract residual change | 0.000 | 1,199.995 |
| Fossil generation change | 1,199.995 | 1,199.995 |
The residual is a signed reconciliation of published rounded components, not an additional energy source. These contributions are arithmetic, not causal policy effects.
Exhibit 03 World / 2019–2025
Clean growth meets an expanding denominator.
19 places, one comparison rule. Both axes show changes as a percentage of each place's initial total generation. A region view retains your selected place for comparison.
World: clean +13.9%; total generation +18.3%; fossil +4.5%. Each change is divided by its initial total generation.
Preview. Click, tap, or press Enter to pin.World: clean +13.9%; total generation +18.3%; fossil +4.5%. Each change is divided by its initial total generation.
Circles are countries; squares are overlapping aggregates. Arrow keys inspect every record. The country selector below is an equivalent way to locate a point.
The diagonal means equal clean and total-generation change before the source-residual adjustment. Positions are descriptive, not policy-effectiveness rankings. Regional and world aggregates overlap with countries and cannot be summed.
Source: Ember, yearly electricity data. 2026-09-22T16:24:55Z (publisher Last-Modified; no numbered release). Annual generation, not installed capacity.
Exact values and the comparison boundary
| Observation | Clean change / initial total (%) | Total change / initial total (%) | Fossil change / initial total (%) |
|---|---|---|---|
| World | 13.884 | 18.348 | 4.463 |
| European Union (EU-27) | 8.494 | -2.647 | -11.141 |
| Germany | -4.278 | -17.173 | -12.896 |
| United States | 8.980 | 8.691 | -0.289 |
| China | 26.596 | 40.610 | 14.015 |
| India | 14.134 | 29.936 | 15.802 |
| Brazil | 21.459 | 18.767 | -2.692 |
| Canada | -4.124 | -0.499 | 3.625 |
| United Kingdom | 3.780 | -10.333 | -14.113 |
| France | 5.858 | 1.565 | -4.293 |
| Spain | 20.598 | 6.476 | -14.122 |
| Italy | 4.828 | -8.302 | -13.131 |
| Poland | 17.418 | 5.666 | -11.752 |
| Japan | 9.048 | -1.664 | -10.712 |
| South Korea | 12.046 | 6.454 | -5.592 |
| Australia | 20.959 | 7.845 | -13.114 |
| Indonesia | 5.295 | 38.292 | 32.996 |
| South Africa | 6.662 | -4.074 | -10.736 |
| Turkey | 7.196 | 17.883 | 10.687 |
The diagonal means equal clean and total-generation change before the source-residual adjustment. Positions are descriptive, not policy-effectiveness rankings. Regional and world aggregates overlap with countries and cannot be summed.
Exhibit 05 World / 2019–2025
Open the clean-generation total.
Six components, ordered by signed contribution. The net clean change is their sum within source rounding.
Solar: +2,082.197 TWh between 2019 and 2025.
Preview. Click, tap, or press Enter to pin.Solar: +2,082.197 TWh between 2019 and 2025.
Published rounding difference: 0.000 TWh. All six source changes remain available.
Nuclear is included in clean; bioenergy follows Ember's classification and is not assumed to be carbon-neutral. Source changes do not identify substitution between technologies.
Source: Ember, yearly electricity data. 2026-09-22T16:24:55Z (publisher Last-Modified; no numbered release). Annual generation, not installed capacity.
Exact values and the comparison boundary
| Observation | Change (TWh) |
|---|---|
| Solar | 2,082.197 |
| Wind | 1,283.415 |
| Hydro | 201.583 |
| Bioenergy | 102.586 |
| Nuclear | 55.271 |
| Other renewables | 8.066 |
| Published rounding difference | -0.000 |
| Clean total | 3,733.118 |
Nuclear is included in clean; bioenergy follows Ember's classification and is not assumed to be carbon-neutral. Source changes do not identify substitution between technologies.
Exhibit 06 World / 2019–2025
Move the starting line.
Hold 2025 fixed. Move the reference year and watch the same countries change position. Click a country to open its electricity account; no country changes rows when the reference year moves.
2015–2024 reference years. The axis covers every country and every reference in this range; changing the range deliberately changes the scale.
World: +1,199.995 TWh fossil change; +4.46% of its initial generation.
China and India switch from a 6-year fossil increase to a latest-year decline.
Use the two views above. The original country values and their denominators remain available.Open the selected account
World2019–2025
+1,200.0 TWh fossil change
The account closes at +1,199.995 TWh: the published fossil-generation change.
The clean entry is subtracted. If clean output fell, subtracting that negative change adds to the fossil requirement. The residual stays explicit; this is accounting, not an estimate of avoided fossil generation.
Complete fuel account; all source components are available.
Audit the country and reference-year table
− Lower fossil output+ Higher fossil output
| Country / aggregate | 2000to 2025 | 2010to 2025 | 2015to 2025 | 2019to 2025 | 2020to 2025 | 2024to 2025 |
|---|---|---|---|---|---|---|
| Countries | ||||||
| Spain | ||||||
| United Kingdom | ||||||
| Italy | ||||||
| Australia* | ||||||
| Germany | ||||||
| Poland | ||||||
| South Africa* | ||||||
| Japan* | ||||||
| South Korea* | ||||||
| France | ||||||
| Brazil* | ||||||
| United States | ||||||
| Canada* | ||||||
| Turkey | ||||||
| China* | ||||||
| India* | ||||||
| Indonesia* | ||||||
| Overlapping aggregates · do not add to countries | ||||||
| World | ||||||
| European Union (EU-27) | ||||||
* Published clean/fossil aggregates are used where full fuel detail is unavailable. Missing fuel observations are not filled with zeros.
World, 2019–2025+1,199.995 TWh fossil change ÷ 26,887.022 TWh initial total = +4.46%.
The signed axis shows fossil-generation change as a percentage of reference-year total generation, not a growth rate of fossil output. The scale stays fixed within the chosen range. Dots transition between discrete comparisons; intermediate animation positions are not observations. World and EU-27 are overlapping aggregates.
Source: Ember, yearly electricity data. 2026-09-22T16:24:55Z (publisher Last-Modified; no numbered release). Annual generation, not installed capacity.
Exact values and the comparison boundary
| Observation | Fossil change (TWh) | Initial total (TWh) | Change / initial total (%) |
|---|---|---|---|
| Australia | -34.871 | 265.900 | -13.114 |
| Brazil | -17.052 | 633.330 | -2.692 |
| Canada | 23.770 | 655.700 | 3.625 |
| China | 1,047.099 | 7,471.528 | 14.015 |
| France | -24.277 | 565.520 | -4.293 |
| Germany | -77.385 | 600.090 | -12.896 |
| India | 252.987 | 1,600.980 | 15.802 |
| Indonesia | 126.030 | 381.951 | 32.996 |
| Italy | -38.078 | 289.990 | -13.131 |
| Japan | -112.200 | 1,047.400 | -10.712 |
| Poland | -19.182 | 163.220 | -11.752 |
| South Africa | -27.170 | 253.070 | -10.736 |
| South Korea | -32.815 | 586.800 | -5.592 |
| Spain | -38.204 | 270.520 | -14.122 |
| Turkey | 32.080 | 300.180 | 10.687 |
| United Kingdom | -46.176 | 327.190 | -14.113 |
| United States | -12.000 | 4,158.380 | -0.289 |
| World | 1,199.995 | 26,887.022 | 4.463 |
| European Union (EU-27) | -320.258 | 2,874.500 | -11.141 |
The signed axis shows fossil-generation change as a percentage of reference-year total generation, not a growth rate of fossil output. The scale stays fixed within the chosen range. Dots transition between discrete comparisons; intermediate animation positions are not observations. World and EU-27 are overlapping aggregates.
The implication
Ask what changed on both sides of the account.
Clean electricity has to be read alongside the size of the system it serves. The useful question is not simply whether clean generation increased, but how that increase compared with total-generation growth and changes in the rest of the mix.
For an energy planner, that distinction separates the build-out task from the resulting fossil output. For a reader of climate headlines, it separates a promising percentage from an observed quantity. The account establishes the arithmetic. Explaining why its entries changed requires additional evidence.
Take the account with you
World, 2019–2025
The link preserves the place, years and accounting assumption. The receipt keeps published history separate from the experiment.
Failure boundary
What this account cannot tell us.
- Annual domestic generation is not electricity demand. Net trade and the source's demand definition must remain separate.
- Clean is the source's renewable-plus-nuclear category, not a claim of zero lifecycle emissions or zero environmental impact.
- The fixed-generation experiment is a labelled arithmetic scenario, not a dispatch model, forecast, estimate of avoided generation or causal policy evaluation.
- A negative fossil entry in that experiment is infeasible. The account identifies a conflict between assumptions, not the curtailment, storage or trade response.
- National and regional aggregates conceal hourly and local constraints. These data do not establish reliability, grid adequacy or marginal emissions.
- Published annual estimates are revised. No confidence intervals are invented when the source supplies none.
- The Blender turbine is an original explanatory schematic of one geared configuration. It is not a manufacturer design, operational model, measured turbine, or numerical estimate of national generation.
- Country-level aggregate accounts do not imply complete fuel detail. Missing component values remain null and are not reconstructed as observations.
Evidence, definitions and reproducibility
One frozen release. An inspectable calculation.
Source: Ember, Yearly Electricity Data. Publisher release timestamp: September 22, 2026. Retrieved September 24, 2026. Coverage: 2000–2025. License: CC-BY-4.0. Source data have been selected, summed and transformed; no endorsement is implied.
All displayed observations come from one frozen electricity-data release. The source receipt records the exact acquisition, coverage, license and checksum; the deterministic generator rejects duplicate keys, incompatible units, missing required categories and accounts that fail reconciliation.
The primary comparison subtracts reference-year output from comparison-year output, in TWh. Clean generation includes nuclear and the renewable sources identified in the source. Complete accounts use the available fuel sum. Where a country lacks complete fuel detail, source-published clean and fossil aggregates are used consistently across the full history. The signed residual is retained so that total generation equals fossil plus clean plus residual.
The cross-country comparison and reference-year matrix divide changes by total generation in the corresponding reference year. The historical fossil-share series instead divides fossil output by the same year's total output. These denominators are not interchangeable.
The scenario retains comparison-year clean generation and residual, replaces total generation with the reference-year total, and solves for the fossil entry. Observed values remain pinned beside it. A negative solution is reported as an infeasible account rather than silently set to zero.
The electricity cells are a programmed aggregate encoding, not microdata or matched physical units across years. Their unit is displayed, fractional quantities are retained in the exact account, and the conventional evidence views remain available without motion or canvas.
The turbine model, its editable Blender source and its web GLB are generated from one original scene. Its photographs are separately rights-traced context images. The mechanical cutaway and published country accounts have separate truth contracts: the first explains a physical connection; the second records annual statistical quantities.
Coverage is a result of the data gate.
The comparison now contains 17 countries and 2 overlapping aggregates. China and India are included through source-published aggregate accounts where complete fuel detail is unavailable. Missing fuel observations remain unavailable, never assigned zero or silently reconstructed.
Germany, United States, China, India, Brazil, Canada, United Kingdom, France, Spain, Italy, Poland, Japan, South Korea, Australia, Indonesia, South Africa, Turkey. World and fixed current EU-27 are comparison aggregates, not additional countries.
Recent numbers are estimates and can change.
Ember combines reported data with annualization and other estimates; the export has no row-level observation flag. Negative source entries are preserved and flagged, including Spain's −0.045 TWh Other renewables estimate in 2025. We retain the source accounts and disclose that limitation rather than changing a negative estimate into zero.
The April 2026 Global Electricity Review is a separate vintage. Its world-solar and world-fossil headlines differ from this September snapshot beyond rounding. Those discrepancies are retained in the quality report; April headlines are not spliced into the newer time series.
Images and the mechanical model have their own source trail.
The photographs provide context, not empirical evidence of a trend. The editable Blender turbine is an original schematic. Its component positions and inspection controls do not encode national output, operating speeds or validated equipment performance.
- Wind turbines in California's Mojave Desert, June 2017. Photograph: Anthony Quintano, CC BY 2.0; cropped and resized. Anthony Quintano; CC BY 2.0.
- Discovery Solar Energy Center at Kennedy Space Center, Florida, April 2021. Photograph: NASA/Kennedy Space Center; cropped and resized. The source describes a site supplying the electricity grid. NASA/Kennedy Space Center; NASA informational/editorial media reuse.
Source-specific caveats and geographic definitions
- This is a descriptive annual electricity account, not a causal estimate of fossil displacement.
- Complete 2000–2025 coverage means annual entries in the frozen export. Ember combines reported data, estimates and projections; the CSV does not identify observation status for individual rows.
- Clean means nuclear plus hydro, wind, solar, bioenergy and other renewables. It does not mean zero emissions. Ember warns that bioenergy's climate impact depends on feedstocks and sourcing.
- Complete entities use sums of all nine published leaf-fuel values. Partial entities use published Fossil and Clean aggregates for every year, never switching basis year by year. No overlapping aggregates are added to fuel observations.
- Residual is reported total generation minus fossil minus clean on the entity's fixed basis. It may be negative because of rounding; it is never allocated to clean generation.
- For partial detail, clean minus the sum of known clean fuels is a derived unallocated missing-detail/rounding balance, not an Other renewables or nuclear observation. It is separate from residual. Even a zero balance does not establish a missing fuel as zero.
- Demand is Ember's generation-plus-net-imports boundary, not retail electricity consumption. Imports are positive and net exports negative. Generation and demand must not be interchanged.
- World contains all selected countries; EU-27 contains Germany, France, Spain, Italy and Poland. They are comparison entities, not additive regions. EU-27 uses fixed current membership, including years before some members joined, and excludes the UK throughout.
- All 17 requested countries are included. Nine have partial fuel detail: China, India, Brazil, Canada, Japan, South Korea, Australia, Indonesia and South Africa. Missing source rows remain null, including China and India's Other renewables in all 26 years.
- Capacity is nameplate GW, not generated TWh. Solar AC/DC reporting is not fully harmonized across countries. Annual capacity and output do not establish curtailment, hourly reliability or grid adequacy.
- The September snapshot revises some April 2026 Global Electricity Review headlines. The benchmark report and latest observations are compared, never spliced into one time series.
- The archive contains 12 negative non-trade generation entries, including seven EU-member entries in 2025. Spain's 2025 Other renewables is -0.045 TWh and is included unchanged. Other affected countries are outside this requested panel; regional aggregates are not corrected.
World. Ember's published world aggregate, including estimates for missing country-years. 2000–2025 has complete annual export coverage, not uniformly observed data. World demand equals generation in this product; a separate world net-import row is not published.
European Union (EU-27). Fixed current EU-27 membership throughout 2000–2025, excluding the UK. The source's EU-member flags identify the 27 members; their totals reconcile to the published EU aggregate within rounding in every year. Germany is nested in this group.
Germany. Domestic generation, 2000–2025. Ember combines annual and recent monthly sources, including estimates for captive gas and distributed solar. Germany is also included in EU-27.
United States. Domestic generation, 2000–2025, in the same Ember release. Annualized and distributed-generation estimates may be revised; annual coverage is not an hourly adequacy measure.
China. Domestic generation, 2000–2025. Other renewables is absent in all 26 years. Published fossil and clean aggregates support comparison without inferring that fuel.
India. Domestic generation, 2000–2025. Other renewables is absent in all 26 years. The separately published fossil headline is a benchmark, not a replacement data vintage.
Brazil. Domestic generation, 2000–2025. Other renewables is absent in all 26 years. Hydro and bioenergy retain Ember's definitions; clean does not mean zero emissions.
Canada. Domestic generation, 2000–2025. Other renewables is absent in all 26 years. Net exports retain their negative sign and are separate from domestic generation.
United Kingdom. Domestic generation, 2000–2025, with all nine fuel rows in every year. The UK is excluded from the fixed EU-27 aggregate throughout the panel.
France. Domestic generation, 2000–2025, with all nine fuel rows in every year. France is nested in EU-27; nuclear is included in clean generation.
Spain. Domestic generation, 2000–2025, with all nine fuel rows in every year. Spain is nested in EU-27. The source reports Other renewables of -0.045 TWh in 2025; this signed publisher-quality limitation is retained, not clamped to zero.
Italy. Domestic generation, 2000–2025, with all nine fuel rows in every year. Italy is nested in EU-27. Generation and demand differ by published net imports.
Poland. Domestic generation, 2000–2025, with all nine fuel rows in every year. Poland is included in the fixed EU-27 even before its accession.
Japan. Domestic generation, 2000–2025. Other renewables is absent in all 26 years. The published aggregates do not establish a separate missing-fuel observation.
South Korea. Domestic generation, 2000–2025. Other renewables is absent in all 26 years. Known fuel values remain observations even when their sum matches a published aggregate.
Australia. Domestic generation, 2000–2025. Other renewables is absent throughout; nuclear is absent in 2000–2005 and explicitly published as zero thereafter. Missing is not zero.
Indonesia. Domestic generation, 2000–2025. Nuclear is absent in all 26 years. Missing solar or wind capacity remains null independently of generation coverage.
South Africa. Domestic generation, 2000–2025. Other renewables is absent in all 26 years. Annual national totals do not establish hourly reliability or the incidence of load shedding.
Turkey. Domestic generation, 2000–2025, with all nine fuel rows in every year. The stable public id turkey maps to Ember's Türkiye/TUR. Asia follows the source continent.