The carbon ledger / No. 02
Less emitted. Still accumulating.
In 2020, global CO2 emissions fell 5.6%. The atmosphere still gained carbon. An annual account explains where the difference goes, and why the books do not always balance.

Opening case / 2020 versus 2019
- Net CO2 emissions
- −5.6%Change in the annual inflow
- Annual mean CO2 concentration
- +2.37ppmA higher atmospheric stock
Still added to the air in 202018.1 GtCO2
GCB 2025 and NOAA, frozen source vintages. The opening case stays at 2020; the account below can inspect every common year.
Michael Schymura / Updated September 17, 2026
A decline is not the same as a reversal
The two numbers describe the same year without contradicting each other. Net anthropogenic CO2 emissions fell 5.6% in 2020, while the global annual mean concentration rose 2.37 parts per million. The first measures a change in the annual inflow. The second describes a higher atmospheric stock.
A smaller positive inflow can continue to add to a stock. Land and oceans remove part of that carbon, but they do not necessarily remove everything emitted in a given year. The useful question is therefore what remains after those exchanges, not whether emissions rose more slowly, stopped growing or briefly declined.
The Global Carbon Budget 2025 and NOAA's global concentration record let us inspect that distinction over 45 common years. They also expose an important limit: an annual carbon budget combines measurements and estimates that do not close perfectly. The remainder belongs in the story.
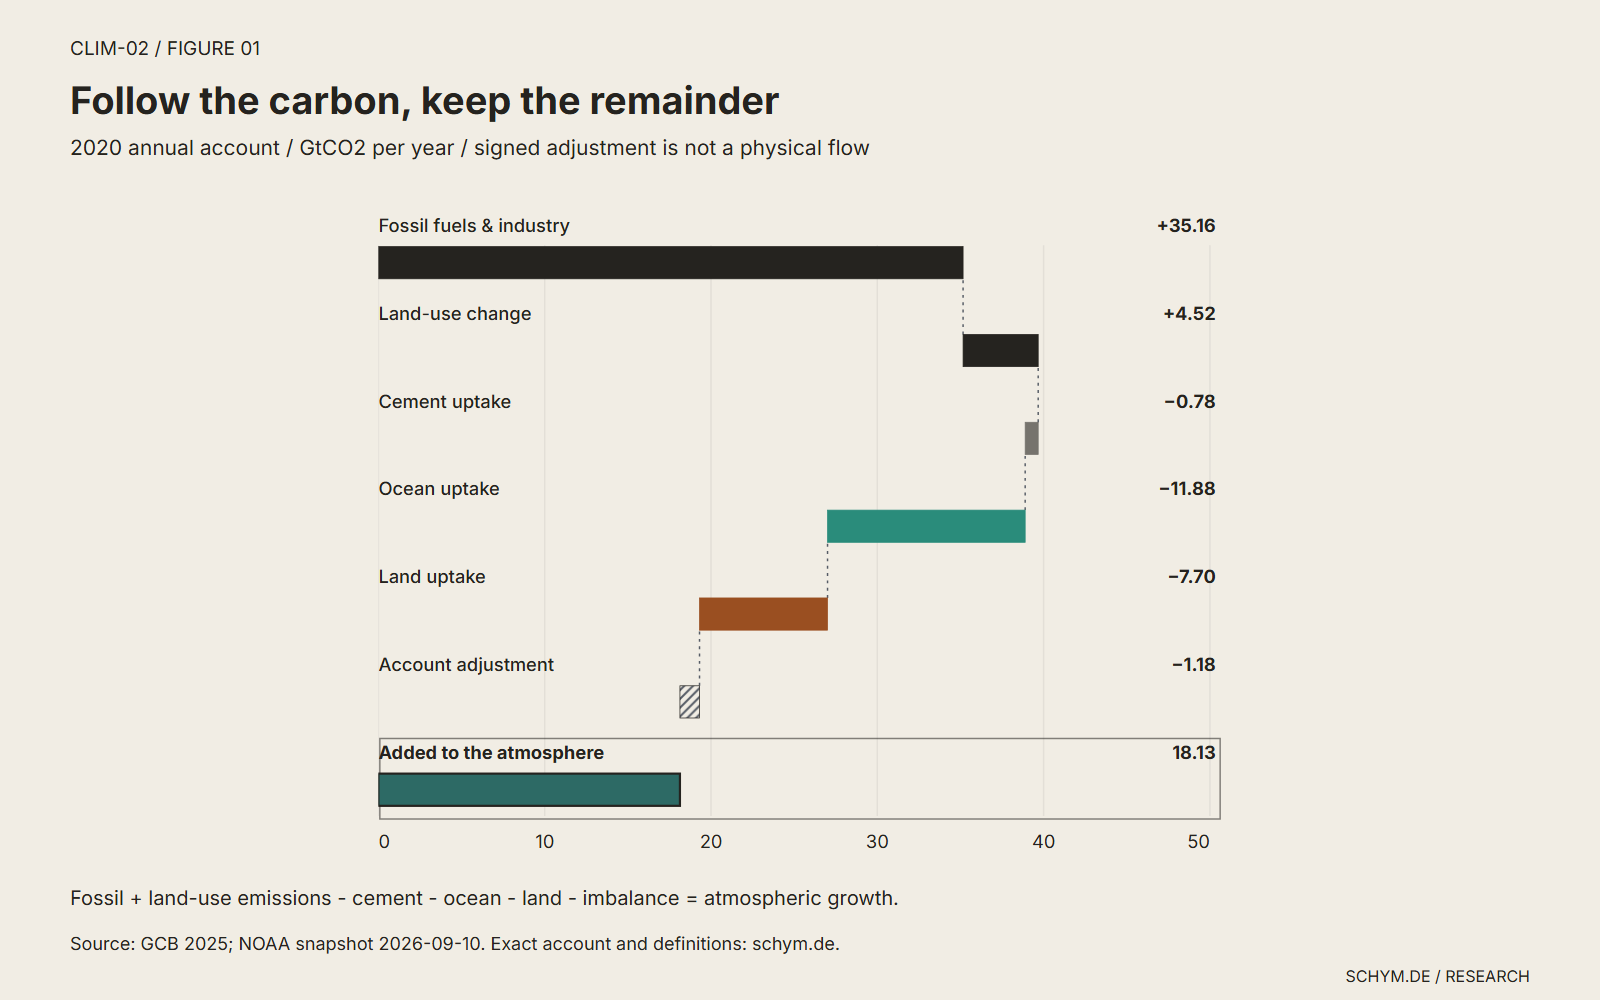
Figure 01 / Carbon balance
Follow the carbon, keep the remainder
2020 GtCO2 per year
Published component: +18.133 GtCO2/year. Bridge contribution: +18.133 GtCO2/year. Atmospheric accumulation from the frozen GCB atmospheric growth estimate. Its typical uncertainty after 1980 is about 0.17 GtC/year.
Preview. Click, tap, or press Enter to pin.Selected: Added to the atmosphere. Atmospheric accumulation from the frozen GCB atmospheric growth estimate. Its typical uncertainty after 1980 is about 0.17 GtC/year.
Published imbalance: +1.18 GtCO2/year. The hatched step subtracts this value; it does not represent a physical flow.
Exact values and definitions
| Published component | Estimate |
|---|---|
| Fossil fuels & industry | 35.158230 |
| Land-use change | 4.516540 |
| Cement uptake | 0.782807 |
| Ocean uptake | 11.883459 |
| Land uptake | 7.697970 |
| Budget imbalance (source sign) | 1.177690 |
| Added to the atmosphere | 18.132843 |
Source: Global Carbon Budget 2025, global summary. Original GtC values multiplied by 3.664. Component uncertainty and vintage limits appear below.
01 / Reconstruct the account
The atmosphere receives a balance, not a headline
Start with emissions from fossil fuels and industry, then add net emissions from land-use change. Some CO2 is taken up by the ocean, some by the land, and a smaller amount through cement carbonation. The remainder is related to atmospheric accumulation.
- 1980
A smaller carbon economy
The common record begins. Emissions and atmospheric growth are already different quantities.
- 2020
The flow slows. The stock rises.
Net emissions fell 5.6%. Yet 18.1 GtCO2 accumulated in the atmosphere, and the global annual mean concentration rose 2.37 ppm.
- 2024
The account does not close itself
The estimated atmospheric increase was unusually large. A negative budget imbalance of 6.2 GtCO2 prevents a tidy allocation of emissions across destinations.
These are net exchanges, not a tracing experiment that follows individual molecules. Land uptake is also distinct from the land-use-change source: the budget keeps them in separate terms. Cement uptake remains explicit here, rather than disappearing into a larger category.
The waterfall adds and subtracts the published components in order. Its hatched adjustment subtracts the reported budget imbalance to arrive at the atmospheric estimate. The arithmetic reconciles; the adjustment does not turn imperfect estimates into a closed physical observation.
02 / Keep the units apart
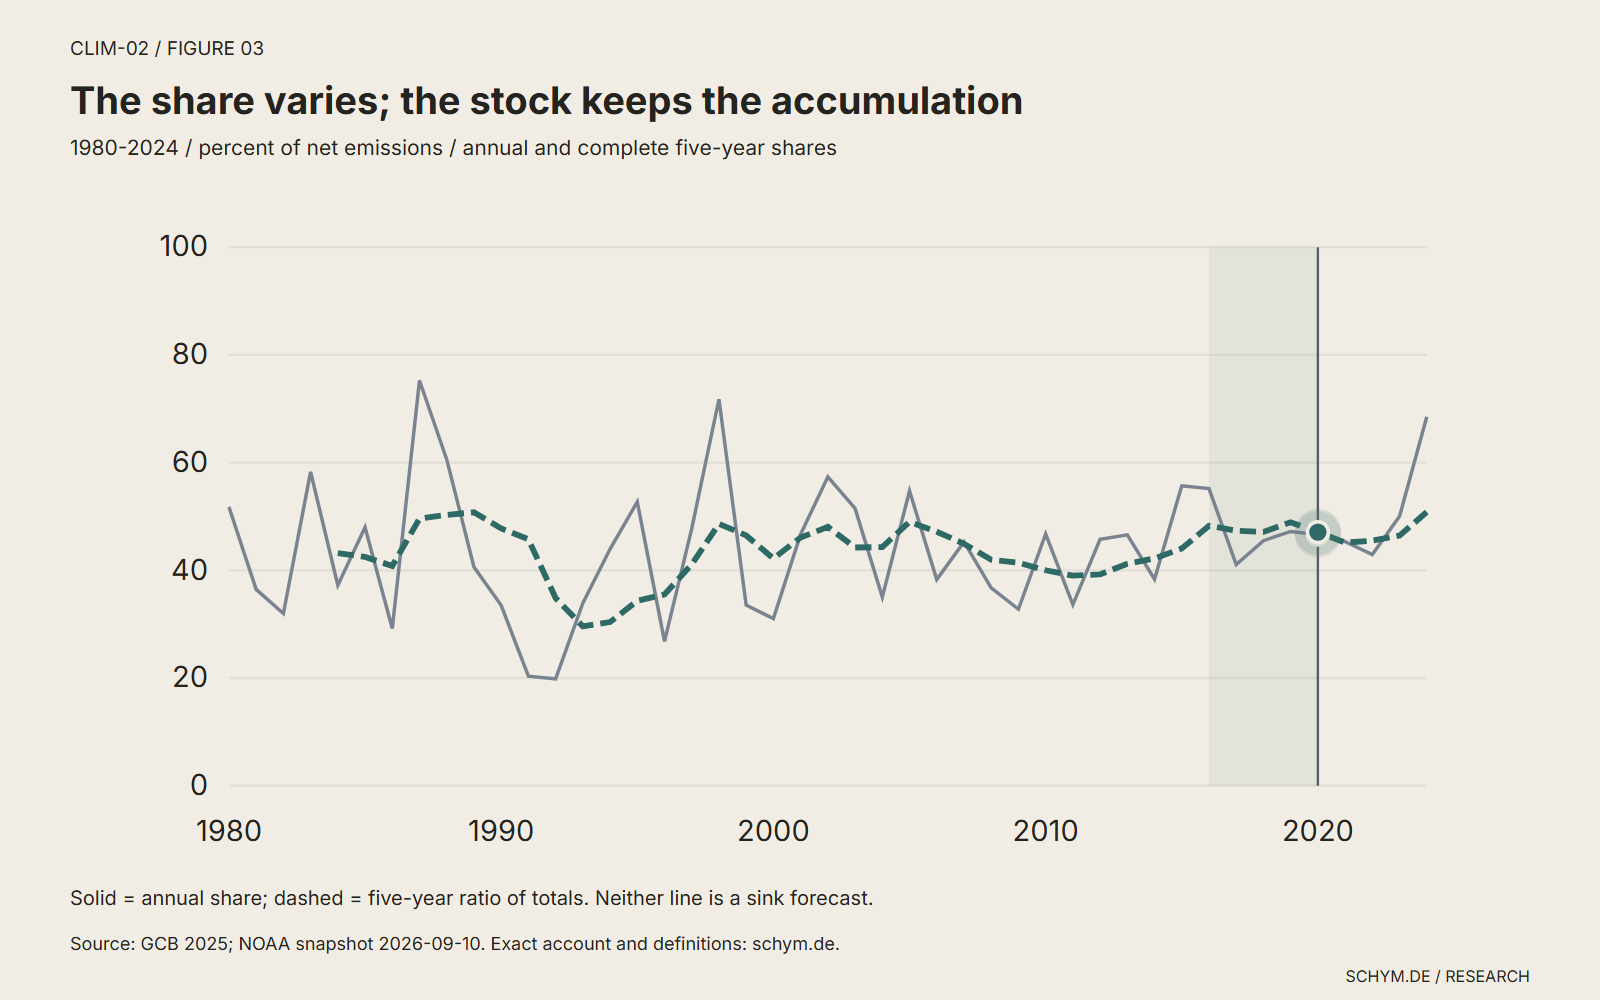
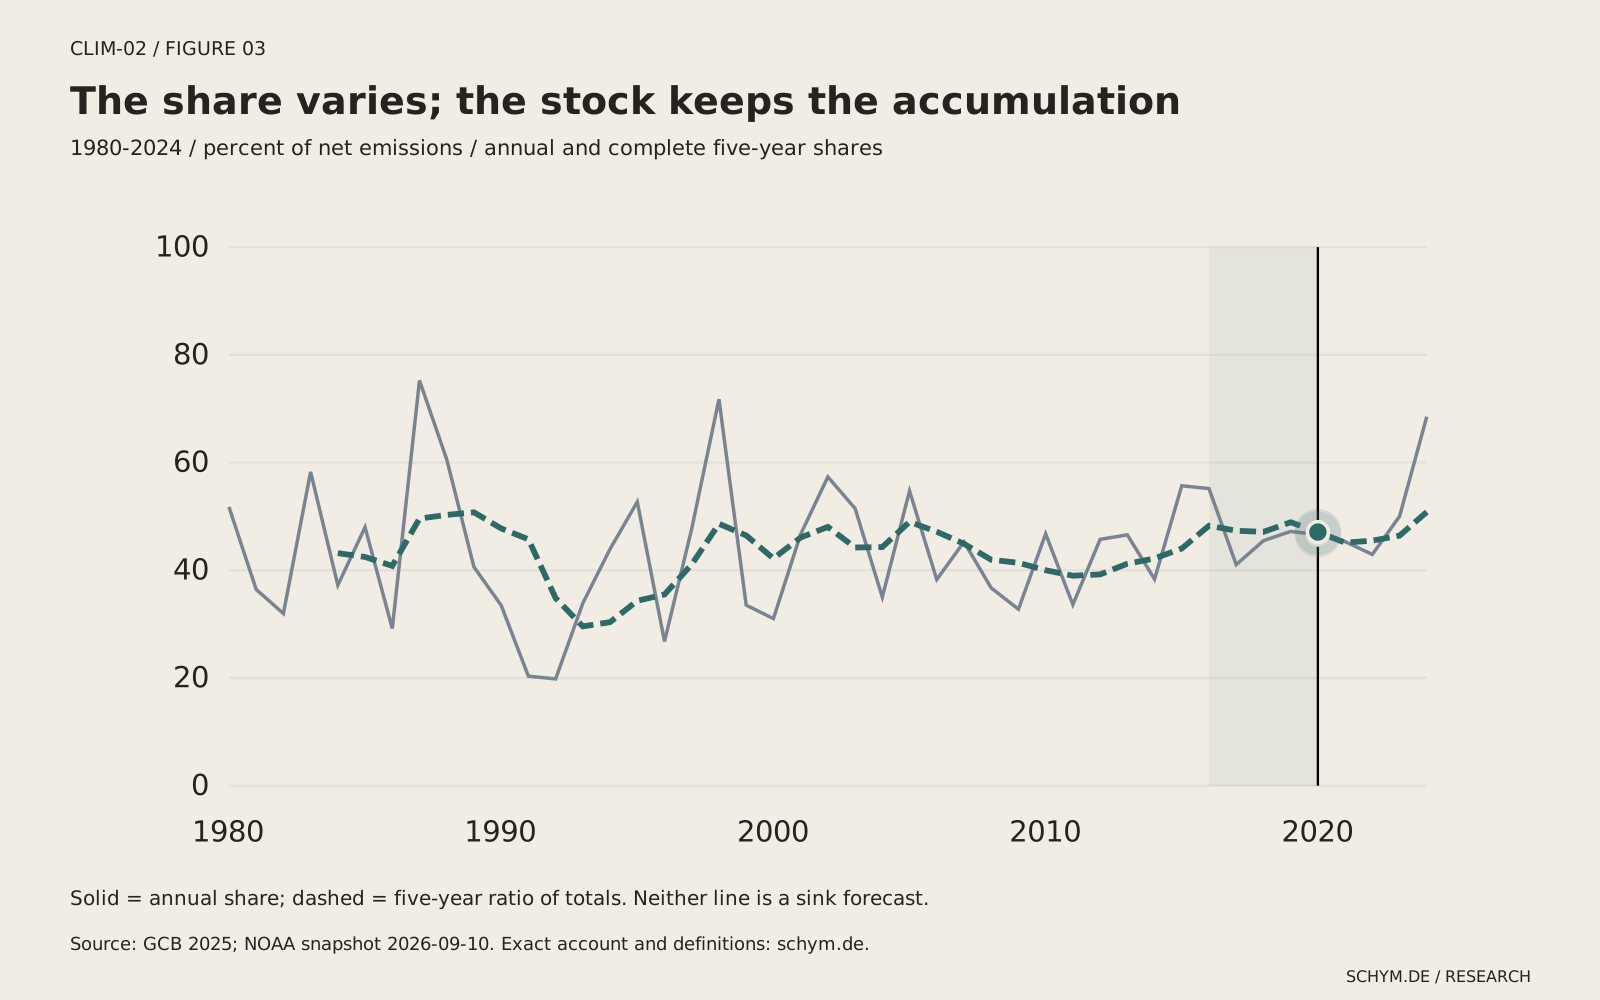
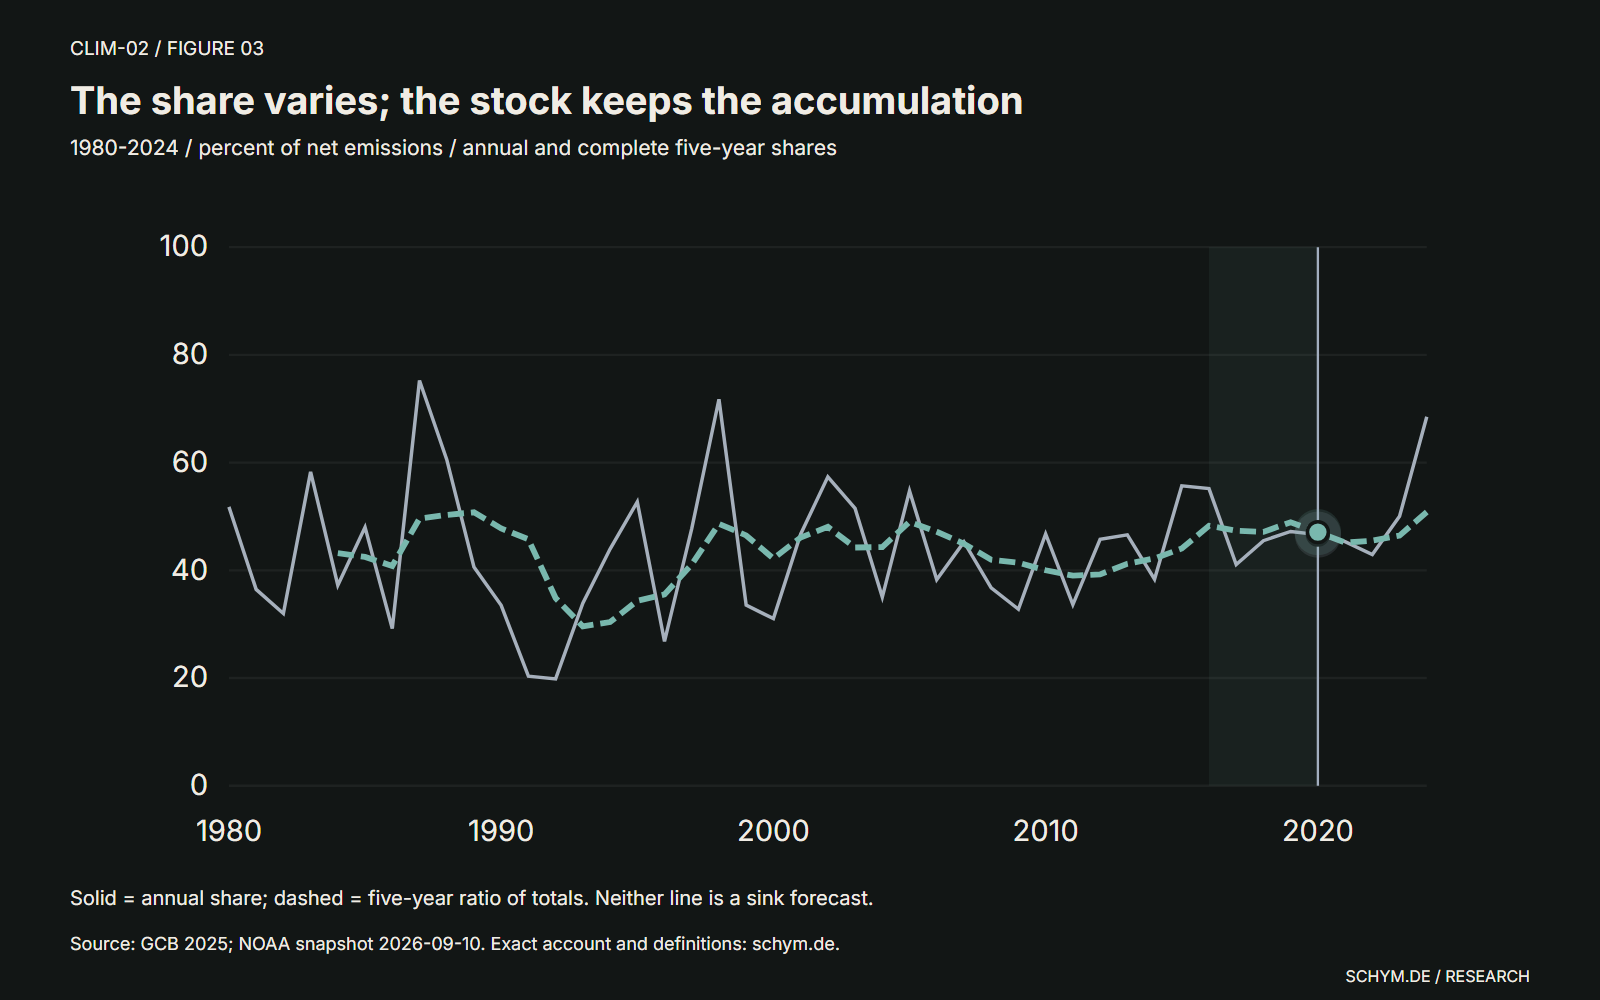
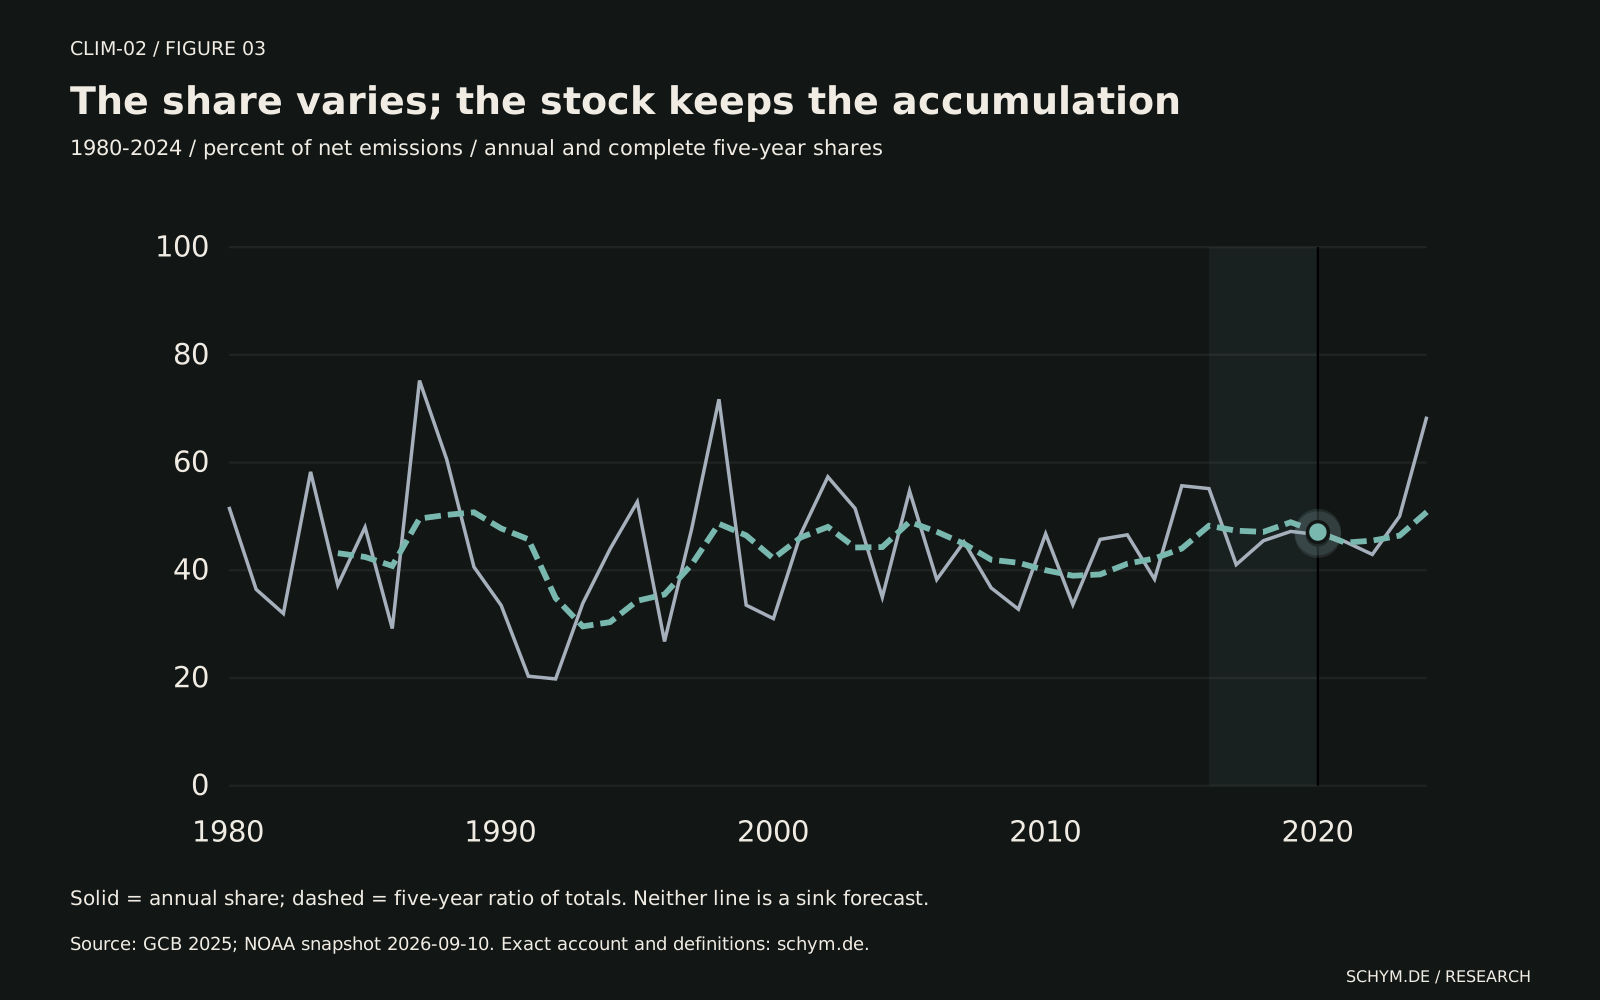
The year changes the flow. The record carries the stock.
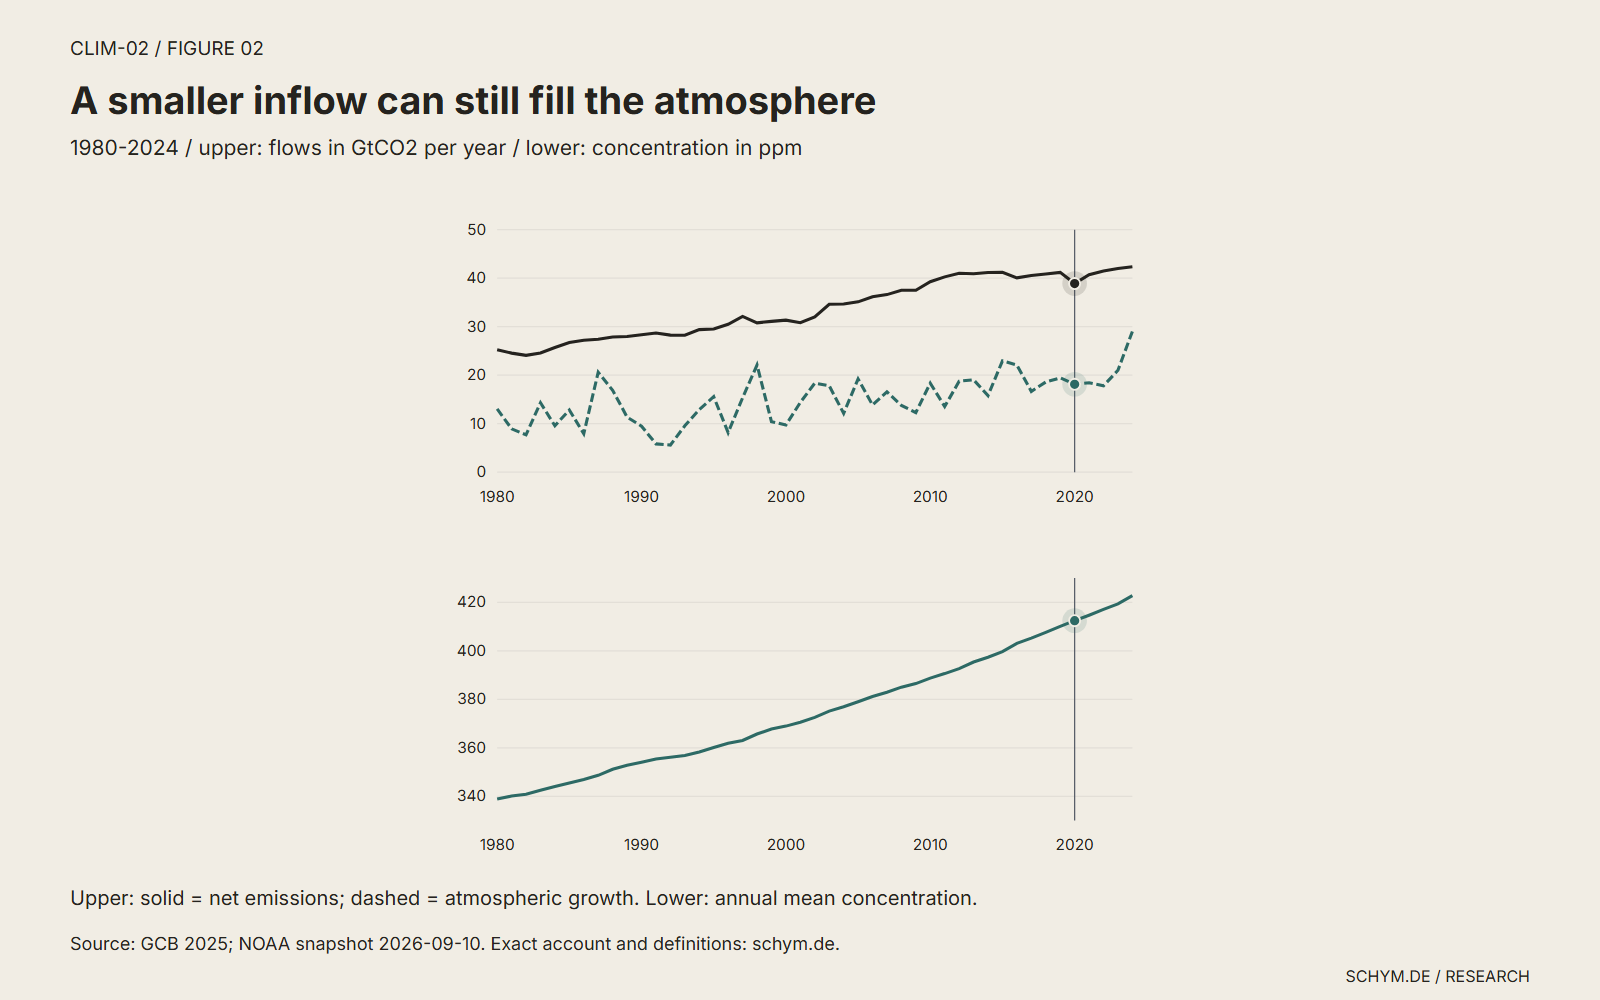
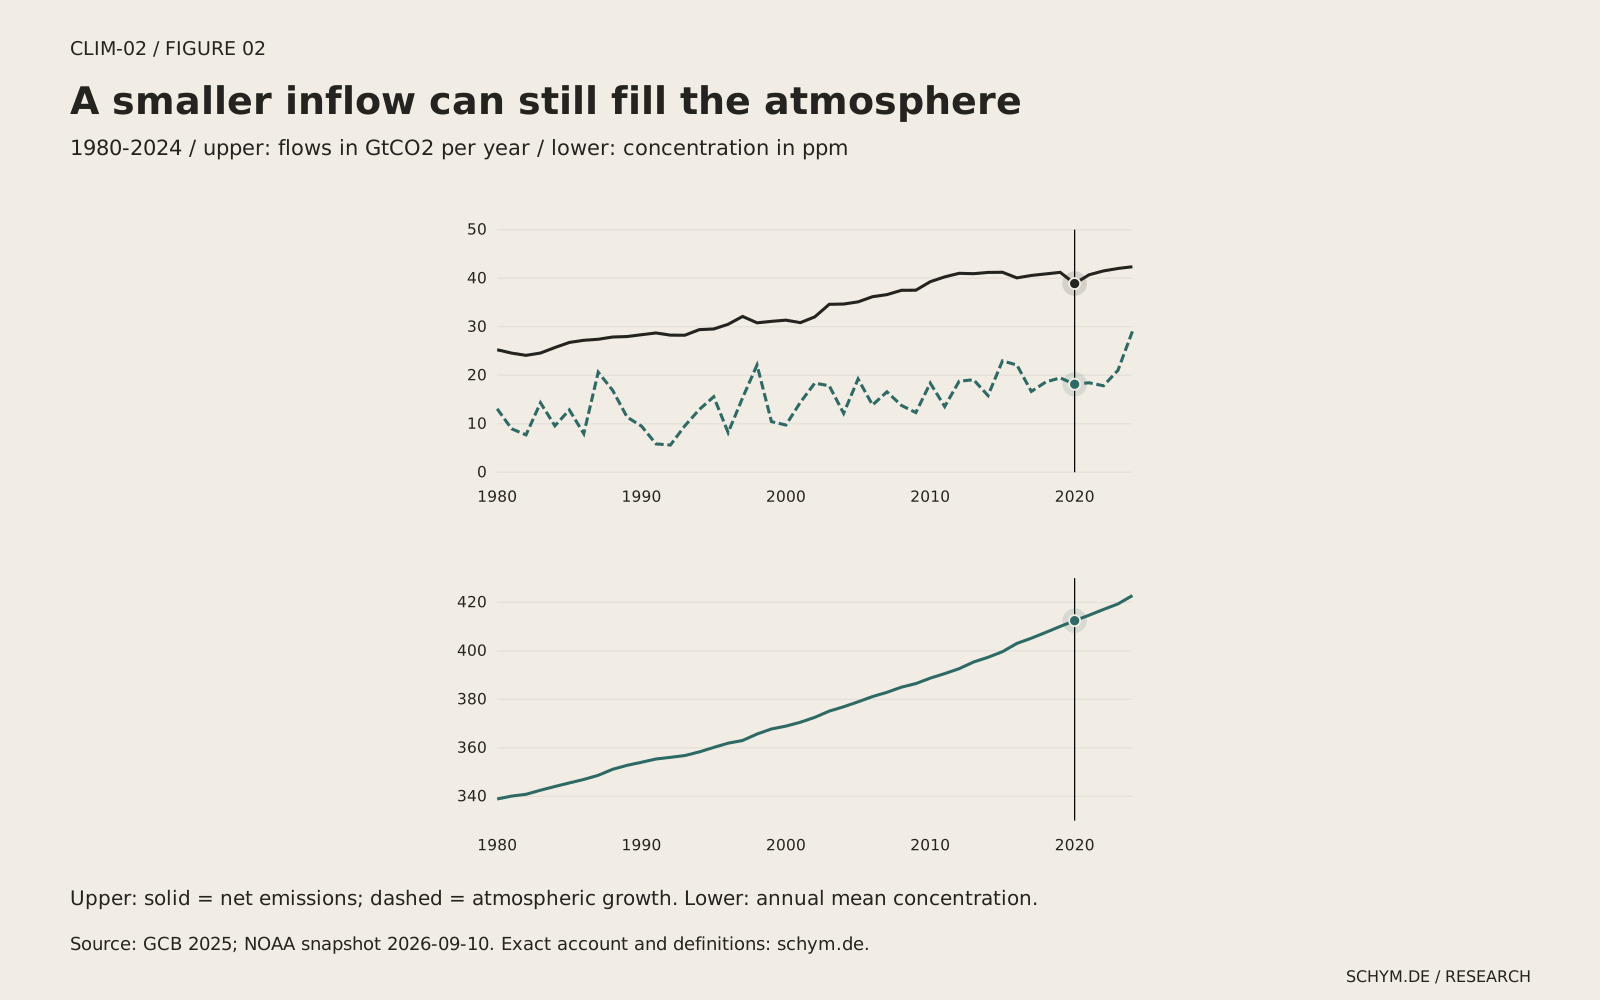
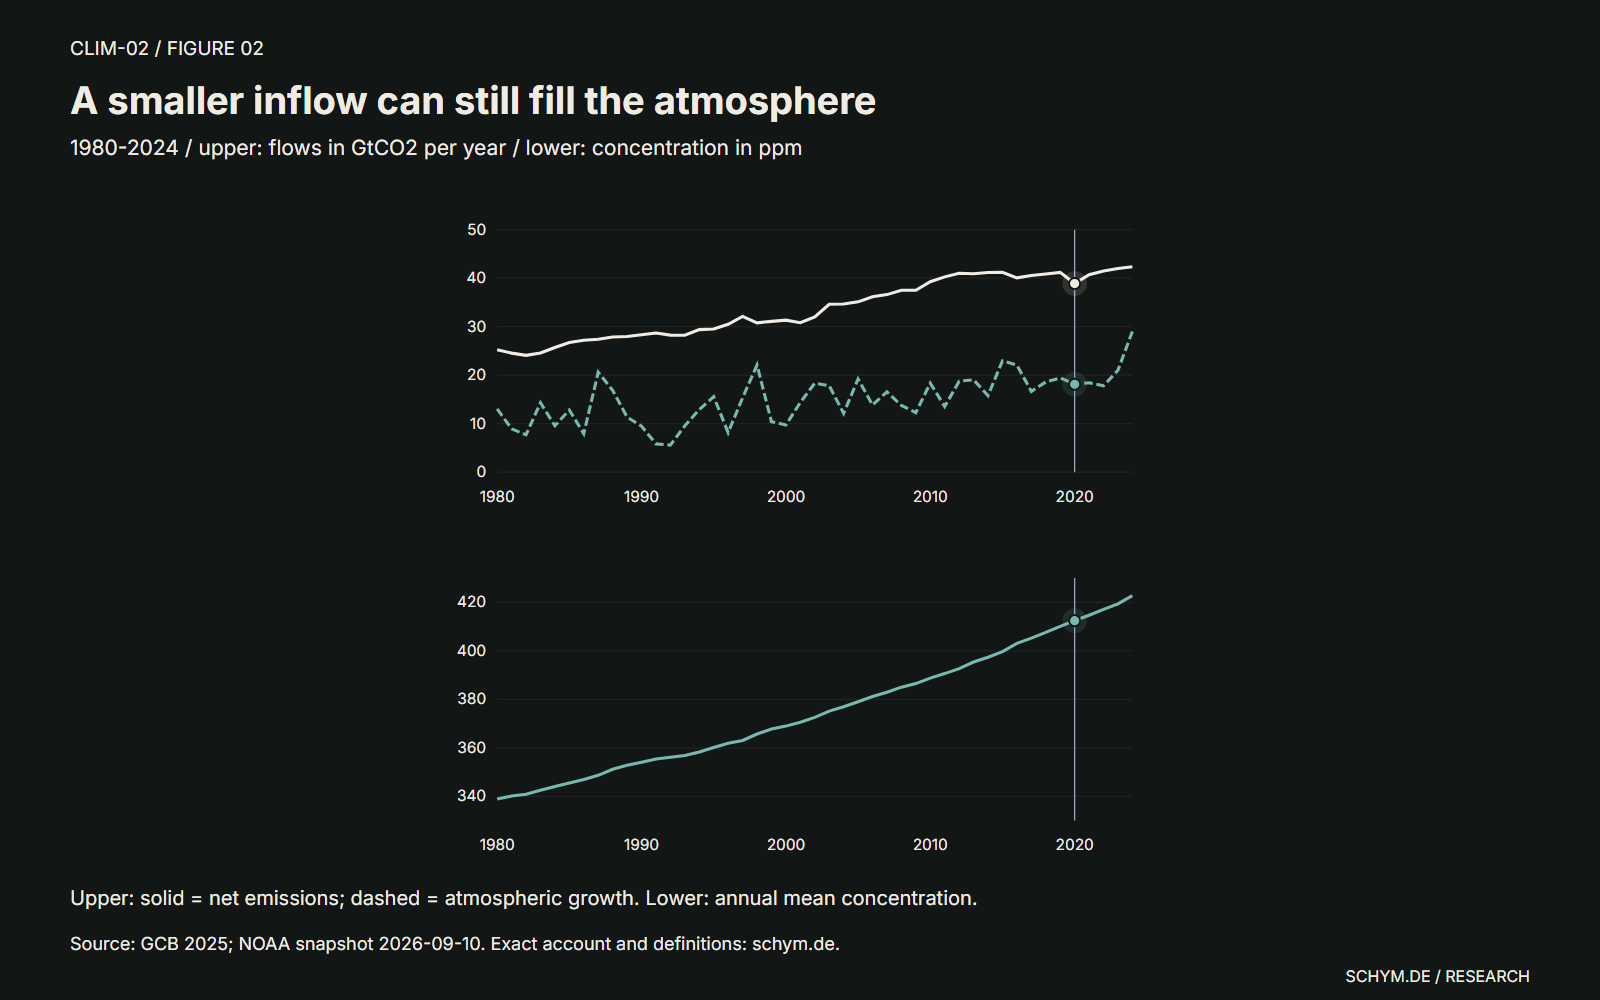
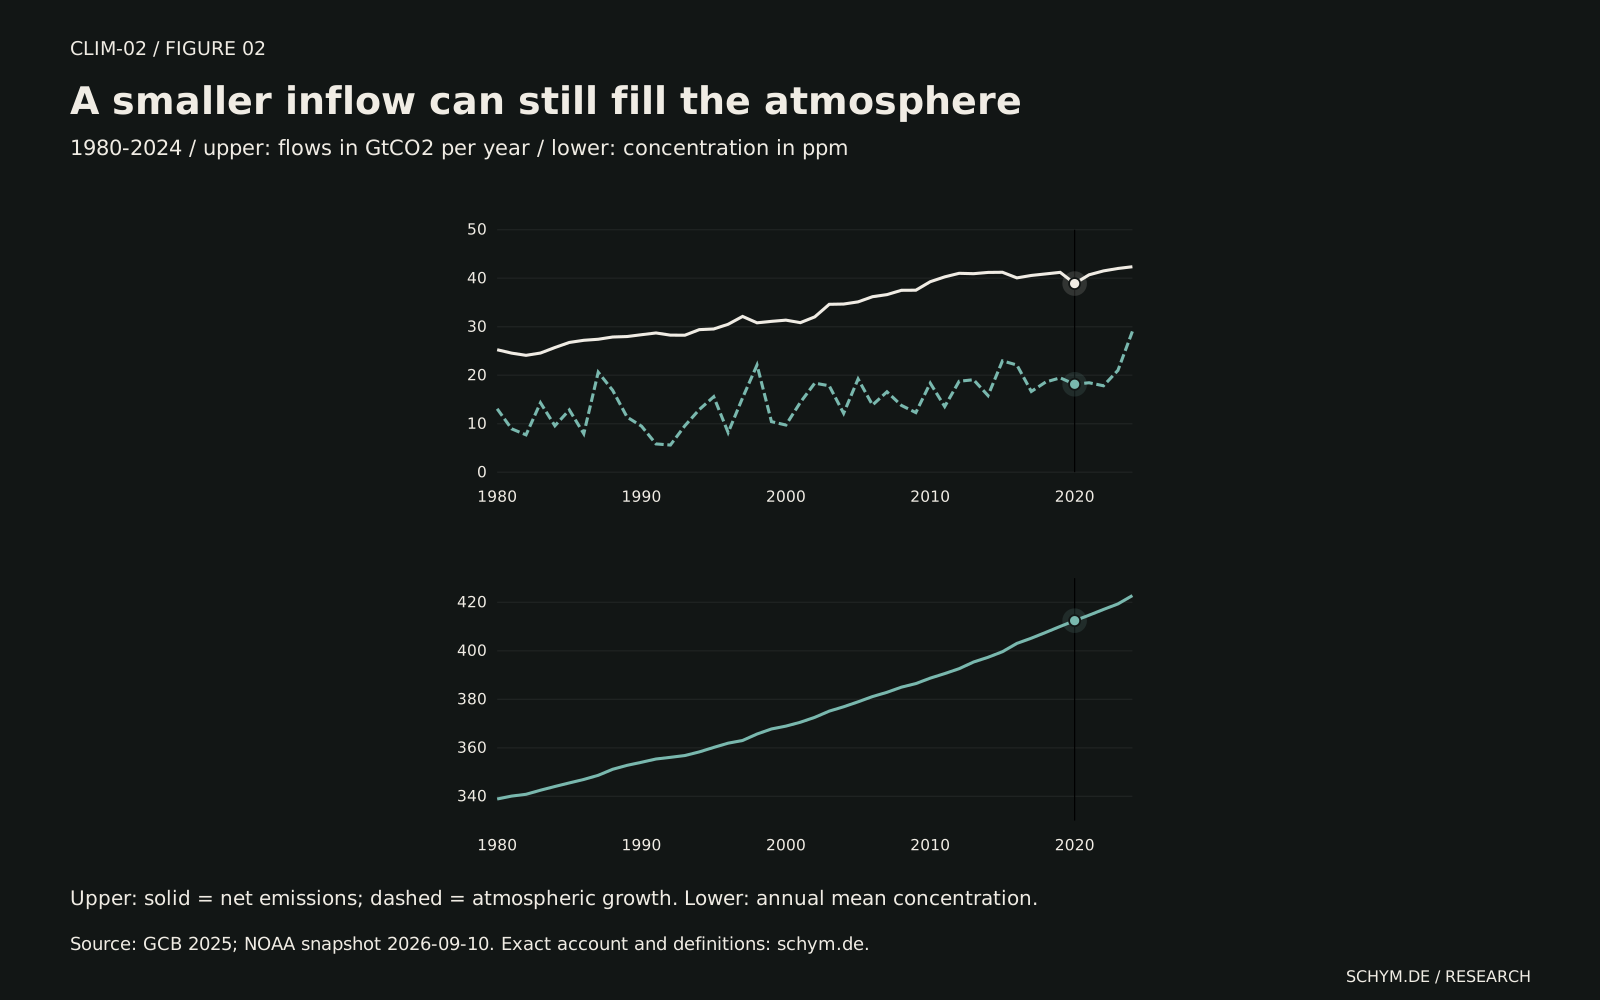
The two mass-flow lines share a scale. Net emissions include land-use change and subtract cement carbonation; atmospheric growth is the carbon added to the air during that year. Their separation reflects natural uptake and the accounting discrepancy. In 2020, the atmosphere still accumulated 18.1 billion tonnes of CO2.
Figure 02 / Two quantities, one calendar
A smaller inflow can still fill the atmosphere
The annual flow
GtCO2 per yearNet emissions: 38.892 GtCO2/year; Atmospheric growth: 18.133 GtCO2/year. Net emissions and atmospheric growth are different flows.
Preview. Click, tap, or press Enter to pin.The atmospheric stock
ppm; scale begins at 330Global concentration: 412.44 ppm. NOAA annual-mean uncertainty: 0.07 ppm.
Preview. Click, tap, or press Enter to pin.Sources: GCB 2025 for the two mass flows; NOAA Global Monitoring Laboratory for annual mean concentration, snapshot September 10, 2026. NOAA also supplies atmospheric observations used by GCB: these are not independent replications. Concentration differences are not substituted for GCB calendar-year growth.
Exact values and definitions
| Year | Net emissions / GtCO2 | Atmospheric growth / GtCO2 | Concentration / ppm | NOAA uncertainty / ppm |
|---|---|---|---|---|
| 1980 | 25.2509 | 13.0743 | 338.91 | 0.07 |
| 1981 | 24.5537 | 8.9497 | 340.11 | 0.08 |
| 1982 | 24.0967 | 7.7045 | 340.85 | 0.03 |
| 1983 | 24.5727 | 14.3195 | 342.53 | 0.06 |
| 1984 | 25.7083 | 9.5723 | 344.07 | 0.07 |
| 1985 | 26.7548 | 12.8409 | 345.54 | 0.07 |
| 1986 | 27.1971 | 7.9380 | 346.97 | 0.07 |
| 1987 | 27.4123 | 20.6232 | 348.68 | 0.10 |
| 1988 | 27.8741 | 16.8877 | 351.16 | 0.07 |
| 1989 | 27.9730 | 11.3622 | 352.79 | 0.06 |
| 1990 | 28.3500 | 9.4944 | 354.06 | 0.07 |
| 1991 | 28.7087 | 5.8368 | 355.40 | 0.06 |
| 1992 | 28.2612 | 5.6033 | 356.09 | 0.06 |
| 1993 | 28.2459 | 9.5723 | 356.83 | 0.07 |
| 1994 | 29.3938 | 12.9187 | 358.33 | 0.09 |
| 1995 | 29.5334 | 15.5647 | 360.18 | 0.04 |
| 1996 | 30.5031 | 8.1715 | 361.93 | 0.04 |
| 1997 | 32.1176 | 15.3312 | 363.04 | 0.05 |
| 1998 | 30.8020 | 22.1018 | 365.70 | 0.05 |
| 1999 | 31.1039 | 10.4283 | 367.79 | 0.06 |
| 2000 | 31.3515 | 9.7279 | 368.96 | 0.06 |
| 2001 | 30.8374 | 14.3973 | 370.56 | 0.05 |
| 2002 | 32.0260 | 18.3663 | 372.58 | 0.04 |
| 2003 | 34.6162 | 17.8215 | 375.14 | 0.04 |
| 2004 | 34.6725 | 12.1404 | 376.94 | 0.05 |
| 2005 | 35.1226 | 19.2224 | 378.98 | 0.05 |
| 2006 | 36.1857 | 13.8526 | 381.15 | 0.05 |
| 2007 | 36.6162 | 16.5764 | 382.90 | 0.05 |
| 2008 | 37.5046 | 13.7747 | 385.02 | 0.04 |
| 2009 | 37.5255 | 12.2961 | 386.50 | 0.04 |
| 2010 | 39.2778 | 18.3663 | 388.75 | 0.06 |
| 2011 | 40.2734 | 13.5413 | 390.62 | 0.06 |
| 2012 | 41.0090 | 18.7554 | 392.65 | 0.07 |
| 2013 | 40.9314 | 19.0667 | 395.40 | 0.06 |
| 2014 | 41.1895 | 15.7981 | 397.34 | 0.06 |
| 2015 | 41.2217 | 22.9579 | 399.65 | 0.05 |
| 2016 | 40.0653 | 22.1018 | 403.07 | 0.07 |
| 2017 | 40.5672 | 16.6542 | 405.22 | 0.07 |
| 2018 | 40.8845 | 18.5998 | 407.61 | 0.07 |
| 2019 | 41.2059 | 19.4558 | 410.07 | 0.08 |
| 2020 | 38.8920 | 18.1328 | 412.44 | 0.07 |
| 2021 | 40.7017 | 18.4441 | 414.70 | 0.06 |
| 2022 | 41.5038 | 17.8215 | 417.08 | 0.09 |
| 2023 | 42.0065 | 21.0123 | 419.35 | 0.10 |
| 2024 | 42.3623 | 29.0281 | 422.79 | 0.09 |
Concentration sits below them on its own scale. A ppm is a mole fraction in dry air, not a tonne and not an annual emission. The 2.37 ppm opening comparison subtracts NOAA's 2019 annual mean from its 2020 mean. GCB's atmospheric growth instead uses the calendar-year change in concentration. Those definitions need not produce the same number.
This is a descriptive comparison, not an estimate of the effect of the pandemic or of a particular policy. It demonstrates why a falling emissions series and a rising concentration series can both be correct.
04 / Beyond the annual account
The ledger continues after the year ends.
Three findings from the wider literature explain why the next year's account cannot be predicted by freezing the last one. These are external scientific results, not estimates fitted to the charts above.
Model experiment
Carbon has more than one clock.
- of an idealized pulse remains after 1,000 years
- 25 ± 9%
Joos and colleagues compared models given a 100 GtC pulse on a constant 389 ppm CO2 background. Uptake is relatively rapid during the first decades, but the atmospheric response has a millennium-scale tail. Their reported atmospheric remainder after 1,000 years is 25 ± 9%.
Boundary. The pulse is measured in GtC, not GtCO2. Its response depends on pulse size and background conditions. The reported model spread is not an observational confidence interval for the annual airborne fraction above.
Method and interpretation
This is the published PD100 experiment, not a pathway calculated on this page. Figure 1 gives an equally weighted multi-model mean and a plus/minus two-standard-deviation range. The contributing model count changes with the time horizon.
Assessed projection
Historical uptake is not a fixed allowance.
- natural uptake responds to changing conditions
- No fixed discount
AR6 assesses that, under scenarios with increasing CO2 emissions, land and ocean sinks become less effective at slowing atmospheric accumulation. A historical retained share cannot safely be carried forward as an unchanging rule.
Boundary. Lower effectiveness does not mean that every sink must immediately absorb fewer tonnes in absolute terms. Nor does one high annual airborne fraction identify permanent sink weakening.
Method and interpretation
The assessment draws on carbon-cycle understanding and scenario experiments. It is separate from this page's descriptive ratio of summed atmospheric growth to summed emissions.
Assessed physical requirement
The endpoint is different from the turning point.
- required to limit human-induced warming to a specific level
- At least net zero CO2
AR6 states that limiting human-induced warming to a specified level requires limiting cumulative CO2 emissions and reaching at least net zero CO2, alongside strong reductions in other greenhouse gases. A decline in a still-positive emissions flow is a step along that path, not evidence that the endpoint has been reached.
Boundary. A carbon account, a concentration target and a warming target are different statements. This page neither estimates a remaining carbon budget nor simulates temperatures after emissions cease.
Method and interpretation
This is the IPCC's physical-science assessment, not an attribution result from the 45-year account. The naturally responding land and ocean sinks in the chart are not, by themselves, evidence that anthropogenic emissions have reached net zero.
05 / What follows
Peak emissions would be a turning point, not the endpoint
The stock-flow distinction changes what a successful emissions headline can mean. A decline matters, but it does not by itself mean that atmospheric CO2 is falling or that warming has stopped. The IPCC's assessment is that limiting human-caused warming requires net zero CO2 emissions; the path of other greenhouse gases matters as well. That conclusion comes from the wider scientific assessment, not from fitting these 45 annual observations.
For readers comparing climate claims, three questions are more useful than one headline number: What was emitted? What accumulated? What is known about the difference? An honest carbon account keeps all three visible.
The limits belong in the account
- Surface-network concentration does not instantaneously measure the entire three-dimensional atmospheric burden. The final GCB paper identifies mixing and detection timing as an important source of annual discrepancies, especially in 2023-2024. The 2024 land-use estimate also relies on extrapolated land-use forcing after 2023.
- The 2024 published imbalance is -6.2 GtCO2/year. Estimated atmospheric growth and sinks exceed estimated emissions. This is an accounting discrepancy, not a newly observed source, sink or violation of carbon conservation.
- NOAA observations also underpin the GCB atmospheric series. Showing both is not an independent replication. The newer NOAA snapshot is not substituted into the frozen GCB budget.
- The account is global and annual. It cannot attribute an individual weather event, quantify one policy's effect, identify permanent sink weakening or forecast a future airborne fraction.
- The workbook's 2025 projection is not used. The common published display ends in 2024, even though the separately frozen NOAA annual-mean file contains 2025.
- The long-tail illustration comes from a published idealized model experiment: a 100 GtC pulse on a constant 389 ppm background. Its 1,000-year remainder and model spread are not an observational interval for this account, and no pulse-response simulation runs on this page.
Methods, uncertainty and provenance
The source is the official Global Carbon Budget 2025 workbook downloaded on September 10, 2026, plus NOAA's globally averaged annual concentration file created on September 5 and retrieved on September 10, 2026. The original inputs are immutable and hash-bound. The workbook still contains a placeholder paper citation; it is identified here by its release, download URL and byte hash, not by that placeholder.
All seven components come from the workbook's Global Carbon Budget summary sheet, which explicitly uses GtC/year. The separate cement sheet has inconsistent prose about million tonnes; its GCB values and the global account agree in GtC. We use the unambiguous summary, preserve cement separately and multiply by the source's factor 3.664 to obtain GtCO2. Each of the 66 source-year identities is checked before selecting 1980-2024. No values are rounded before calculation.
The budget identity is fossil emissions + land-use emissions = atmospheric growth + ocean sink + land sink + cement sink + imbalance. The displayed net-emissions denominator subtracts cement uptake. Five-year accounts are arithmetic means of five complete annual accounts; five-year airborne fractions are ratios of summed atmospheric growth to summed net emissions. Incomplete windows remain unavailable.
NOAA's concentration uncertainty is retained in the exact table and selected-year readout. It is the published uncertainty of an annual global mean, based on variation across network realizations. It is not an interval for the difference between annual means. The carbon-budget workbook describes its component uncertainties as one-sigma errors, but supplies typical or average uncertainties for several components rather than a complete annual covariance model. The table below preserves that distinction. No confidence band for the residual or airborne fraction is manufactured.
| Component | Reported uncertainty | Meaning |
|---|---|---|
| 2024 land sink: final-paper check | 1.9 +/- 0.9 GtC/year | Friedlingstein et al. (2026), section 3.7.3; year-specific one-sigma range, larger than the workbook's generic average note below |
| Fossil fuels and industry | 5% | One-sigma relative uncertainty in the summary sheet |
| Land-use change | 0.7 GtC/year | One-sigma uncertainty in the summary sheet |
| Atmospheric growth | About 0.17 GtC/year | Typical annual uncertainty for 1980-2024 in the atmospheric sheet |
| Ocean sink | About 0.4 GtC/year | Average one-sigma uncertainty, not year-specific bounds |
| Land sink | About 0.5 GtC/year | Average one-sigma uncertainty, not year-specific bounds |
| Cement uptake; imbalance; airborne fraction | No interval shown | The compact account does not supply the information needed for a defensible propagated interval |
- Friedlingstein et al. (2026): Global Carbon Budget 2025
Final peer-reviewed paper, published May 13, 2026; doi:10.5194/essd-18-3211-2026. Sections 2.4 and 3.4-3.9 confirm rounded 2024 components and qualify annual atmospheric mixing and land-sink uncertainty. Supplemental data DOI: 10.18160/GCP-2025. Annual-total changes here are not leap-year-adjusted rates.
- Global Carbon Budget 2025: official data release
Fossil and land-use emissions, atmospheric growth, land and ocean uptake, cement carbonation and the signed budget imbalance. We acknowledge the Global Carbon Project and the contributing land-model, ocean-model and fCO2-mapping groups.
- NOAA: globally averaged CO2
Lan, Tans and Thoning; doi:10.15138/9N0H-ZH07. Global marine-surface concentration and annual-mean uncertainty. These observations also contribute to GCB.
- NOAA: how annual growth is defined
Calendar-year growth uses the end-December to start-January difference, estimated using seasonally corrected December-January averages. It is not the difference between annual means.
- IPCC AR6 Synthesis Report, Summary for Policymakers
Scientific framing: A.1 and B.5. No new attribution or warming projection is estimated here.
- Joos et al. (2013): Carbon dioxide and climate impulse response functions
Published PD100 multi-model pulse experiment; abstract and Figure 1. Model mean and plus/minus two-standard-deviation range; not a historical airborne-fraction confidence interval.
- IPCC AR6 Working Group I: headline statements
B.4 on sink effectiveness under increasing-emissions scenarios, and D.1 on cumulative emissions, at least net zero CO2, and other greenhouse gases.