A Schym research programme / IPCC AR6
Climate Atlas 01 / Time & place
Climate change,
across time and place.
Twenty-five evidence-led questions about a planet that is warming unevenly, changing locally, and being shaped by decisions made over decades.
+1.26°C2016-2025 global mean
above 1850-1900 / IGCC 2025
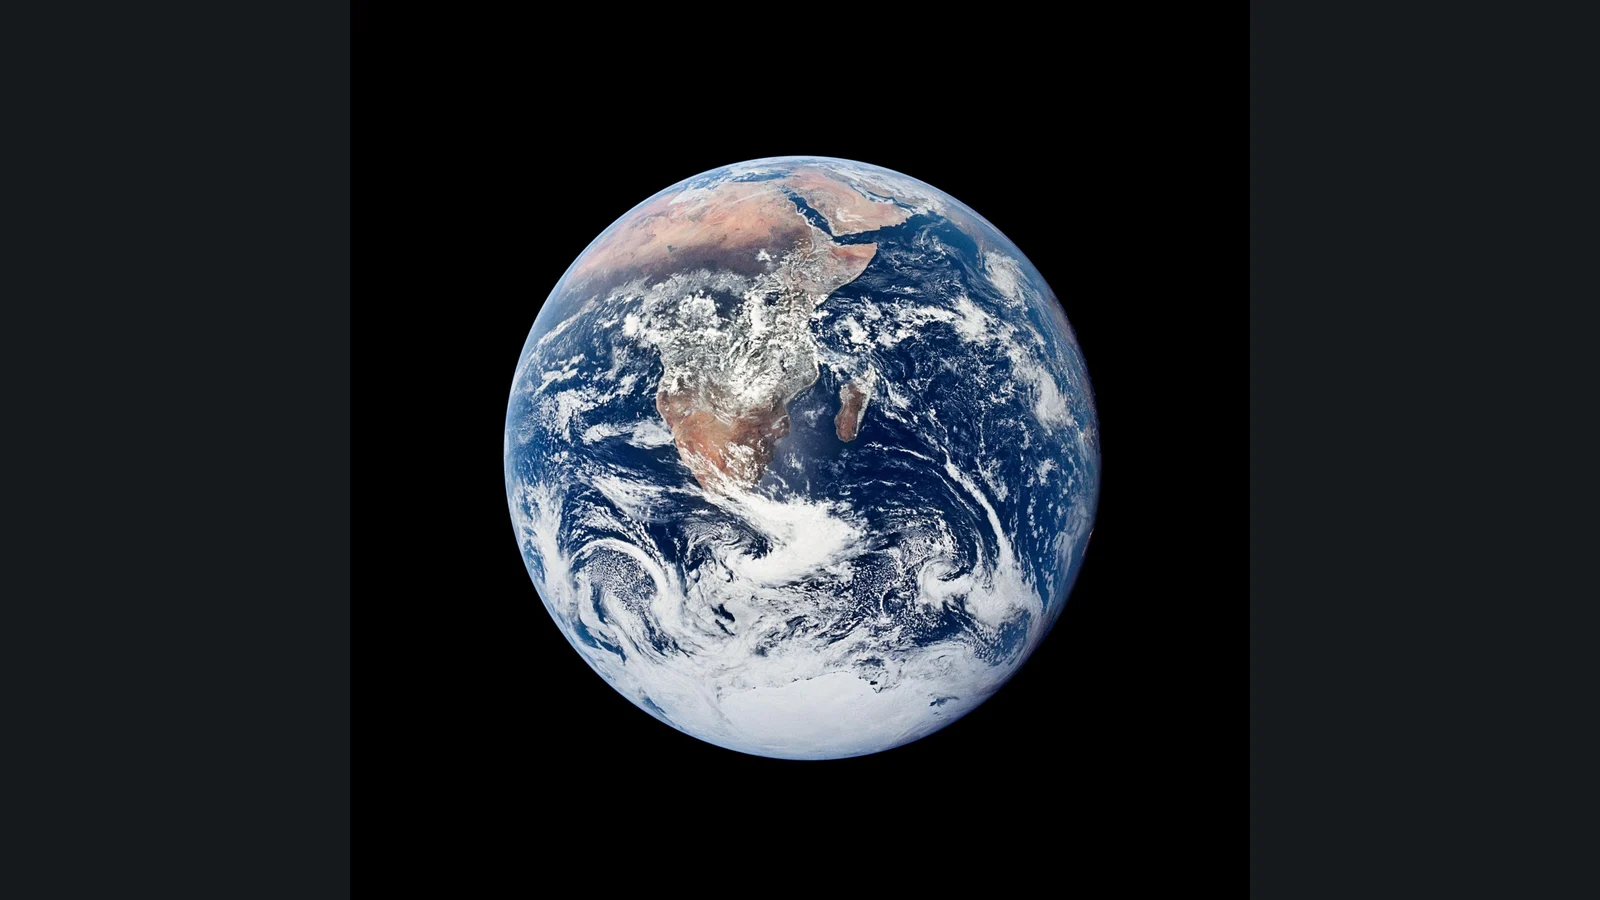
NASA/Apollo 17 crew. Earth with Africa and Antarctica visible, photographed by the Apollo 17 crew on December 7, 1972. Contextual photograph, not a climate measurement.
The Climate Pulse
Global surface temperature / 1850-1900 = 02025Annual +1.391°C10-year mean +1.256°C
*Latest complete year: 2025. One year is not the climate trend.
Methods and exact values
The 1.0°C and 1.5°C guides are reference levels, not dated climate thresholds. Means require ten complete years; they are not attribution estimates or Paris Agreement compliance measures.
Source dataset / v2026.06.02 / First IPCC assessment: 1990
Exact temperature record
| Year | Annual anomaly |
|---|---|
| 1850 | -0.046 |
| 1851 | 0.041 |
| 1852 | 0.099 |
| 1853 | 0.054 |
| 1854 | 0.049 |
| 1855 | 0.076 |
| 1856 | -0.021 |
| 1857 | -0.114 |
| 1858 | -0.049 |
| 1859 | 0.051 |
| 1860 | -0.059 |
| 1861 | -0.116 |
| 1862 | -0.184 |
| 1863 | -0.039 |
| 1864 | -0.074 |
| 1865 | 0.034 |
| 1866 | 0.014 |
| 1867 | -0.011 |
| 1868 | 0.059 |
| 1869 | 0.066 |
| 1870 | 0.026 |
| 1871 | -0.004 |
| 1872 | 0.034 |
| 1873 | 0.016 |
| 1874 | -0.056 |
| 1875 | -0.006 |
| 1876 | -0.041 |
| 1877 | 0.306 |
| 1878 | 0.364 |
| 1879 | 0.084 |
| 1880 | 0.039 |
| 1881 | 0.134 |
| 1882 | 0.061 |
| 1883 | 0.016 |
| 1884 | -0.116 |
| 1885 | -0.109 |
| 1886 | -0.101 |
| 1887 | -0.159 |
| 1888 | 0.006 |
| 1889 | 0.124 |
| 1890 | -0.154 |
| 1891 | -0.044 |
| 1892 | -0.131 |
| 1893 | -0.134 |
| 1894 | -0.136 |
| 1895 | -0.059 |
| 1896 | 0.084 |
| 1897 | 0.094 |
| 1898 | -0.106 |
| 1899 | 0.029 |
| 1900 | 0.121 |
| 1901 | 0.071 |
| 1902 | -0.069 |
| 1903 | -0.191 |
| 1904 | -0.251 |
| 1905 | -0.074 |
| 1906 | 0.026 |
| 1907 | -0.154 |
| 1908 | -0.191 |
| 1909 | -0.219 |
| 1910 | -0.186 |
| 1911 | -0.206 |
| 1912 | -0.129 |
| 1913 | -0.119 |
| 1914 | 0.076 |
| 1915 | 0.131 |
| 1916 | -0.089 |
| 1917 | -0.209 |
| 1918 | -0.081 |
| 1919 | -0.001 |
| 1920 | 0.036 |
| 1921 | 0.076 |
| 1922 | -0.009 |
| 1923 | 0.014 |
| 1924 | 0.014 |
| 1925 | 0.054 |
| 1926 | 0.186 |
| 1927 | 0.084 |
| 1928 | 0.089 |
| 1929 | -0.071 |
| 1930 | 0.151 |
| 1931 | 0.199 |
| 1932 | 0.151 |
| 1933 | -0.001 |
| 1934 | 0.146 |
| 1935 | 0.111 |
| 1936 | 0.151 |
| 1937 | 0.301 |
| 1938 | 0.291 |
| 1939 | 0.284 |
| 1940 | 0.391 |
| 1941 | 0.351 |
| 1942 | 0.299 |
| 1943 | 0.336 |
| 1944 | 0.464 |
| 1945 | 0.346 |
| 1946 | 0.191 |
| 1947 | 0.241 |
| 1948 | 0.179 |
| 1949 | 0.161 |
| 1950 | 0.086 |
| 1951 | 0.231 |
| 1952 | 0.319 |
| 1953 | 0.386 |
| 1954 | 0.181 |
| 1955 | 0.124 |
| 1956 | 0.066 |
| 1957 | 0.294 |
| 1958 | 0.309 |
| 1959 | 0.289 |
| 1960 | 0.226 |
| 1961 | 0.311 |
| 1962 | 0.266 |
| 1963 | 0.299 |
| 1964 | 0.039 |
| 1965 | 0.141 |
| 1966 | 0.194 |
| 1967 | 0.224 |
| 1968 | 0.169 |
| 1969 | 0.309 |
| 1970 | 0.264 |
| 1971 | 0.149 |
| 1972 | 0.261 |
| 1973 | 0.399 |
| 1974 | 0.169 |
| 1975 | 0.229 |
| 1976 | 0.141 |
| 1977 | 0.449 |
| 1978 | 0.336 |
| 1979 | 0.421 |
| 1980 | 0.536 |
| 1981 | 0.584 |
| 1982 | 0.381 |
| 1983 | 0.564 |
| 1984 | 0.394 |
| 1985 | 0.381 |
| 1986 | 0.444 |
| 1987 | 0.569 |
| 1988 | 0.619 |
| 1989 | 0.501 |
| 1990 | 0.689 |
| 1991 | 0.666 |
| 1992 | 0.466 |
| 1993 | 0.509 |
| 1994 | 0.569 |
| 1995 | 0.721 |
| 1996 | 0.604 |
| 1997 | 0.749 |
| 1998 | 0.894 |
| 1999 | 0.651 |
| 2000 | 0.654 |
| 2001 | 0.804 |
| 2002 | 0.879 |
| 2003 | 0.871 |
| 2004 | 0.799 |
| 2005 | 0.946 |
| 2006 | 0.901 |
| 2007 | 0.911 |
| 2008 | 0.786 |
| 2009 | 0.919 |
| 2010 | 0.989 |
| 2011 | 0.866 |
| 2012 | 0.899 |
| 2013 | 0.929 |
| 2014 | 0.994 |
| 2015 | 1.144 |
| 2016 | 1.261 |
| 2017 | 1.166 |
| 2018 | 1.094 |
| 2019 | 1.214 |
| 2020 | 1.249 |
| 2021 | 1.096 |
| 2022 | 1.139 |
| 2023 | 1.439 |
| 2024 | 1.511 |
| 2025 | 1.391 |
Annual +1.391°C; complete ten-year mean +1.256°C. Both relative to 1850-1900. A single year does not establish a sustained warming threshold.
The Climate Machine
How Earth moves heat, water and carbon. Open one connected planet, follow its reservoirs and flows, then inspect four independent observations.
A foundation for the 25 questions, not another numbered study. Illustrated and reduced-motion reading paths included.The published evidence
The stories behind the signal.
Time meets place
An atlas of a changing planet.
Twenty-five questions. Three scientific divisions.
One programme with an explicit evidence boundary.
Research controls
25 of 25 questionsAll time horizons
01 / Time
When the evidence changes
- 1850 onwardLong-run history12Historical records and baselines
- The presentObserved change23Recent evidence and current exposure
- The coming decadesDecision window13Responses now; conditional near-term futures
- Around 2050Mid-century7Scenario / projection
- 2100 and beyondLong-lived change5Scenario / projection and commitment
Research horizons, not evenly spaced dates. Dotted marks: scenario / projection. Response studies can inform future decisions using historical evidence.
02 / Place
Where change lands
All horizons / observation cursor 2025
All placesCLIM-18 / 17 countries across Europe, Asia, the Americas, Africa and Oceania, plus World and fixed current EU-27; aggregates overlap with countries
Natural Earth / public domain1:110m outlines / orthographic views
The research constellation
Questions held in view.
Evidence comes with a place, a period and a boundary.
- CLIM-18
Latest study / 2026-09-24
IPCC / SPM.CData studyMixed evidenceThe moving target for clean power
How much of the change in fossil electricity generation is accounted for by total generation growth and changes in non-fossil output?
Global2000-2025 / published electricity accounts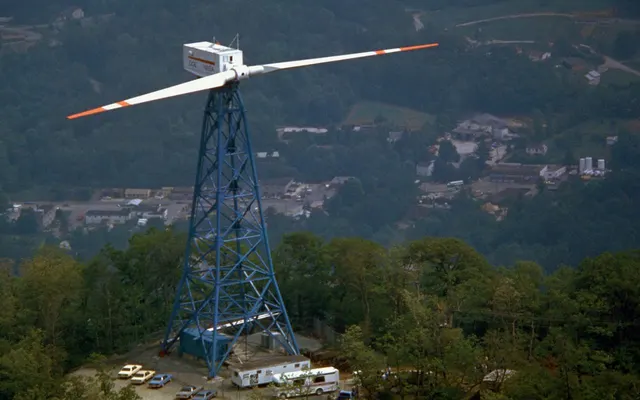
- CLIM-05IPCC / SPM.AData studyMixed evidence
The heat a thermometer misses.
When national hot-day counts fall, do vulnerable groups necessarily experience less heatwave exposure?
Germany1980-2024 matched exposure / newer weather kept separate - CLIM-04IPCC / SPM.AData studyMixed evidence
The heat below the surface.
How do changes in ocean heat storage compare with surface-temperature variation over aligned, sufficiently long observation windows?
Ocean1971-2024 / dated ocean inventory; assessed periods to 2025 - CLIM-03IPCC / SPM.AData studyObserved
Two poles, different losses.
How do seasonal sea-ice changes differ between hemispheres when months, reference periods and measurement definitions are held consistent?
Polar1979-2025 / same-month histories - CLIM-02IPCC / SPM.AData studyMixed evidence
Less emitted. Still accumulating.
What accounts for the difference between annual anthropogenic CO2 emissions and the annual increase in atmospheric carbon?
Global1980-2024 / carbon account - CLIM-01IPCC / SPM.AData studyObserved
What does a cooler year say about warming?
How does an annual temperature change compare with changes between complete decades in the same observational record?
Global1850-2025 / observed record - CLIM-06IPCC / SPM.AResearch primerMixed evidence
How does heat change the capacity to work outdoors?
How do modeled heat-related labor-capacity losses differ across sectors and countries with different adaptation-readiness profiles?
Across countriesTarget 2000-2024 / work and heat - CLIM-07IPCC / SPM.AResearch primerObserved
Where do European weather losses and insurance gaps coincide?
How do reported economic losses and insured shares differ across European countries, and what remains hidden by national readiness scores?
Germany / EuropeTarget 1980-2024 / reported losses - CLIM-08IPCC / SPM.AResearch primerMixed evidence
How do historical emissions compare with present vulnerability?
Do countries' positions change when cumulative fossil CO2, current per-capita emissions and present vulnerability are considered separately?
Across countriesTarget 1850-2024 / present vulnerability - CLIM-09IPCC / SPM.AResearch primerMixed evidence
Where does water stress coincide with food vulnerability?
Which countries combine high baseline water stress with vulnerable food systems, and how stable is that comparison across indicator choices?
Across countriesBaseline climatology / recent food vulnerability - CLIM-10IPCC / SPM.AResearch primerResponse-oriented
Do stronger readiness scores coincide with health adaptation planning?
How do national adaptation-readiness profiles compare with reported health adaptation planning among countries covered by comparable survey rounds?
Across countriesTarget 2015-2024 / readiness and planning - CLIM-11IPCC / SPM.BResearch primerScenario / projection
What does another half-degree mean for European summer heat?
How do regional summer-temperature and heat-extreme projections differ between global warming levels of 1.5, 2 and 3 degC?
Germany / Europe1.5, 2 and 3 degrees / no assigned date - CLIM-12IPCC / SPM.BResearch primerMixed evidence
Where could changing water stress challenge electricity systems?
Which countries combine projected changes in water stress with electricity mixes that warrant closer examination of water dependence?
Across countriesBaseline / 2030 and 2050 scenarios - CLIM-13IPCC / SPM.BResearch primerMixed evidence
Why does coastal planning need more than a 2100 endpoint?
How do observed global sea-level change and assessed longer-term commitment alter the questions asked of coastal infrastructure vulnerability?
CoastalObserved sea level / 2100 and beyond - CLIM-14IPCC / SPM.BResearch primerScenario / projection
Where could summer heat and drying intensify together?
Do Central European regional projections show concurrent shifts in summer heat and moisture conditions across the same models and scenarios?
Germany / Europe2041-2060 / 2081-2100 scenarios - CLIM-15IPCC / SPM.BResearch primerScenario / projection
How much does a remaining carbon budget depend on its assumptions?
How do published remaining-budget estimates vary with temperature limit, likelihood and assumptions about non-CO2 warming?
GlobalStart-2026 budgets / conditional future - CLIM-16IPCC / SPM.BResearch primerMixed evidence
What pace of emissions reduction do assessed pathways imply?
How do recent global emissions changes compare with the reduction ranges in AR6 Table SPM.1 on a compatible accounting basis?
Global2019 reference / 2030-2050 pathways - CLIM-17IPCC / SPM.BResearch primerScenario / projection
How does time above a warming level differ across scenarios?
What do compact global scenario trajectories show about the magnitude and duration of warming-level exceedance within their published time horizons?
GlobalTarget 2021-2100 / scenario trajectories - CLIM-19IPCC / SPM.CResearch primerResponse-oriented
Which German sectors account for the emissions change?
How are changes in Germany's reported greenhouse gas emissions distributed across sectors, gases and alternative reference years?
GermanyTarget 1990-2024 / sector inventories - CLIM-20IPCC / SPM.CResearch primerResponse-oriented
Does clean-energy finance reach the same regions as new capacity?
How does the regional distribution of tracked renewable-energy finance compare with the distribution of wind and solar capacity additions?
Reporting regionsTarget 2010-2025 capacity / 2019-2023 finance - CLIM-21IPCC / SPM.CResearch primerResponse-oriented
How much do headline carbon prices reveal about emissions coverage?
How do published carbon prices, covered emissions shares and sector coverage differ across national and regional pricing instruments?
Across countriesTarget 2026 policy snapshot / 2024-2025 coverage - CLIM-22IPCC / SPM.CResearch primerResponse-oriented
How large are carbon-pricing revenues beside tracked climate investment?
What is the scale of reported carbon-pricing revenue relative to tracked climate-finance flows over genuinely comparable periods?
GlobalTarget 2019-2024 / revenue and investment - CLIM-23IPCC / SPM.CResearch primerMixed evidence
Does cleaner electricity coincide with lower air-pollution health burdens?
How do changes in fossil electricity generation compare with published air-pollution mortality estimates across a fixed country panel?
Across countriesTarget 2010-2024 / power and health - CLIM-24IPCC / SPM.CResearch primerResponse-oriented
Does adaptation finance reach the most vulnerable regions?
How does the regional distribution of tracked adaptation finance compare with the distribution of country vulnerability within those regions?
Reporting regionsTarget 2019-2023 / adaptation allocations - CLIM-25IPCC / SPM.CResearch primerResponse-oriented
What does the grant-and-debt mix reveal about adaptation finance?
How do the financial instruments used for tracked adaptation finance vary across reporting regions and their readiness profiles?
Reporting regionsTarget 2019-2023 / grants and loans
The scientific frame
Three different kinds of question.
Observed world exposed world choices ahead
An observation is not a projection. Exposure is not vulnerability, and an emissions inventory is not a measure of historical responsibility. The programme preserves those distinctions before comparing the numbers.
Sources, methods, and the evidence boundaryThe map does not predict a single future. It shows where evidence is strongest, where risks concentrate, and where choices still matter.